
Development of a universal high-throughput calcium assay for G-protein-coupled receptors with promiscuous G-protein Gα15/161
Introduction
G-protein-coupled receptors (GPCR) constitute one of the largest and most versatile families of cell surface receptors[1]. GPCR recognize and respond to a variety of extracellular stimulants and endogenous ligands, including light, odors, taste substances, hormones, chemotactic factors, and neurotransmitters[2]. Due to the variety of physiological and pathological functions regulated by GPCR, they were considered the most promising drug targets in the pharmaceutical industry. It is estimated that over 50% of the marketed drugs are modulators of GPCR functions[3,4]. With the completion of the Human Genome Project, approximately 1000 genes encoding GPCR were identified, but only about 200 have known ligands and functions[5]. Searching for ligands of the orphan GPCR and better modulators of known receptors will provide new opportunities in future drug discovery.
GPCR are 7 transmembrane proteins with the amino terminal and carboxy terminal located in the extracellular and intracellular spaces, respectively[6]. After ligand stimulation, GPCR undergo conformational change and activate the intracellular G-proteins, which are composed of α, β, and γ-subunits, and then initiate signaling to the cell interior[7]. Based upon the structure and downstream signaling cascade, the Gα subunit is mainly divided into 4 families: Gαs, Gαi/o, Gαq, and Gα12[8]. GPCR coupling to Gαs (including Gαs[s], Gαs[l], Gαs[xl], Gαs[xxl], and Gαolf) activate adenylate cyclase, which catalyses cAMP production. Contrarily, Gαi/o (including Gαt[r], Gαt[c], Gαgust, Gαi1, Gαi2, Gαi3, Gαo1, Gαo2, Gαo3, and Gαz) inhibit cAMP production. GPCR coupling to Gαq (including Gαq, Gα11, Gα14, and Gα15/16) activate phospholipase Cβ, which catalyzes the generation of IP3 and calcium release from intracellular store[9,10]. Gα12 (including Gα12 and Gα13) is believed to be related to the activation of Ras, Raf, and ERK pathway[11].
Based on the signal transduction cascade of GPCR, several assay techniques for GPCR ligand screening, such as radioligand binding, [35S]-GTPγS binding, reporter gene, cAMP detection, and calcium mobilization are commonly used. Radiometric techniques not only require an advanced laboratory, but also generate environment pollution and impair people’s health. So non-radiometric assays, especially cell-based functional assays, played more important roles in primary screening[12]. However, these assays can only be applied for selected Gα subtypes. For example, cAMP assay can only be used for Gαs and Gαi/o-coupled GPCR, and calcium mobilization only for Gαq-coupled receptors. These assays require well-characterized signaling pathway of the receptors, so they would be difficult to apply to orphan GPCR.
It is therefore apparent that a universal high-throughput screening (HTS) approach for GPCR ligand screening would be valuable. Previous studies have demonstrated that most receptors promiscuously couple to several Gα subtypes, but because one of the G-proteins occupied the dominant status, it is hard to detect signals induced by other Gα subtypes[13]. Overexpression of certain Gα subunits can shift the original coupling pathway of GPCR to the new one[13,14]. In the present paper, we tested the coupling of the promiscuous G-protein Gα15/16 (mouse/human orthologs, respectively[15]) with various receptors that originally coupled to the Gαs, Gαi, or Gαq pathways. We found out for all the receptors tested, Gα15/16 shifted the receptors coupling to the calcium mobilization pathway, and intracellular calcium change could be easily detected with a Fluo-4 fluorescent indicator. Ligand efficacy measured by this method was comparable with the value obtained using traditional methods. This assay was validated with the δ-opioid receptor (DOR), which originally coupled to Gαi and may play important roles in pain, neurodegenerative, and autoimmune diseases[16−18]. A large-scale screening of 48 000 compounds was performed based on this system. Several new modulators (including both agonists and antagonists) were identified and confirmed with the traditional [35S]-GTPγS binding assay. This cell-based calcium assay was proved to be robust and easy to automate, and could be used as a universal method for the search of GPCR modulators.
Materials and methods
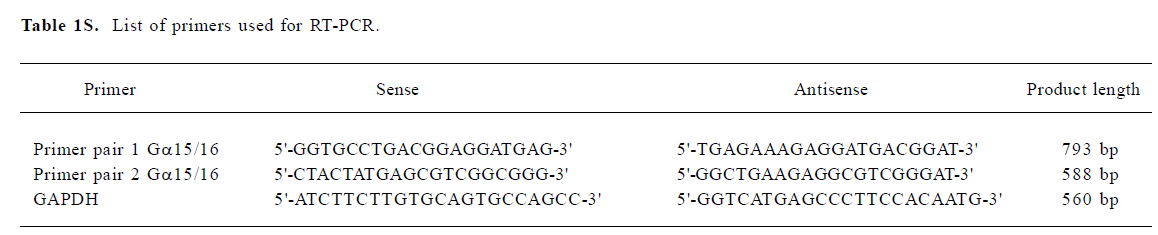
Reagents Mammalian expression vectors encoding cannabinoid receptors 1 and 2 (CB1 and CB2), α1a adrenergic receptor (α1aAR), α2b adrenergic receptor (α2bAR), dopamine receptor 5 (DRD5), and Gα15/16 were purchased from UMR cDNA Resource Center (Rolla, MO, USA). Plasmids encoding chemokine receptors CCR5, CXCR4, δ-opioid receptor, and β2 adrenergic receptor (β2AR) were kindly provided by Dr Gang Pei from Shanghai Institutes for Biological Sciences (Shanghai, China). Fluo-4 AM was purchased from Invitrogen (Carlsbad, CA, USA). FlashBlue GPCR scintillation beads and [35S]-GTPγS were products of PerkinElmer (Boston, MA, USA). SDF-1 was purchased from GL Biochem (Shanghai, China). Sulfinpyrazone, RANTES, DPDPE, isoproterenol, phenylephrine, dopamine, noradrenalin, TIPP-ψ, naltrindole, [D-Ala2]-deltorphin II and DADLE were purchased from Sigma–Aldrich (St Louis, MO, USA). Other reagents and solvents used in the experiments were of analytical grade.
Cell transfection CHO-K1 or HEK293 cells were obtained from ATCC (Manassas, VA, USA) and maintained in F12 nutritional medium or Dulbecco’s modified Eagle’s medium supplemented with 10% fetal bovine serum, 100 mg/L penicillin, and 100 mg/L streptomycin at 37 °C in a humidified atmosphere of 5% CO2. For transient transfection, approximately 1×10⁶ cells were mixed with 2 µg plasmids in 200 µL transfection buffer, and electroporation was carried out with a Scientz-2C electroporation apparatus (Scientz Biotech, Ningbo, China). The experiments were carried out 24 h after transfection. For stable cell line generation, the transfected cells were seeded into 10 cm dishes, and proper antibiotics (500 µg/mL G418 and/or 20 µg/mL blasticidin) were added to the culture medium the next day. The selection medium was changed every 3 d until colonies were formed. The single colony was picked up, expanded, and tested for the expression of transfected genes.
Calcium mobilization assay CHO cells co-transfected with receptors and Gα15/16 were plated onto 96-well plates at a density of 30 000 cells/100 µL per well and incubated overnight. The cells were loaded with 2 µmol/L Fluo-4 AM in Hanks’ balanced salt solution (HBSS; containing 5.4 mmol/L KCl, 0.3 mmol/L Na2HPO4, 0.4 mmol/L KH2PO4, 4.2 mmol/L NaHCO3, 1.3 mmol/L CaCl2, 0.5 mmol/L MgCl2, 0.6 mmol/L MgSO4, 137 mmol/L NaCl, 5.6 mmol/L D-glucose, and 250 µmol/L sulfinpyrazone, pH 7.4) at 37 °C for 50 min. After removal of the excess dye, the cells were rinsed with HBSS once. In the antagonist mode, 50 µL HBSS containing known antagonists (positive control), compounds of interest, or DMSO (negative control, final concentration 1%) were added. After incubation at room temperature for 10 min, 25 µL agonists were dispensed into the well with a FlexStation II micro-plate reader (Molecular Devices, Sunnyvale, CA, USA), and intracellular calcium change was recorded with an excitation wavelength of 485 nm and emission wavelength of 525 nm. In the agonist mode, 50 µL HBSS was added to the dye-loaded cells, and 25 µL of known agonists (positive control), compounds of interest, or DMSO (negative control, final concentration 1%) were added with FlexStation II, and calcium change was measured.
[35S]-GTPγS binding assay Cell membranes were isolated as previously described[19]. In brief, CHO/DOR cells were pelleted by centrifugation and resuspended in lysis buffer (5 mmol/L Tris-HCl, 5 mmol/L EDTA, and 5 mmol/L EGTA, pH 7.5), and then homogenized with a Dounce tissue grinder. The lysate was centrifuged at 1000×g for 10 min. After removal of the deposition, crude membranes were then pelleted by centrifugation at 12 000×g for 15 min at 4 °C. The membranes were resuspended in reaction buffer (20 mmol/L HEPES, 100 mmol/L NaCl, and 5 mmol/L MgCl2, pH 7.4), and the protein concentration was determined using the Bradford method[20]. The exchange of [35S]-GTPγS was measured using a scintillation proximity assay, as previously described[21]. For each assay point, 5 µg membrane was incubated in 100 µL reaction buffer for 3 h at 30 °C with 100 µg FlashBlue GPCR beads, 10 µmol/L GDP, 10 µg/mL saponin, 0.2 nmol/L [35S]-GTPγS, and the indicated concentration of compounds. For non-specific basal binding measurement, 2 µmol/L GTPγS was added. Membrane-bound [35S]-GTPγS was measured with a Microbeta scintillation counter (PerkinElmer, Waltham, MA, USA).
HTS campaign The compound library used for the screening of DOR modulators was comprised of 48 000 different compounds. A 10 compound pool/well mix was applied to the primary screening in the antagonistic mode, with an average final concentration of 4.4 µmol/L for each compound. This matrix system maximized the advantage of HTS and allowed duplicate screening of each compound[22]. In each 96-well plate, 8 wells were used as positive controls (100 nmol/L TIPP-ψ in 1% DMSO) and another set of 8 wells as negative controls (1% DMSO). The inhibition rate of 100 nmol/L TIPP-ψ was normalized to 100%, and that of the negative control was 0. The inhibition rate of each compound was calculated with the following equation:
Inhibition %=(Calcium peak value compound–calcium peak value 1%DMSO)/(calcium peak value TIPP-ψ –calcium peak value 1%DMSO)×100%. The samples showing more than 70% inhibition were considered “hits” in the primary screening.
Data analysis Data were analyzed with GraphPad Prism software (GraphPad, San Diego, CA, USA). Non-linear regression analyses were performed to generate dose-response curves and calculate EC50 or IC50 values. Linear regression was used to analyze data reproducibility. Two-tailed Student’s t-test was applied to analyze differences. The Z' factor was calculated by the following equation:
Z'=1–(3SD++3SD–)/|Ave+–Ave–|, where SD+ is the standard deviation of the positive control, SD– is the standard deviation of the negative control, Ave+ is the mean value of the positive control, and Ave– is the mean value of the negative control.
Results
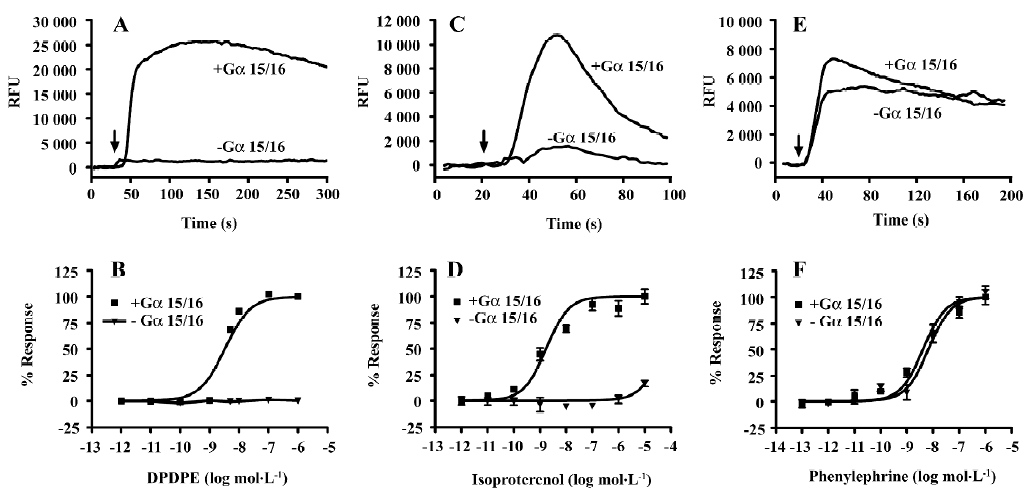
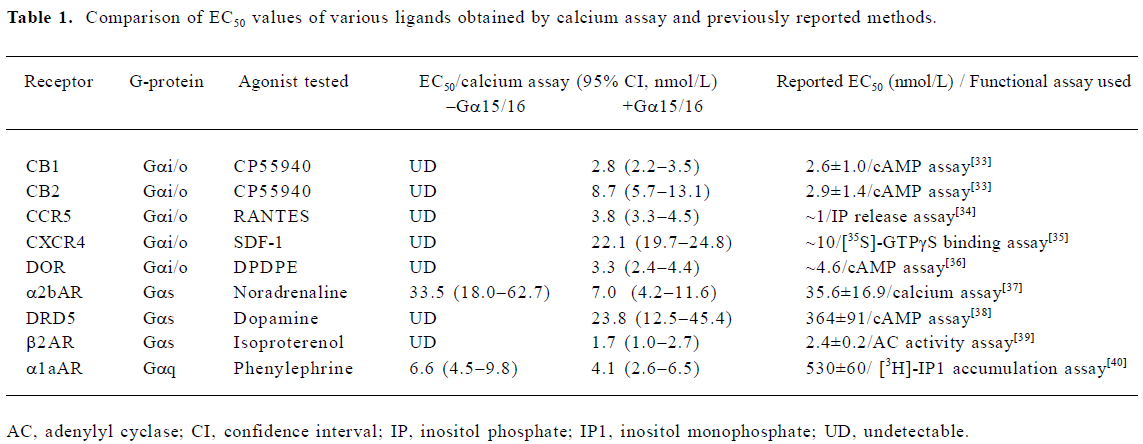
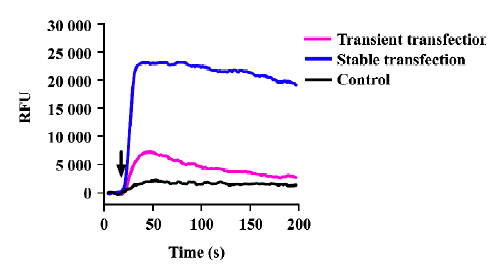
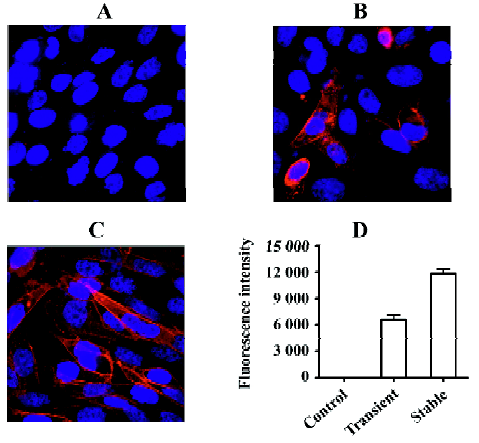
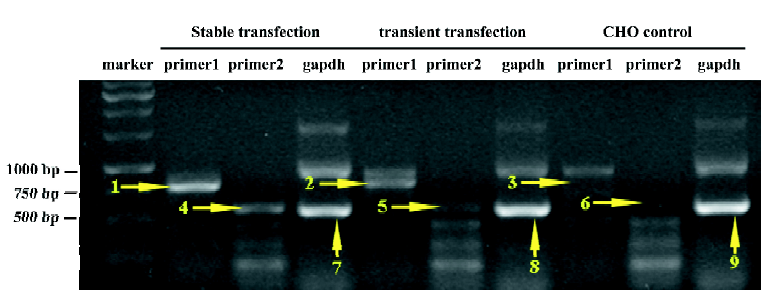
Gα15/16 can couple to various GPCR and mediate calcium response In the present study, we first tested whether promiscuous G-protein Gα15/16 could couple to different types of GPCR and mediate calcium response upon stimulation. Five Gαi/o-coupled (DOR, CB1, CB2, CCR5, and CXCR4), 3 Gαs-coupled (α2bAR, β2AR, and DRD5), and 1 Gαq-coupled (α1aAR) receptors were co-expressed in CHO-K1 or HEK293 cells with Gα15/16, and calcium assay was carried out as described earlier. Representative kinetic and dose-response curves are shown in Figure 1, and the EC50 of various ligands are summarized in Table 1. For most of the Gαi/o- and Gαs-coupled receptors, agonist stimulation caused little or no change in the intracellular calcium concentration, and the calcium assay could not be used to measure the EC50 value of ligands (Figure 1; Table 1). When co-expressed with Gα15/16, all receptors produced a significant calcium-elevating effect after proper stimulation (Figure 1; Table 1). We also found that overexpression of Gα15/16 made little difference in the calcium response generated by Gαq-coupled receptor α1aAR (Figure 1E,1F). One of the receptor α2bAR mainly coupled to Gαs, was also reported to induce calcium response by coupling to plasma membrane calcium channels[23]. Overexpression of Gα15/16 with α2bAR increased the calcium assay’s sensitivity, as indicated in the reduction of EC50 value of noradrenaline (Table 1). For all the receptors tested, the sensitivity of Gα15/16-mediated calcium assay was comparable with or sometimes more sensitive than the traditional cAMP or [35S]-GTPγS assays (Table 1). We also found cells stably transfected with DOR and Gα15/16 gave higher and longer-sustained calcium signals compared to transient transfected cells (supplement Figure 1S). This was likely due to the higher expression level of the receptor and Gα15/16 protein in stably transfected cells (supplement Figure 1S, 2S and Table 1S). For further characterization of this calcium assay, stable cell lines were used.
Full table
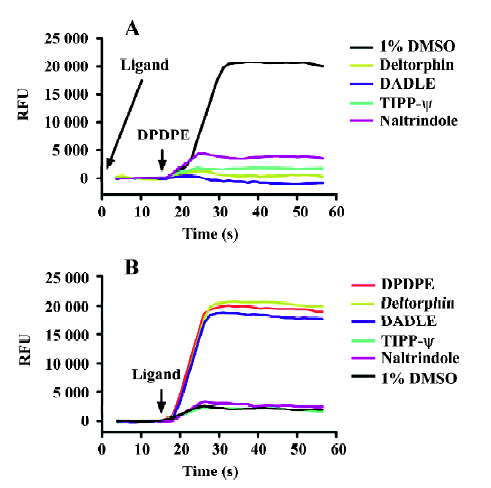
Agonist and antagonist mode of the calcium assay DOR was chosen as a model receptor to test the applicability of this calcium assay (Figure 3S). DOR is a Gαi/o-coupled receptor that plays important roles in various diseases, but lacks straightforward functional HTS assays. We tested a group of known DOR ligands (including 3 agonists: DPDPE, deltorphin II, and DADLE, and 2 antagonists: TIPP-ψ and naltrindole) on cells that stably express DOR and Gα15/16 with 2 different setups. In the antagonist testing mode (Figure 2A), test compounds were pre-incubated with the cells for 15 min; then calcium assay was initiated by the addition of agonist DPDPE. In this setup, antagonists showed blocking effects as anticipated, and agonists also blocked the DPDPE-induced calcium response due to receptor desensitization during the pre-incubation period[24,25]. In the agonist-testing mode (Figure 2A), calcium assay was initiated by the direct addition of test compounds. All agonists showed a robust calcium-elevating effect, and antagonists did not cause any changes. So in the later HTS campaign, all compounds were tested in the antagonist mode in the primary screening to reveal any compounds that might block (antagonist) or desensitize (agonist) the receptor. The agonist mode was used in the secondary screening to distinguish agonists from antagonists.
Full table
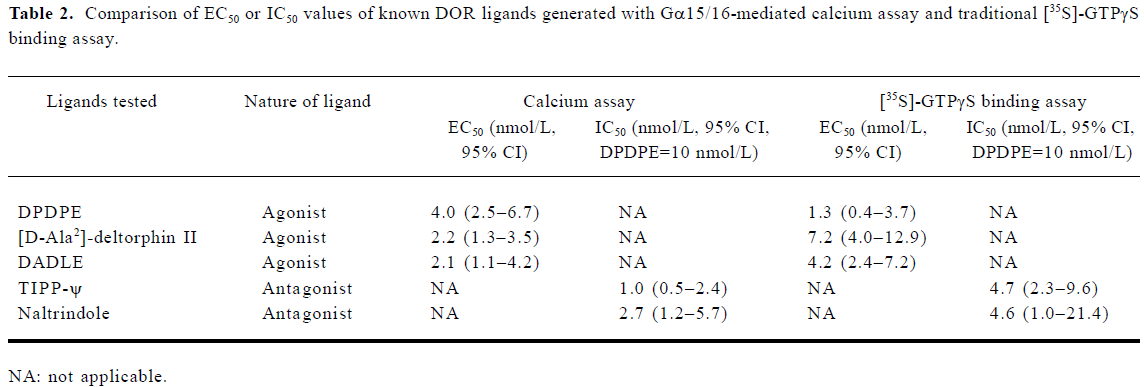
The EC50 values of known agonists were generated with the agonist mode of the calcium assay and the IC50 of known antagonists with the antagonist mode. These values were compared with those obtained with the traditional [35S]-GTPγS binding assay (Table 2), and both assays showed similar sensitivity.
Full table
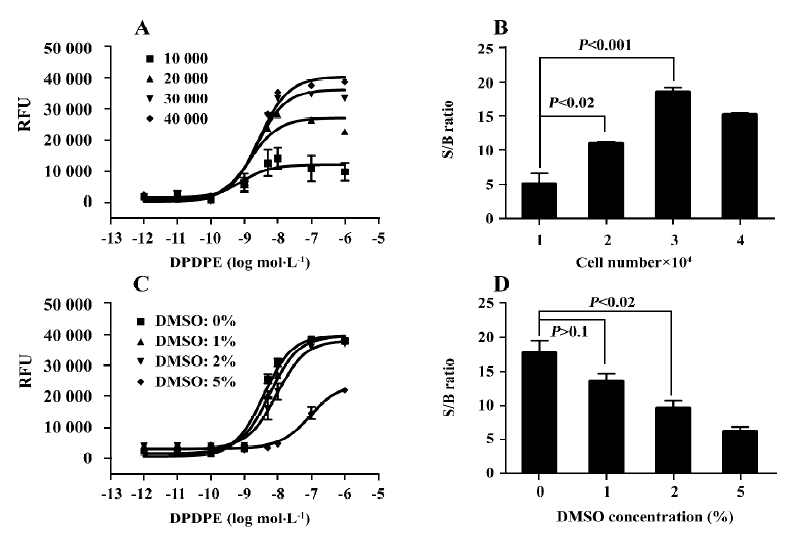
Optimization and performance of the HTS assay Various experimental conditions were tested to optimize the assay for HTS. We found that cell density did not affect the EC50 value of the agonist DPDPE, but the signal to background (S/B) ratio of the calcium response reached a plateau at a cell density of 30 000/well. The solvent used for compounds, DMSO, did not affect the S/B ratio at concentrations up to 1%, and hardly interfered with the dose-response curves at concentrations up to 2% (Figure 3C,3D). The final assay conditions for HTS were determined as follows: the cell density was 30 000/well, the final concentration of DMSO was 1%, and the DPDPE concentration was 10 nmol/L (approximately EC80).
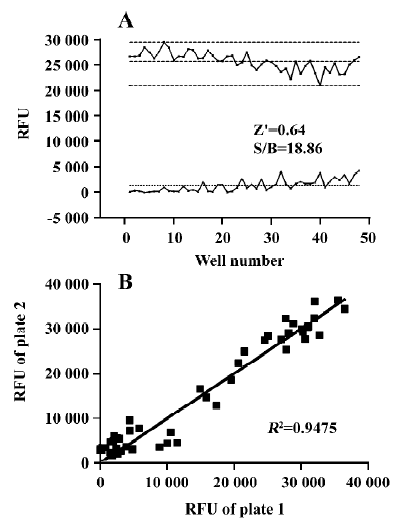
The Z' value is a metric used to assess the robustness of an assay for screening and is the normalized 3 standard deviation window between the negative controls and positive controls[26]. As shown in Figure 4A, the Z' value for the assay was 0.64, and the S/B ratio was 18.86, indicating that the system was adequately optimized for HTS. Furthermore, to investigate reproducibility between duplicate plates, the corresponding wells from 2 different 96-well plates were treated with the same concentration of TIPP-ψ and then 10 nmol/L DPDPE. The data from the corresponding wells of different plates were investigated with liner regression analysis[27]. The correlation coefficient was 0.95, showing a high degree of reproducibility between duplicate sample plates.
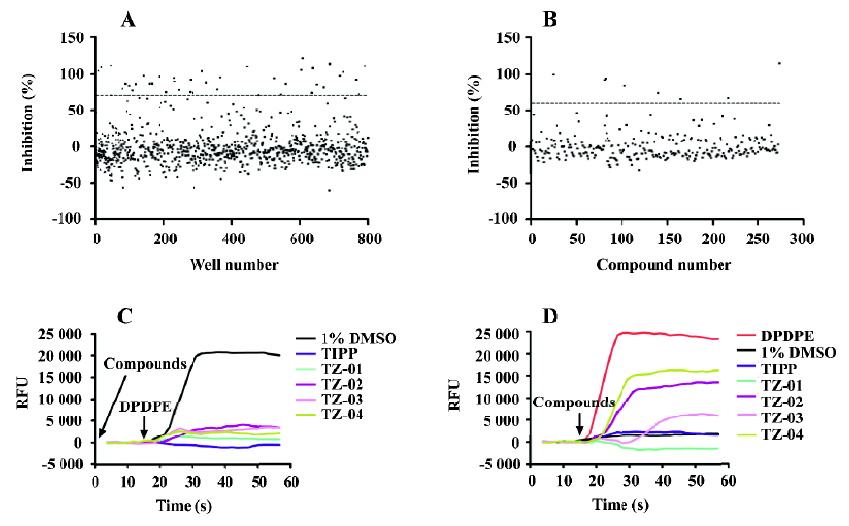
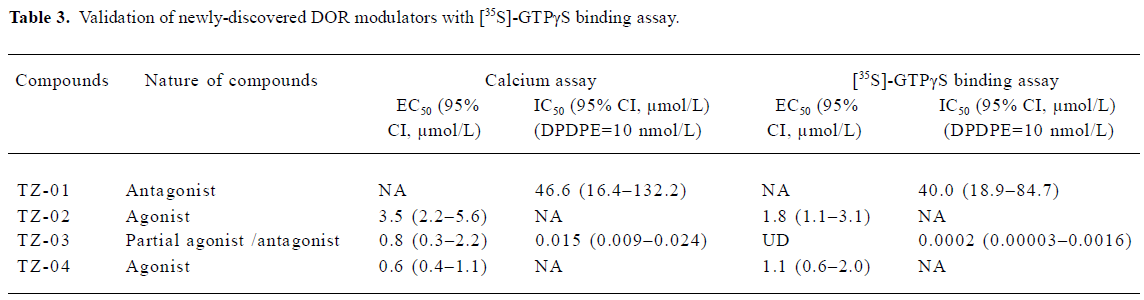
Results of HTS campaign Of the 48 000 compounds initially screened, 273 hits (0.57%) showing greater than 70% inhibition on 10 nmol/L DPDPE-induced calcium response were discovered (Figure 5A). Secondary screening (single compound per well) was done to further confirm the hits (Figure 5B). Finally, 8 compounds displaying consistent inhibitory effects from the secondary screening were picked out and tested on other GPCR (CCR5 and CXCR4; data not shown) for receptor specificity. Four compounds with relatively high receptor specificity for DOR were further tested to distinguish their agonist or antagonist nature (Figure 5C,5D). Three of the compounds (TZ-02, TZ-03, and TZ-04) showed moderate to weak agonist properties, as they were found to induce calcium response in DOR- and Gα15/16 co-expressing cells. One compound TZ-01 showed pure antagonist property. The activities of these compounds were further validated with [35S]-GTPγS binding assay (Table 3). Compounds TZ-02 and TZ-04 were proven to be agonists, and compound TZ-01 was an antagonist. Compound TZ-03 was a partial agonist/antagonist. Its weak agonist activity can only be detected in the sensitive calcium assay, but not in the [35S]-GTPγS binding assay due to a limited assay window. The strong antagonist property of TZ-03 was confirmed by both assays.
Full table
Discussion
Considerable effort has been directed towards the development of HTS platforms for the GPCR because these cell surface receptors represent important drug targets[28]. Detection methods have moved a long way from membrane-based radioligand binding assay towards cell-based functional assays. Most functional assays rely on the detection of the changes of different downstream effectors induced by receptor activation. Due to the versatility of GPCR-induced intracellular changes, it is sometimes difficult to handle and compare results from different assay systems. Meanwhile, with the cloning of more and more orphan GPCR, their implications as potential drug targets require vigorous validation. Little knowledge exists today regarding their native ligands and coupling mechanisms, and this makes HTS assay development extremely difficult. Thus, a universal HTS approach for GPCR ligand screening would be highly valuable.
Calcium mobilization assay with fluorescent dyes is a highly sensitive and easy-to-handle method that has been widely applied to study ligand or voltage-gated ion channels and GPCR coupled to the Gαq-protein[29]. It is critical to provide the receptors with a universal and efficient calcium signal transducer if this method is to be used to search modulators for various GPCR. It has been reported that the Gαq-protein with the last 5 amino acids exchanged with Gαs- or Gαi-proteins (designated as Gqs5 and Gqi5[30]) can couple to GPCR that originally coupled to Gαs or Gαi, and induce calcium mobilization upon stimulation. In the present study, we tested the versatility of another Gαq subfamily protein Gα15/16.
A panel of 9 GPCR that originally coupled to different types of G-proteins was studied. These included 5 Gαi/o-coupled (DOR, CB1, CB2, CCR5, and CXCR4), 3 Gαs-coupled (α2bAR, β2AR, and DRD5) and 1 Gαq-coupled (α1aAR) receptors. With the exception of α1aAR, which originally coupled to Gαq, and α2bAR, which was reported to modulate plasma membrane calcium channels[23], other receptors could not elicit measurable calcium responses upon stimulation when they were expressed alone in CHO-K1 or HEK293 cells. After co-expression with Gα15/16, all receptors were coupled to the calcium mobilization pathway, and the EC50 values of the ligands measured with this assay were in close agreement or more sensitive than other reported methods.
We further characterize the Gα15/16-mediated calcium assay on DOR. DOR has been heavily studied in the past for its roles in pain and drug addiction[31,32]. It has been a focus of attention again recently due to its involvement in neurode-generative and autoimmune diseases[16,18]. Traditional HTS methods for searching DOR ligands include radioligand binding, [35S]-GTPγS binding, and cAMP assay. Both [35S]-GTPγS binding and cAMP assay can only be used to search agonists or antagonists in a single HTS run. Radioligand binding is the only way to find both agonists and antagonists simultaneously, even though the separation of agonists from antagonists needs a secondary functional assay. We found the calcium assay to be very efficient in detecting both agonists and antagonists if the testing compounds were pre-incubated with the cells before the addition of agonist DPDPE. In this experimental setup, agonists can also block the DPDPE-induced calcium response due to receptor desensitization during the pre-incubation period. Thus, any compounds that reduce the DPDPE-elicited calcium signal could be a potential DOR modulator. Later on, the agonist or antagonist nature of the compound can be simply distinguished by direct application of the compound to the cells to see whether it can induce calcium change or not.
Various assay parameters were optimized to improve the assay window and stability. The Z' factor is a useful tool for evaluating bioassay qualities[26]. In general, a Z' value above 0.5 suggests that an assay is robust enough for HTS. The calcium mobilization system described herein displayed a Z' value of 0.64, which indicated that the assay was of a high-quality nature. This assay was applied to a large-scale screening of a compound library consisting of 48 000 synthetic compounds. Four compounds with novel structures and relatively high receptor specificity were sorted out and further validated with a traditional [35S]-GTPγS binding assay. Two of these compounds were found to be agonists and 1 to be antagonist. The other was a partial agonist/antagonist that displayed very weak agonist, but strong antagonist activity.
In summary, a universal, cell-based, Gα15/16-mediated calcium assay was developed and validated for the identification of compounds that modulate DOR activity. Its application may be expanded to other GPCR and even orphan receptors.
References
- George SR, O’Dowd BF, Lee SP. G-protein-coupled receptor oligomerization and its potential for drug discovery. Nat Rev Drug Discov 2002;1:808-20.
- Marchese A, George SR, Kolakowski LF Jr, Lynch KR, O’Dowd BF. Novel GPCRs and their endogenous ligands: expanding the boundaries of physiology and pharmacology. Trends Pharmacol Sci 1999;20:370-5.
- Drews J. Drug discovery: a historical perspective. Science 2000;287:1960-4.
- Ma P, Zemmel R. Value of novelty? Nat Rev Drug Discov 2002;1:571-2.
- Schoneberg T, Hofreiter M, Schulz A, Rompler H. Learning from the past: evolution of GPCR functions. Trends Pharmacol Sci 2007;28:117-21.
- Pierce KL, Premont RT, Lefkowitz RJ. Seven-transmembrane receptors. Nat Rev Mol Cell Biol 2002;3:639-50.
- Hamm HE. The many faces of G protein signaling. J Biol Chem 1998;273:669-72.
- Bartfai TJLB, Bockaert J, Bond RA, Bouvier M, Christopoulos A, et al. Twenty questions. Nat Rev Drug Discov 2004;3:577-626.
- Umemori H, Inoue T, Kume S, Sekiyama N, Nagao M, Itoh H, et al. Activation of the G protein Gq/11 through tyrosine phosphorylation of the alpha subunit. Science 1997;276:1878-81.
- Berridge MJ. Inositol trisphosphate and calcium signalling. Nature 1993;361:315-25.
- Yuan J, Rey O, Rozengurt E. Activation of protein kinase D3 by signaling through Rac and the alpha subunits of the heterotrimeric G proteins G12 and G13. Cell Signal 2006;18:1051-62.
- Wise A, Jupe SC, Rees S. The identification of ligands at orphan G-protein coupled receptors. Annu Rev Pharmacol Toxicol 2004;44:43-66.
- Cabrera-Vera TM, Vanhauwe J, Thomas TO, Medkova M, Preininger A, Mazzoni MR, Hamm HE. Insights into G protein structure, function, and regulation. Endocr Rev 2003;24:765-81.
- Coward P, Chan SD, Wada HG, Humphries GM, Conklin BR. Chimeric G proteins allow a high-throughput signaling assay of Gi-coupled receptors. Anal Biochem 1999;270:242-8.
- Gu JL, Lu W, Xia C, Wu X, Liu M. Regulation of hematopoietic-specific G-protein Galpha15 and Galpha16 by protein kinase C. J Cell Biochem 2003;88:1101-11.
- Shi Y, Feng Y, Kang J, Liu C, Li Z, Li D, et al. Critical regulation of CD4+ T cell survival and autoimmunity by beta-arrestin 1. Nat Immunol 2007;8:817-24.
- Raut A, Rao VR, Ratka A. Changes in opioid receptor proteins during mitochondrial impairment in differentiated SK-N-SH cells. Neurosci Lett 2007;422:187-92.
- Ni Y, Zhao X, Bao G, Zou L, Teng L, Wang Z, et al. Activation of beta2-adrenergic receptor stimulates gamma-secretase activity and accelerates amyloid plaque formation. Nat Med 2006;12:1390-6.
- Hipkin RW, Friedman J, Clark RB, Eppler CM, Schonbrunn A. Agonist-induced desensitization, internalization, and phosphorylation of the sst2A somatostatin receptor. J Biol Chem 1997;272:13869-76.
- Bradford MM. A rapid and sensitive method for the quantitation of microgram quantities of protein utilizing the principle of protein-dye binding. Anal Biochem 1976;72:248-54.
- Gonsiorek W, Zavodny P, Hipkin RW. The study of CXCR3 and CCR7 pharmacology using [35S]GTPgammaS exchange assays in cell membranes and permeabilized peripheral blood lymphocytes. J Immunol Methods 2003;273:15-27.
- Hann M, Hudson B, Lewell X, Lifely R, Miller L, Ramsden N. Strategic pooling of compounds for high-throughput screening. J Chem Inf Comput Sci 1999;39:897-902.
- Davare MA, Avdonin V, Hall DD, Peden EM, Burette A, Weinberg RJ, et al. A beta2 adrenergic receptor signaling complex assembled with the Ca2+ channel Cav1.2. Science 2001;293:98-101.
- Borgland SL. Acute opioid receptor desensitization and tolerance: is there a link? Clin Exp Pharmacol Physiol 2001;28:147-54.
- Law PY, Loh HH. Regulation of opioid receptor activities. J Pharmacol Exp Ther 1999;289:607-24.
- Zhang JH, Chung TD, Oldenburg KR. A simple statistical parameter for use in evaluation and validation of high throughput screening assays. J Biomol Screen 1999;4:67-73.
- Ghosh RN, DeBiasio R, Hudson CC, Ramer ER, Cowan CL, Oakley RH. Quantitative cell-based high-content screening for vasopressin receptor agonists using transfluor technology. J Biomol Screen 2005;10:476-84.
- Liu AM, Ho MK, Wong CS, Chan JH, Pau AH, Wong YH. Galpha(16/z) chimeras efficiently link a wide range of G protein-coupled receptors to calcium mobilization. J Biomol Screen 2003;8:39-49.
- Takahashi A, Camacho P, Lechleiter JD, Herman B. Measurement of intracellular calcium. Physiol Rev 1999;79:1089-125.
- An S, Bleu T, Zheng Y. Transduction of intracellular calcium signals through G protein-mediated activation of phospholipase C by recombinant sphingosine 1-phosphate receptors. Mol Pharmacol 1999;55:787-94.
- Kest B, Lee CE, McLemore GL, Inturrisi CE. An antisense oligodeoxynucleotide to the delta opioid receptor (DOR-1) inhibits morphine tolerance and acute dependence in mice. Brain Res Bull 1996;39:185-8.
- Quock RM, Burkey TH, Varga E, Hosohata Y, Hosohata K, Cowell SM, et al. The delta-opioid receptor: molecular pharmacology, signal transduction, and the determination of drug efficacy. Pharmacol Rev 1999;51:503-32.
- Ross RA, Brockie HC, Stevenson LA, Murphy VL, Templeton F, Makriyannis A, et al. Agonist-inverse agonist characterization at CB1 and CB2 cannabinoid receptors of L759633, L759656, and AM630. Br J Pharmacol 1999;126:665-72.
- Raport CJ, Gosling J, Schweickart VL, Gray PW, Charo IF. Molecular cloning and functional characterization of a novel human CC chemokine receptor (CCR5) for RANTES, MIP-1beta, and MIP-1alpha. J Biol Chem 1996;271:17161-6.
- Fricker SP, Anastassov V, Cox J, Darkes MC, Grujic O, Idzan SR, et al. Characterization of the molecular pharmacology of AMD3100: a specific antagonist of the G-protein coupled chemokine receptor, CXCR4. Biochem Pharmacol 2006;72:588-96.
- Cai YC, Ma L, Fan GH, Zhao J, Jiang LZ, Pei G. Activation of N-methyl-D-aspartate receptor attenuates acute responsiveness of delta-opioid receptors. Mol Pharmacol 1997;51:583-7.
- Holmberg CI, Kukkonen JP, Bischoff A, Nasman J, Courtney MJ, Michel MC, et al. Alpha2B-adrenoceptors couple to Ca2+ increase in both endogenous and recombinant expression systems. Eur J Pharmacol 1998;363:65-74.
- Demchyshyn LL, McConkey F, Niznik HB. Dopamine D5 receptor agonist high affinity and constitutive activity profile conferred by carboxyl-terminal tail sequence. J Biol Chem 2000;275:23446-55.
- Cunliffe JM, Sunahara RK, Kennedy RT. Detection of G protein coupled receptor mediated adenylyl cyclase activity by capillary electrophoresis using fluorescently labeled ATP. Anal Chem 2007;79:7534-9.
- Arias-Montano JA, Berger VA, Soria-Jasso LE, Young JM. Characterisation of alpha1B-adrenoceptors linked to inositol phosphate formation and calcium mobilisation in human astrocytoma U373 MG cells. Naunyn Schmiedebergs Arch Pharmacol 1999;360:533-9.