
LY294002 induces p53-dependent apoptosis of SGC7901 gastric cancer cells1
Introduction
Cancers of the gastrointestinal tract account for 22% of all cancers and represent a major health threat worldwide[1]. Gastric cancer is the fourth most frequently diagnosed malignancy worldwide, accounting for 12% of all cancer-related deaths[2,3]. In Asia and parts of South America in particular, gastric cancer is the most common epithelial malignancy and a leading cause of cancer-related death.
The phosphatidylinositol 3-kinase (PI3K) pathway plays a central role in the regulation of cell proliferation, growth, differentiation, and survival[4,5]. Dysregulation of this pathway is frequently observed in a variety of tumors, including brain tumors and breast, ovarian and other carcinomas[6–8]. Therefore, inhibition of PI3K signaling is under investigation as a potentially useful approach for cancer treatment.
The PI3K family of enzymes is well characterized with respect to the promotion of cellular growth, survival, and suppression of apoptosis in cancer cells[9–11]. These kinases can be activated by cell surface growth factor receptors (such as epidermal growth factor receptor) and are known to play a critical role in regulating the balance between cell survival and apoptosis. PI3K enzymes are cytosolic and consist of both regulatory and catalytic subunits, which regulate a vast array of fundamental cellular responses[12]. Members of the PI3K family can be divided into three classes: class I, II and III. Class I PI3K members are heterodimers, each consisting of a p110 catalytic subunit and a smaller regulatory subunit with Src-homology 2 (SH2) domains. Mammals have three catalytic subunits (p110α, p110β, p110γ) and five regulatory subunits (p85α, p85β, p55γ, p55α, p50α)[13,14]. One of the functions of class I PI3K is to inhibit apoptosis. Much evidence has implicated PI3K in cancer. Mutations in the 3-phosphoinositide phosphatase PTEN[15] as well as over-expression of the p110 catalytic subunits of the p85/p110 (class IA) PI3K[16] are frequently found in human tumors. The overexpressed p110 subunits are presumably active by virtue of the excess free p85 that exists in many cell types[17].
The AKT protein kinase transduces signals from growth factors and oncogenes to downstream targets that control crucial elements in tumor development. The AKT pathway is one of the most frequently hyperactivated signaling pathways in human cancers[18]. AKT is activated by PI3K, which transmits signals from cytokines, growth factors, and oncoproteins (eg RAS) to multiple targets, including AKT. Activation of PI3K localizes AKT to the plasma membrane via the pleckstrin homology domain of AKT, where AKT is activated by phosphorylation at Ser473[19]. p53 acts as a tumor suppressor primarily by inducing either cell cycle arrest or apoptosis in response to cellular stress, leading to oncogenic alteration[20,21]. These cellular responses are mediated largely through the function of p53 as a transcriptional activator or repressor, targeting a diverse range of genes.
LY294002 is a specific inhibitor of class I PI3K[22]. In the present study we examined whether inhibition of class I PI3K by LY294002 has cytotoxic effects in SGC7901 gastric cancer cells, and how this affects the p53-mediated apoptotic signaling pathway.
Materials and methods
Reagents RPMI-1640 medium was purchased from Gibco (Rockville, MD, USA). Fetal bovine serum was purchased from Hangzhou Sijiqing Biological Engineering Material Co (Hangzhou, China), L-glutamine and 3-(4,5-dimethyl-2 thiazoyl)-2,5-diphenyl-2H-tetrazolium bromide (MTT) were purchased from Sigma (St Louis, MO, USA). Antibodies against p53 (1:500, 1C12), p85 (1:500, 19H8), p-AKT (1:500, Ser473) and PUMA (1:500, P-13) were purchased from Cell Signaling Technology (Beverly, MA, USA). Primers, the RNAiso reagent kit, the Primescript RT reagent kit and the SYBR Premix EX Taq kit were purchased from TaKaRa (Dalian, China).
Drug preparation LY294002 and Pft-α (Cell Signaling Technology) were diluted in DMSO to create a stock solution that was stored according to the manufacturer’s instructions. Adriamycin (ADM) was diluted in RPMI-1640 to create a stock solution that was stored according to the manufacturer’s instructions. The final concentration of the LY294002 solution used was 50 µmol/L, ADM was 0.04 µg/mL and that of the Pft-α solution was 30 µmol/L. This concentration of LY294002 was selected on the basis of our experiments on SGC7901 cells, the concentration of ADM and the concentration of Pft-α was selected on the basis of the manufacturer’s recommendations.
Cell culture SGC7901 cells and SMMC7721 cells were maintained in RPMI-1640 medium (Gibco) containing 10% heat-inactivated fetal bovine serum (Hangzhou Sijiqing Biological Engineering Material Co), 0.03% L-glutamine (Sigma) and incubated in a 5% CO2 atmosphere at 37 °C. Cells in the mid-log phase were used in the experiments.
Cell viability assay Cell viability was assessed using an MTT assay. To determine the time-course of the effects of LY294002, SGC7901 cells and SMMC7721 cells were plated onto 96-well microplates (7×10⁴ cells/well). LY294002 (12. 5, 25, 50 µmol/L) was added to the culture medium and cell viability was assessed using an MTT assay 24, 48 and 72 h after drug treatment. To determine the synergistic effect of LY294002 and ADM on growth in combination with ADM, SGC7901 cells were plated onto 96-well microplates (7×10⁴ cells/well). LY294002 (50 µmol/L) and ADM (0.04 µg/mL) were added to the culture medium and cell viability was assessed using an MTT assay 24, 48 and 72 h after drug treatment. To determine if p53 plays a critical role in LY294002-induced cytotoxicity, SGC7901 cells were pretreated with the p53-specific inhibitor Pft-α for 6 h before the addition of LY294002 and cell viability was assessed using an MTT assay 24, 48 and 72 h after drug treatment. The MTT solution was added to the culture medium (500 µg/mL final concentration) 4 h before the end of treatment and the reaction was stopped by addition of 100 µL 10% acidic SDS. The absorbance value (A) at 570 nm was read using an automatic multi-well spectrophotometer (Bio-Rad, Richmond, CA, USA). The percentage cell death was calculated as follows: cell death (%) = (1–A of experimental well/A of positive control well)×100%.
Detection of cell cycle To analyze the effect of LY294002 on cell cycle progression, we incubated SGC7901 cells with LY294002 (50 µmol/L) for 12 or 24 h. The cells were harvested using 0.25% trypsin, washed with phosphate-buffered saline (PBS), counted and adjusted to 1×10⁶ cells/mL. The cells were fixed in 70% ethanol, treated with 100 mg/L RNase at 37 °C for 30 min and stained with 50 mg/L propidium iodide (Sigma) for 30 min. The cells were analyzed using flow cytometry (Epics XL; Beckman Coulter, Fullerton CA, USA). Percentage apoptotic cells was taken as the percentage of cells with a DNA content lower than that of cells in G0–G1 in the propidium iodide intensity-area histogram plot[23]. These hypodiploid cells were considered to represent apoptotic cells, and the rate of apoptosis was analyzed using Multicycle software (Beckman Coulter).
Detection of mitochondrial potential (Δψ) Mitochondrial Δψ was determined using the KeyGEN Mitochondrial Membrane Sensor Kit (KeyGEN, Nanjing, China). The Mitosensor dye aggregates in the mitochondria of healthy cells and emits red fluorescence against a green monomeric cytoplasmic background staining. However, in cells with a collapsed mitochondrial Δψ, the dye cannot accumulate in the mitochondria and remains in monomeric form throughout the cells with green fluorescence[24]. Briefly, SGC7901 cells were incubated with LY294002 in 24-well plates for the indicated times and then pelleted, washed with PBS, and resuspended in 0.5 mL of diluted Mitosensor reagent (1 µmol/mL in incubation buffer). After the cells were incubated with the Mitosensor reagent for 20 min, 0.2 mL of incubation buffer was added and cells were centrifuged then resuspended in 40 µL of incubation buffer. Finally, the cells were washed and resuspended in 1 mL PBS for flow cytometry analysis.
Real-time quantitative RT-PCR analysis of p53 and PUMA Total RNA was extracted using the RNAiso kit (TaKaRa). For extracting total mRNA, SGC7901 cells were treated with LY294002 (50 µmol/L) for 6 h before being harvested. To detect whether the inhibitor of p53 inhibits the expression of p53 and PUMA, SGC7901 cells were pretreated with Pft-α 6 h before incubation with LY294002. First-strand cDNA was generated via reverse transcription of 2 µg of total RNA using random primers and the Primescript RT Reagent Kit (TaKaRa) in a total reaction volume of 20 µL according to the manufacturer’s instructions. The sequences of the forward and reverse oligonucleotide primers, specific to the chosen candidate and housekeeping genes, were designed using Primer5 software (available from frodo. wi. mit. edu/cgi-bin/primer5/primer5_www. cgi). For p53 the primers were: forward, 5'-ACTAAGCGAGCACTGCCCAAC-3'; reverse, 5'-CCTCATTCAGCTCTCGGAACATC-3' (GenBank NM_000546; nucleotides 1161–1290. For PUMA the primers were: forward, 5'- CGACCTCAACGCACAGTACGA-3'; reverse, 5’-GGCACCTAATTGGGCTCCATC-3' (GenBank NM_014417; nucleotides 719–868). For β-actin the primers were: forward, 5'-ATTGCCGACAGGATGCAGA-3'; reverse, 5'-GAGTACTTGCGCTCAGGAGGA-3' (GenBank NM_001101; nucleotides 998–1086). Real-time quantitative RT-PCR was performed using the iCycler 5 thermal cycler (BioRad, Hercules, CA, USA). An 80-fold dilution of each cDNA was amplified in a 20 µL volume, using the SYBR Premix EX Taq kit (TaKaRa), with a 500 nmol/L final concentration of each primer. The amplification specificity was checked using melting curve analysis. Threshold cycle Ct, which correlates inversely with the target mRNA level, was calculated using the second derivative maximum algorithm provided by the Light-Cycler software. For each cDNA, all target gene mRNA levels were normalized to β-actin mRNA levels. Results are expressed as the ratio of normalized target gene mRNA levels in treated cells relative to those in untreated cells.
Western blotting analysis Cells were harvested and rinsed twice with ice-cold PBS. Five volumes of Western blot lysing buffer [containing 10 mmol/L Tris-HCl (pH 7.4), 150 mmol/L NaCl, 1% Triton X-100, 1% sodium deoxycholate, 0.1% sodium dodecyl sulfate, 5 mmol/L EDTA, 1 mmol/L phenylme-thylsulphonyl fluoride (PMSF), 0.28 U/mL aprotinin, 50 µg/mL leupeptin, 1 mmol/L benzamidine, and 7 µg/mL pepstatin A] was added to each volume of cell pellets and the mixture was sonicated on ice (1 s/mL per sonication, with 30 s intervals, 5 times). The mixture was microcentrifuged at 10 600×g at 4 °C for 10 min and the supernatant was preserved at –70 °C for later use. The protein concentration was determined using the BCA kit (Pierce, Rockford, IL, USA). Proteins were separated on a 12% SDS-PAGE gel, transferred to a nitrocellulose membrane and immunoblotted with a 1:500 dilution of primary antibody (Cell Signaling Technology) at 4 °C overnight. Immunoreactivity was detected using horseradish peroxidase (HRP)-conjugated anti- rabbit antibody (Sigma) at a dilution of 1:5000 in blocking solution for 1 h at room temperature. Immunoreactivity was detected using enhanced chemiluminescence (ECL kit; Amersham Pharmacia Biotech, Rockford, IL, USA) and visualized by autoradiography. β-actin protein (1:5000; Sigma) was used as a loading control.
Statistical analysis All data are presented as mean±SD. Statistical analysis was carried out using ANOVA followed by Dunnett’s t-test, with P<0.05 taken to indicate significance.
Results
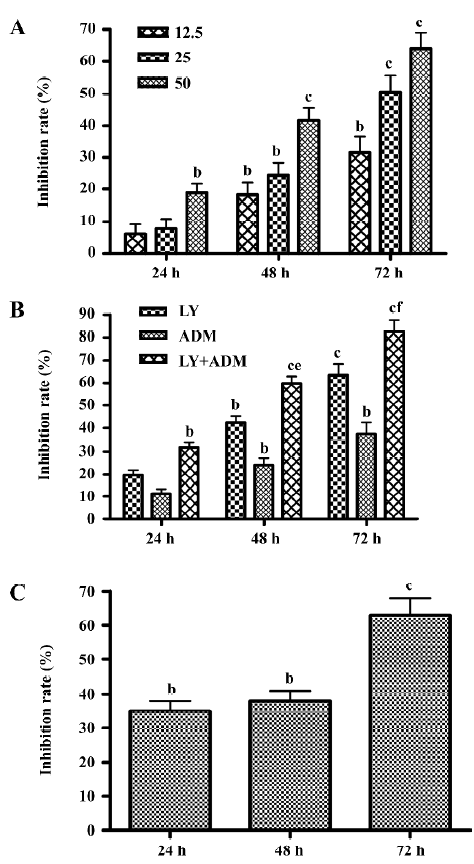
LY294002 reduced cell viability LY294002 reduced SGC7901 viability in a dose- and time-dependent fashion. MTT assays revealed that after 24 h of treatment, the rate of inhibition reached 20.71% ± 4.13% at the highest dose used, 50 µmol/L. The rate of inhibition rose when the incubation time was prolonged, reaching 41.54%± 2.06% at 48 h and 64.09%±1.5% at 72 h after treatment (Figure 1A). In order to assess the clinical value of the PI3K inhibitor in tumor treatment, and to test the synergistic inhibitory effect of the PI3K inhibitor on growth in combination with a chemotherapy drug, we used the chemotherapy drug ADM (0.04 µg/mL). We found that LY294002 has a more marked effect when used in combination with ADM than when used alone (Figure 1B). As shown in Figure 1C, LY294002 also inhibited the proliferation of SMMC7721 liver cancer cells: MTT assays revealed that after 24, 48 and 72 h of treatment, the rates of inhibition were 33.4%±2.23%, 39.82%±3.14% and 55.7%±2.41% at the highest dose used, 50 µmol/L. Thus, LY294002 inhibited the proliferation of SGC7901 gastric cancer and SMMC7721 liver cancer cells.
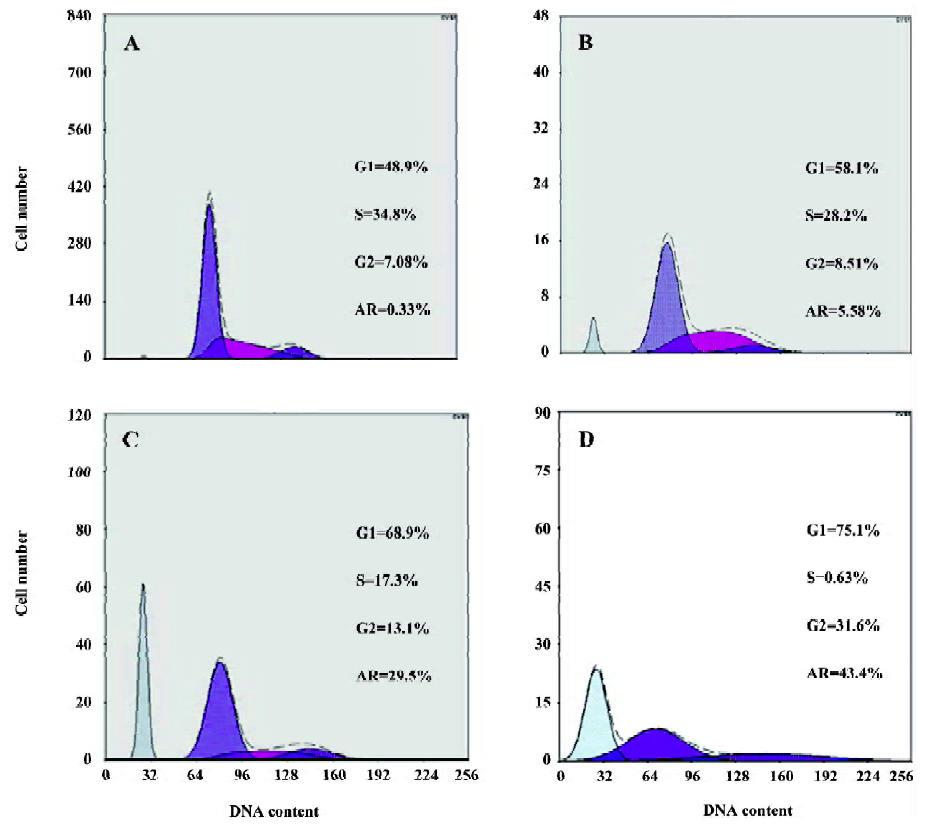
LY294002 arrested the cell cycle and induced apoptosis of SGC7901 cells The effect of LY294002 on the cell cycle progression of SGC7901 cells was studied after 12 and 24 h of LY294002 (50 µmol/L) exposure. Flow cytometry analysis indicated that LY294002 halted the cell cycle of SGC7901 cells at the G1 and G2 phases after both 12 and 24 h treatment. The proportion of cells in the G1 phase increased with the duration of LY294002 (50 µmol/L) exposure (0, 6, 12, or 24 h), being 48.9%, 58.1%, 68.9% and 75.1%. The proportion of cells in the G2 phase also increased with the duration of exposure, being 7.08%, 8.51%, 13.1% and 31.6%, respectively. In contrast, the proportions of cells in the S phase decreased with exposure, being 34.8%, 28.2%, 17.3% and 0.63%, respectively; but the apoptosis rate increased with exposure, being 0.33%, 5.58%, 29.5% and 43. 4%, respectively (Figure 2 and Table 1). There was a significant difference between the 50 µmol/L LY294002 group and the control group at every time point. The results indicate that LY294002 induces cell cycle arrest and apoptosis of SGC7901 cells.
Full table
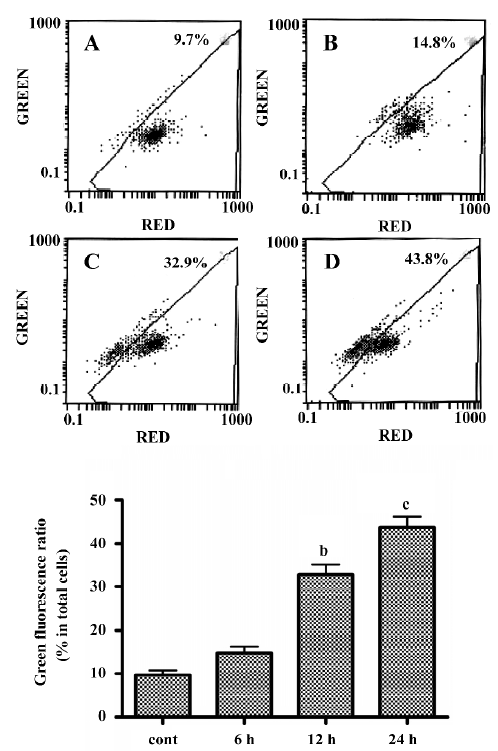
LY294002 induced mitochondrial dysfunction In the present study, mitochondrial membrane potential was examined using the fluorescent dye JC-1. We detected a collapse in mitochondrial membrane potential (Δψ) as early as 6 h after LY294002 treatment, as indicated by increased emission of green fluorescence. This change reached a maximum 24 h after LY294002 treatment (Figure 3). A collapse in mitochondrial membrane potential always indicates cell apoptosis or necrosis, LY294002 induced mitochondrial dysfunction and activated cell apoptosis in SGC7901 cells, and the results described here prove that LY294002 induced apoptosis in SGC7901 cells.
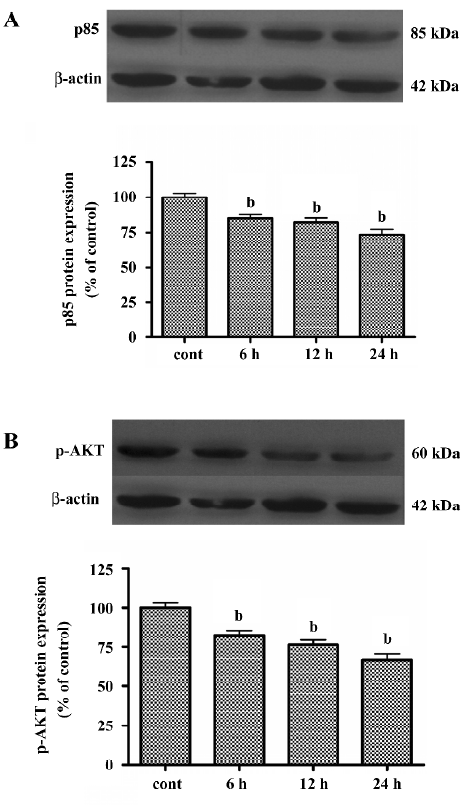
LY294002 decreased expression of p85 and p-AKT To distinguish the specific class I PI3K/AKT-mediated cell proliferation blockage from nonspecific LY294002 toxicity, we measured the phosphorylation of one of the downstream targets of PI3K, p-AKT(Ser473), and the expression of p85 after treatment with LY294002 (50 µmol/L) for durations ranging from 6 to 24 h. As shown in Figure 4A expression of p85 in the SGC7901 cell line was inhibited by LY294002 treatment. As shown in Figure 4B, phosphorylation of AKT at Ser473 in the SGC7901 cell line was inhibited in a time-dependent manner. These results suggest that LY294002 may induce tumor cell apoptosis by regulating p-AKT and p85. They also suggest that AKT and p85 have a role in regulating apoptosis and proliferation.
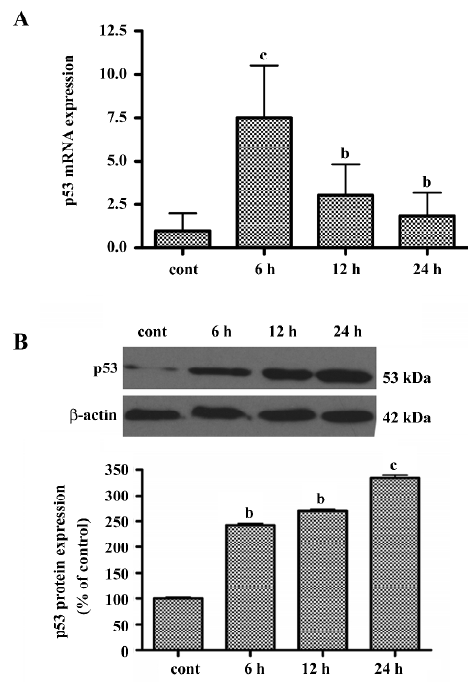
LY294002 upregulated p53 levels To determine whether LY294002-induced apoptosis involves the p53 signaling pathway, real-time quantitative RT-PCR analysis was used to measure p53 mRNA expression. The basal levels of p53 mRNA in SGC7901 cells were relatively low. Six hours after incubation with LY294002, p53 mRNA expression was significantly increased (Figure 5A). The level of p53 mRNA reached a peak at 6 h, but gradually decreased thereafter, although remaining higher than the level of the control. To determine whether LY294002 also increases the expression of p53 protein, Western blot analysis was used. The level of p53 protein increased between 6 and 24 h after LY294002 treatment (50 µmol/L). These results showed that p53 expression was induced by LY294002 treatment (Figure 5B). P53 mRNA and protein began to increase at the same time after treatment, but expression of p53 mRNA peaked at 6 h and expression of p53 protein peaked at 24 h after treatment.
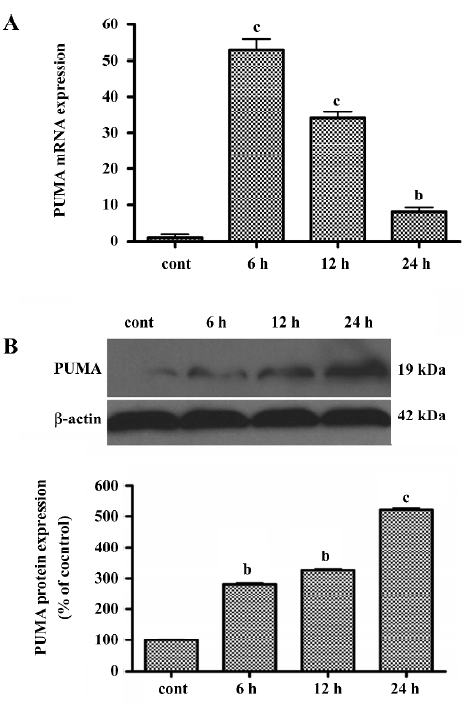
LY294002 upregulated PUMA levels To determine whether LY294002 also increases the expression of the p53 target gene PUMA, real-time quantitative RT-PCR analysis was used to measure PUMA mRNA expression and Western blot analysis was used to measure PUMA protein expression. The level of PUMA mRNA peaked at 6 h after treatment, but gradually decreased thereafter, although remaining higher than the level of the control. These results showed that PUMA expression was induced by LY294002 treatment (Figure 6A). To determine whether LY294002 also increases the expression of PUMA protein, Western blot analysis was used. The PUMA protein level increased between 6 and 24 h after LY294002 treatment (50 µmol/L). These results show that PUMA protein expression was induced by LY294002 treatment (Figure 6B). PUMA mRNA and protein began to increase at the same time after treatment, but expression of PUMA mRNA peaked at 6 h and expression of PUMA protein peaked at 24 h after treatment.
Pft-α inhibited LY294002-induced apoptosis Pft-α was originally thought to be a specific inhibitor of signaling by the tumor suppressor protein p53[25]. To confirm the contribution of p53 to the regulation of proliferation and apoptosis involved in LY294002-induced SGC7901 cell death, cells were pretreated with the p53-specific inhibitor Pft-α for 6 h before the addition of LY294002. As shown in Figure 7A, Pft-α significantly attenuated the inhibitory effects of LY294002 in a time-dependent manner.
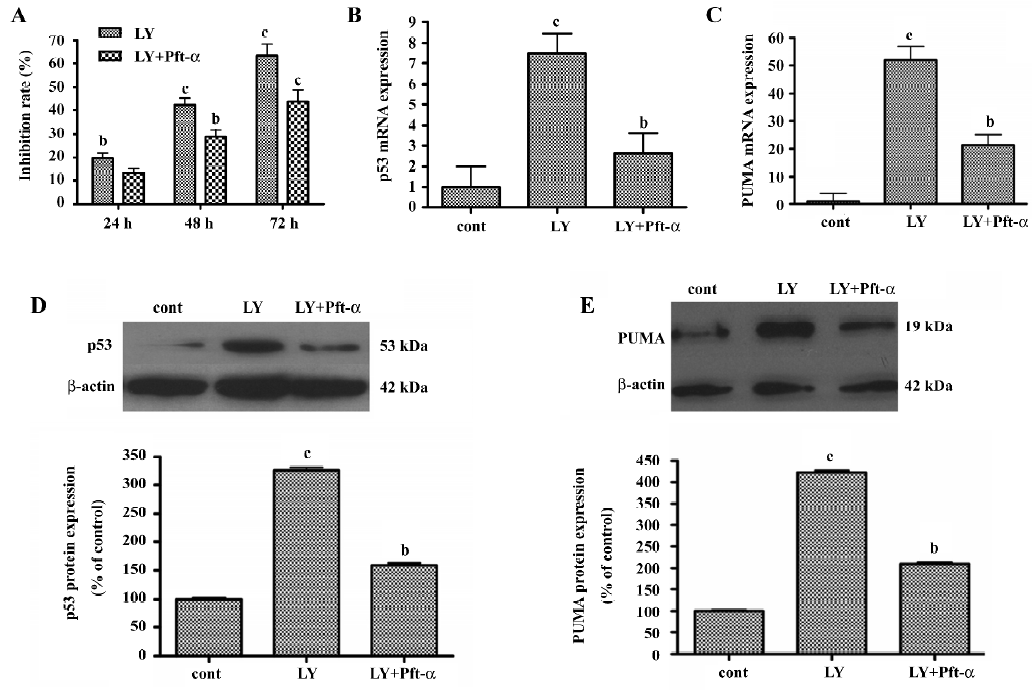
Pft-α inhibited LY294002-induced expression of p53 and PUMA mRNA and protein SGC7901 cells were pretreated with Pft-α 6 h before incubation with LY294002. For extracting total mRNA, SGC7901 cells were treated with LY294002 (50 µmol/L) for 6 h before being harvested. For extracting total protein, SGC7901 cells were treated with LY294002 (50 µmol/L) for 24 h before being harvested. Expression of p53 mRNA and protein was inhibited and expression of PUMA mRNA and protein was blunted by Pft-α treatment (Figure 7B, 7C, 7D, 7E).
Discussion
In the present study, we showed that the class I PI3K inhibitor LY294002 reduced the viability of and induced apoptosis in SGC7901 gastric cancer cells, thus demonstrating the cytotoxic effects of LY294002. We also showed that LY294002 increased the expression of p53 and PUMA, while decreasing the expression of p-AKT and p85. LY294002-induced apoptosis was blocked by the p53 inhibitor Pft-α. These results show that LY294002 may induce cytotoxicity in SGC7901 cells via activation of p53-mediated apoptotic signaling. These findings suggest that inhibition of the class I PI3K signaling pathway is a potential strategy for managing gastric cancers.
The lipid kinase PI3K is a proto-oncogene that generates 3'-phosphoinositides at the cell membrane. The best-characterized inhibitors of PI3K are LY294002 and wortmannin, which are commercially used compounds that target the p85 regulatory subunit of PI3K. LY294002 effectively inhibits the growth of many types of tumor cells in vitro and in vivo, which occurs via the inhibition of PI3K and downstream components of the pathway[26–38].
In the dose range used in the present study, LY294002 inhibited the expression of p85, a regulatory subunit of PI3K. LY294002 also inhibited the phosphorylation of p-AKT (ie activation of AKT). Thus LY294002 probably inhibits proliferation and induces apoptosis in SGC7901 cells by inhibiting class I PI3K. However, the downstream molecules involved in the apoptotic death of tumor cells following inhibition of PI3K/AKT by LY294002 remain to be identified.
The mitochondria play critical roles in integrating cell death signals. Apoptosis is a cellular process involving the selective degradation of membranous organelles such as the mitochondria. The mitochondrial permeability transition (MPT) represents an important event in initiating apoptosis. Thus, it is not surprising that apoptosis and even necrosis share a common mechanism through induction of the MPT. Observations made in the present study suggest that the mitochondrial Δψ collapsed after treatment of LY294002, thus mitochondria may have initiated an apoptotic pathway.
The tumor suppressor p53 plays a central role in sensing various genotoxic stresses. The basal levels of p53 were low in SGC7901 gastric cancer cells, and LY294002 upregulated the expression of p53. Upregulation of p53 after treatment with LY294002 induced apoptotic cell death. Moll and Zaika have proposed that the induction of apoptotic cell death by p53 occurs via both target gene activation and transactivation-independent mechanisms at mitochondria[29]. In response to various forms of cellular stress, the levels of p53 increase and a proportion of p53 rapidly localizes to the mitochondria[30]. In the present study, the mitochondrial Δψ collapse after LY294002 treatment may have been caused by upregulation of p53. p53 accumulates in the nucleus, where it trans-activates a number of proapoptotic target genes[31], and induces apoptotic cell death.
p53 protein can engage apoptosis by inducing expression of PUMA, which leads to release of cytochrome c from the mitochondria and apoptosis of the cell. We found that expression of p53 and its target gene PUMA was induced after LY294002 treatment. Baseline PUMA expression was very low, and LY294002 markedly increased the expression of PUMA. PUMA is a downstream target of the p53 tumor suppressor gene and a member of the BH3-only group of Bcl-2 family proteins[32,33]. Activation of PUMA by DNA damage is dependent on p53 and is mediated by the direct binding of p53 to the PUMA promoter region[33]. PUMA plays an essential role in the p53-dependent and -independent apoptosis induced by a variety of stimuli[34]. Here, we demonstrated that the class I PI3K inhibitor LY294002 activates p53 and upregulates PUMA, suggesting that the LY29402-induced apoptosis of SGC7901 cells may be mediated by the p53 apoptotic signaling pathway.
Although induction of p53 by LY294002 has been previously reported, the role of p53 induction in LY294002-induced tumor inhibition remains unclear. In the present study, we evaluated the contribution of p53 to the LY294002-induced apoptotic death of SGC7901 cells using a specific p53 inhibitor, Pft-α. We found that the LY294002-induced induction of p53 and PUMA, as well as apoptosis, were partially blocked by Pft-α. This is the first time that p53 and PUMA induction have been shown to contribute to the antitumor effects of LY294002.
All these observations suggest that p53 and apoptosis activation may contribute significantly to the LY294002-induced death of SGC7901 cells. Further investigation of the downstream signals of PI3K/AKT involved in regulating cell proliferation and apoptosis may reveal new strategies for targeting therapies at the PI3K/AKT signaling pathway.
References
- Parkin DM, Bray FI, Devesa SS. Cancer burden in the year 2000. The global picture. Eur J Cancer 2001;37:S4-6.
- Jemal A, Thomas A, Murray T, Thun M. Cancer statistics. CA Cancer J Clin 2002;52:23-47.
- Zheng L, Wang L, Ajani J, Xie K. Molecular basis of gastric cancer development and progression. Gastric Cancer 2004;7:61-77.
- Vogt PK. PI3-kinase, mTOR, protein synthesis and cancer. Trends Mol Med 2001;7:482-4.
- Oldham S, Hafen E. Insulin/IGF and target of rapamycin signaling: a TOR de force in growth control. Trends Cell Biol 2003;13:79-85.
- Choe G, Horvath S, Cloughesy TF, Crosby K, Seligson D, Palotie A, et al. Analysis of the phosphatidylinositol 3'-kinase signaling pathway in glioblastoma patients in vivo. Cancer Res 2003;63:2742-6.
- Neve RM, Holbro T, Hynes NE. Distinct roles for phosphoinositide 3-kinase, mitogen-activated protein kinase and p38 MAPK in mediating cell cycle progression of breast cancer cells. Oncogene 2002;21:4567-76.
- Philp AJ, Campbell IG, Leet C, Vincan E, Rockman SP, Whitehead RH, et al. The phosphatidylinositol 3'-kinase p85alpha gene is an oncogene in human ovarian and colon tumors. Cancer Res 2001;61:7426-79.
- Toker A, Cantley LC. Signalling through the lipid products of phosphoinositide-3-OH kinase. Nature 1997;387:673-6.
- Ullrich A, Schlessinger J. Signal transduction by receptors with tyrosine kinase activity. Cell 1990;61:203-12.
- Franke TF, Kaplan DR, Cantley LC. PI3K: downstream AKTion blocks apoptosis. Cell 1997;88:435-7.
- Carpenter CL, Cantley LC. Phosphoinositide kinases. Biochemistry 1990;29:11147-56.
- Vanhaesebroeck B, Waterfield MD. Signaling by distinct classes of phosphoinositide 3-kinases. Exp Cell Res 1999;253:239-54.
- Hawkins PT, Anderson KE, Davidson K, Stephens LR. Signalling through class I PI3Ks in mammalian cells. Biochem Soc Trans 2006;34:647-62.
- Maehama T, Dixon JE. PTEN: a tumour suppressor that functions as a phospholipid phosphatase. Trends Cell Biol 1999;9:125-8.
- Shayesteh L, Lu Y, Kuo W, Baldocchi R, Godfrey T, Collins C, et al. PIK3CA is implicated as an oncogene in ovarian cancer. Nat Genet 1999;21:99-102.
- Ueki K, Fruman DA, Brachmann SM, Tseng YH, Cantley LC, Kahn CR. Molecular balance between the regulatory and catalytic subunits of phosphoinositide 3-kinase regulates cell signaling and survival. Mol Cell Biol 2002;22:965-77.
- Vivanco I, Sawyers CL. The phosphatidylinositol 3-kinase-AKT pathway in human cancer. Nat Rev Cancer 2002;2:489-501.
- Jackson SP, Schoenwaelder SM, Goncalves I, Nesbitt WS, Yap CL, Wright CE, et al. PI3-kinase p110beta: a new target for antithrombotic therapy. Nat Med 2005;11:507-14.
- Oren M. Decision making by p53: life, death and cancer. Cell Death Differ 2003;10:431-42.
- Vousden KH, Lu X. Live or let die: the cell’s response to p53. Nat Rev Cancer 2002;2:594-604.
- Vlahos CJ, Matter WF, Hui KY, Brown RF. A specific inhibitor of phosphatidylinositol 3-kinase, 2-(4-morpholinyl)-8-phenyl-4H-1-benzopyran-4-1 (LY294002). J Biol Chem 1994;269:5241-8.
- Alvarez-Tejado M, Naranjo-Suarez S, Jiménez C, Carrera AC, Landázuri MO, del Peso L. Hypoxia induced the activation of the phosphatidy-linositol 3-kinase/Akt cell survival pathway in PC12 cells. J Biol Chem 2001;276:22368-74.
- Rashid SF, Moore JS, Walker E, Driver PM, Engel J, Edwards CE, et al. Synergistic growth inhibition of prostate cancer cells by 1 alpha, 25 dihydroxyvitamin D(3) and its 19-nor-hexafluoride analogs in combination with either sodium butyrate or trichostatin A. Oncogene 2001;15:1860-72.
- Komarov PG, Komarova EA, Kondratov RV, Christov-Tselkov K, Coon JS, Chernov MV, et al. A chemical inhibitor of p53 that protects mice from the side effects of cancer therapy. Science 1999;285:1733-7.
- Semba S, Itoh N, Ito M, Harada M, Yamakawa M. The in vitro and in vivo effects of 2-(4-morpholinyl)-8-phenyl-chromone (LY294002), a specific inhibitor of phosphatidylinositol 3'-kinase, in human colon cancer cells. Clin Cancer Res 2002;8:1957-63.
- Itoh N, Semba S, Ito M, Takeda H, Kawata S, Yamakawa M. Phosphorylation of Akt/PKB is required for suppression of cancer cell apoptosis and tumor progression in human colorectal carcinoma. Cancer 2002;94:3127-34.
- Hu L, Zaloudek C, Mills GB, Gray J, Jaffe RB. In vivo and in vitro ovarian carcinoma growth inhibition by a phosphatidylinositol 3-kinase inhibitor (LY294002). Clin Cancer Res 2000;6:880-6.
- Moll UM, Zaika A. Nuclear and mitochondrial apoptotic pathways of p53. FEBS Lett 2001;493:65-9.
- Erster S, Mihara M, Kim RH, Petrenko O, Moll UM. In vivo mitochondrial p53 translocation triggers a rapid first wave of cell death in response to DNA damage that can precede p53 target gene activation. Mol Cell Biol 2004;24:6728-41.
- Crighton D, Ryan KM. Splicing DNA-damage responses to tumour cell death. Biochim Biophys Acta 2004; 1705: 3–15.
- Yu J, Zhang L, Hwang PM, Kinzler KW, Vogelstein B. PUMA induces the rapid apoptosis of colorectal cancer cells. Mol Cell 2001;7:673-82.
- Nakano K, Vousden KH. PUMA, a novel proapoptotic gene, is induced by p53. Mol Cell 2001;7:683-94.
- Yu J, Zhang L. No PUMA, no death: implications for p53-dependent apoptosis. Cancer Cell 2003;4:248-9.