
Pharmacokinetics/pharmacodynamics of antofloxacin hydrochloride in a neutropenic murine thigh model of Staphylococcus aureus infection
Introduction
Antofloxacin hydrochloride, an 8-NH2 derivant of levofloxacin, is a new fluoroquinolone antibiotic with broad-spectrum in vitro activity against Gram-positive and Gram-negative pathogens and was developed entirely by Chinese researchers. Quinolone antibiotics are generally considered to have concentration-dependent bactericidal activity and the AUC/MIC and Cmax/MIC ratios are identified as possible pharmacodynamic predictors of clinical and bacterial outcome[1–3]. To evaluate the potential efficacy and determine the proper dosing regimens of the class I new fluoroquinolone, antofloxacin hydrochloride, a basic pharmacodynamic understanding is necessary.
The objective of this study is to characterize the phar-macodynamic relationship between the antofloxacin exposure and its in vivo antimicrobial activity, and then determine the pharmacokinetic/pharmacodynamic (PK/PD) parameter that most strongly correlated with the efficacy. We also estimate the predictive value of the PK/PD parameter of antofloxacin against Staphylococcus aureus.
Materials and methods
Bacteria, media and antibiotics Staphylococcus aureus strains (ATCC 29213 and 7 clinical isolates) were used in our study. The organisms were selected to show different susceptibilities to antofloxacin hydrochloride. The strains were grown, subcultured, and colony forming units (CFU) in Mueller-Hinton (MH) broth and MH agar (Oxoid Ltd, Basingstoke, England) were measured. Antofloxacin hydrochloride power (purity: 99.75%) was supplied by Global Products (An-hui, China).
Susceptibility tests The MICs of antofloxacin hydrochloride were determined in duplicate by microdilution methods according to the guidelines of CLSI 2006.
Murine thigh infection model The neutropenic mice thigh infection model, fully described by Craig, was used in this study[4]. This model has been used extensively and most commonly to describe the pharmacodynamics and correlate the drug exposure with organism response of fluoroquinolones. The female ICR mice, weighing 19–21 g, were obtained from the Health Science Center of Peking University. Neutropenia was induced in mice by giving 150 mg/kg and 100 mg/kg of cyclophosphamide (CPA, ip) at day –4 and –1 before thigh infection and therapy. This regimen has been shown to render sustained neutropenia by day 0, which is sustained for 4–5 d[4–6]. We previously counted the leucocytes and neutrophils in peripheral blood in this model and found that this regimen can induce sustained neutropenia (neutrophils, <100/mm3) for 5 d, which is consistent with results reported previously[7]. This study was conducted in accordance with the National Standards for Laboratory Animals of China.
The organisms were stored at –65 ºC before being subcultured on MH agar. Fresh isolates of 1–2 colonies were inoculated into 10 mL MH broth and allowed to grow into a log growth phase of 1×10⁹ to 1×10¹⁰ CFU/mL after incubation at 35 ºC for 18 h. After a 1:100 dilution into MH broth, 0.1 mL of bacterial suspension (1×10⁶ to 1×10⁷ CFU) was injected intramuscularly into each thigh. The inoculum concentration was confirmed by plating serial 10-fold dilution on MH agar. The lower limit of detection of CFU was 1×10².
Drug pharmacokinetic studies The pharmacokinetic profile of antofloxacin hydrochloride was studied in thigh-infected mice. After being given a single dose (10, 40 and 80 mg/kg, sc), the mice were sampled through retro-orbital puncture at 5, 10, 15, 20, 30, 60, 90, 120, 180, 240, and 300 min. For each dose group of 5 mice, the blood samples collected from each mouse were less than 10% of the total blood volume. The blood samples were centrifuged at 7000×g for 5 min and serum was removed into a 1.5 mL polyprophlene tube and then stored at –65 ºC. Serum antofloxacin hydrochloride concentration was determined with HPLC method (Waters Associates, Milford, MA, USA). The mixture of 50 µL serum sample and 20 µL trichloroacetic acid was centrifuged, the upper layer was injected into the HPLC system with the autosampler (model 717 plus), a chromatographic pump (Model 515) and a dual λ absorbance detector (293nm, Model 2487). The chromatographic column for separation was reversed-phase LichroCART100 RP-18e (125 mm×4 mm, 5-µm) (Merck KGaA, Frankfurter, Germany). The mobile phase was set at a flow rate of 0.8 mL/min and consisted of phosphate buffer and aetonitrile [87:13 (v/v)].
The assay was linear over a range of 0.156 to 40 µg/mL. Intraday and interday coefficients of variation for the low (0.556 µg/mL), medium (3.33 µg/mL) and high (20 µg/mL)-concentration quality control samples were less than 10% over the concentration ranges tested. The analysis of serum pharmacokinetic results was carried out with DAS 1.0 software, the best pharmacokinetic compartment model simulated was two-compartment with first-order absorption and elimination. The pharmacokinetic parameters including the elimination half-life (t1/2β), AUC and Cmax ,etc were calculated.
Relationship between the efficacy of Antofloxacin hydrochloride and the PK/PD parameters Two S aureus strains, ATCC 29213 and clinical isolate 03229, were used in this study. The neutropenic mice were treated with subcutaneous antofloxacin hydrochloride in 0.2 mL volumes 2 h after infection. The total doses varied from 5 to 640 mg/kg per d (2 fold-increasing total doses: 5, 10, 20, 40, 80, 160, 320, and 640 mg/kg per d), which were divided into 1, 2, 4, or 8 doses. After 24 h of therapy, all of the mice were killed and both thighs were removed aseptically and homogenized (190 g, Scientz, Zhejiang, China) in 1.5 mL 0.9% NaCl. Serial dilutions were plated on MH agar for CFU determination.
The control mice were given 0.9% NaCl subcutaneously at the same volume and schedule, and were killed for CFU determination in thighs just before and 24 h after therapy.
Efficacy (the change in log10CFU of bacteria in thigh) of different regimens was calculated by subtracting the mean log10CFU per thigh of the control mice, obtained just before initiation of therapy, from that of the antofloxacin hydrochloride treated mice after 24 h of therapy.
PK/PD parameter magnitude predictive of efficacy The dosing regimens were similar with the relationship study except the strains and the dosing intervals. Eight S aureus strains, ATCC 29213 and 7 clinical isolates, were used in this study. The same total daily antofloxacin hydrochloride doses ranged from 5 to 640 mg/kg per d were given every 6 h and 12 h. The control mice were also given 0.9% NaCl at the same schedule and killed for CFU determination just before and 24 h after therapy. After 24-h therapy the treated mice were also killed for CFU determination per thigh.
Efficacy was calculated by subtracting the mean log CFU per thigh of the treated mice from that of the control mice after 24-h therapy. The endpoints are the daily static dose and AUC24 h/MIC.
Statistical analysis The serum pharmacokinetic parameters calculated were expressed in mean±SD. Differences were analyzed for statistical significance by ANOVA (SPSS12.0). The relationship between efficacy and each of the three PK/PD parameters (AUC24 h/MIC, T>MIC, and Cmax/MIC) was determined by nonlinear regression analysis (Originpro 7.0, OriginLab). The coefficient of determination (R2) was used to estimate the variance that could be due to regression with each of the PK/PD parameters.
The PK/PD parameter magnitudes predictive of efficacy were ascertained using a modified Hill’s equation (Sigmoid Emax model): log10D={log10[E/(Emax–E)]}/N+log10ED50, where E is the efficacy, in effect, the change in log10CFU per thigh between antofloxacin hydrochloride-treated and saline-treated control group after 24 h of therapy, Emax is the maximum efficacy, D is the total daily dose, ED50 is the dose required to achieve 50% of Emax, and N is the slope of the dose-effect curve. The indices Emax, ED50, and N were calculated with Originpro 7.0 software. When E is the CFU change in the log of saline treated mice per thigh during the 24 h period of study, and D is the static daily dose. When E is the CFU change in the log of saline treated mice plus 1, D is 1 log10CFU kill dose.
Results
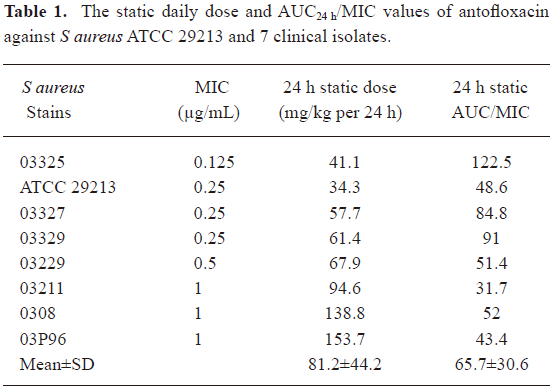
Susceptibility tests The MICs of antofloxacin hydrochloride against 8 S aureus strains varied from 0.125 to 1 µg/mL (Table 1). The organisms were selected to represent a range of susceptibilities in order to allow a wide range of PK/PD indices.
Full table
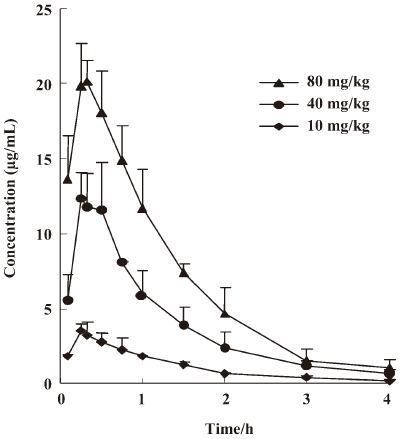
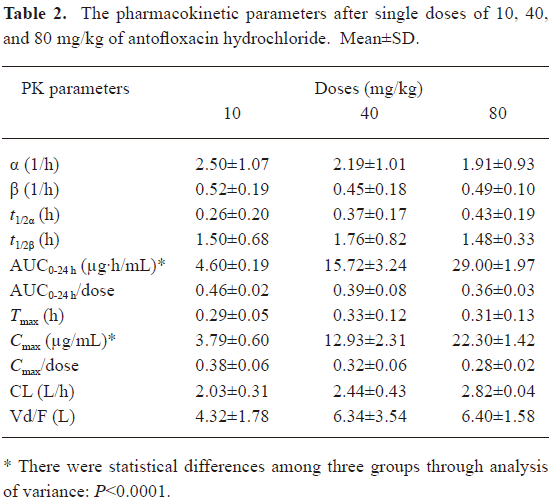
Drug pharmacokinetic studies The serum concentration-time curves of antofloxacin hydrochloride in neutropenic thigh-infected mice after being given single-doses of 10, 40, and 80 mg/kg are shown in Figure 1. The pharmacokinetic constants, AUC24 h, Cmax, Tmax, t1/2β, etc, are presented in Table 2. No statistical difference was found among the escalating single doses for Tmax, t1/2β, and CL. The t1/2β of single doses ranged from 1.48 to 1.76 h (P, 0.80), and the AUC24 h and Cmax significantly increased in a linear way as the dosing regimens increased.
Full table
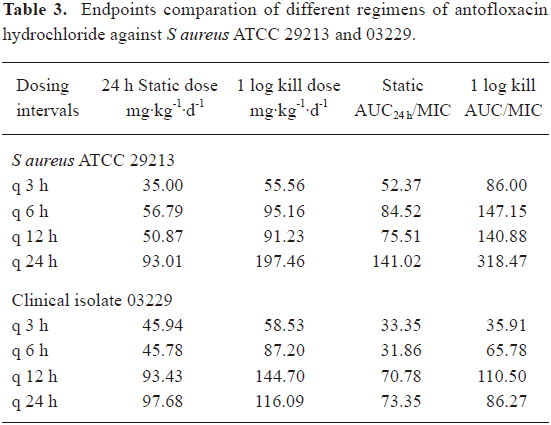
Relationship between the efficacy of antofloxacin hydrochloride and PK/PD parameters The neutropenic ICR mice received 0.1 mL of 1×10⁶ to 1×10⁷ CFU suspension of S aureus strains ATCC 29213 and clinical isolate 03229 in each thigh. At the start of therapy (2 h post inoculation), the mean bacterial count were 6.61±0.16, 7.14±0.11 log10CFU, respectively. In the saline treated control mice, organisms grew well and increased to 9.02±0.35, 8.61±0.40 log10CFU over the 24-h study period per thigh, and the mean CFU change in log was 2.54±0.25, 1.83± 0.26 log10CFU, respectively. The highest daily dose (640 mg/kg) reduced the organism burden 4.10±0.40, 4.00±0.80 log10CFU/thigh, respectively. As shown in Table 3, the 24 h static dose and 1 log kill dose of 3 h and 6 h dosing intervals were similar, but lower than the 24 h interval, the 8-dose regimen showed the lowest predictive dose, which is probably due to the very rapid elimination of the drug in the mice[1–3].
Full table
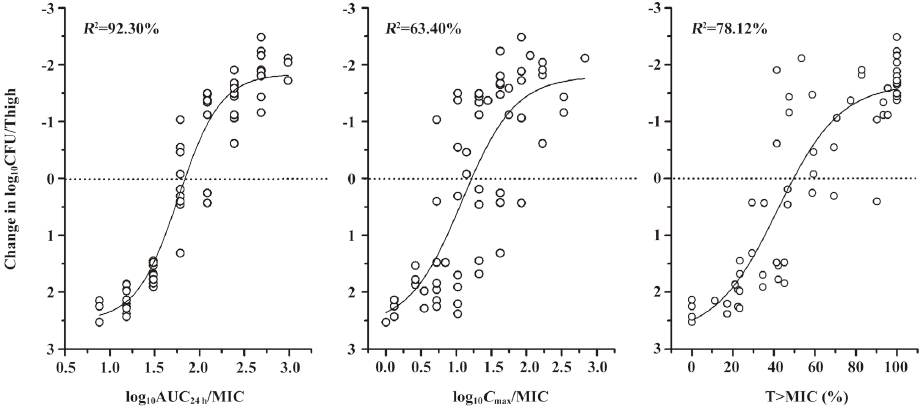
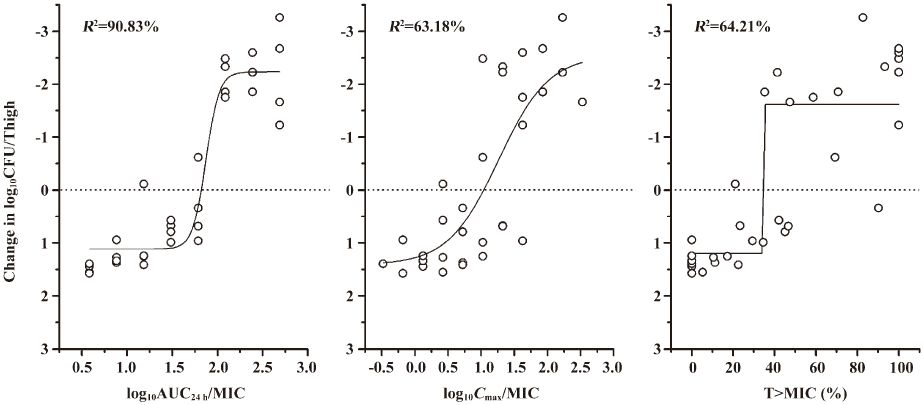
We carried out a non-linear curve fit (Sigmoid function) to determine which of the PK/PD parameters (AUC24 h/MIC, Cmax/MIC and T>MIC [%]) was most correlative with the bacterial outcomes. As shown in Figure 2, the best correlation was found between the AUC24 h/MIC and the change in log10CFU/thigh of ATCC 29213, with an R2 value of 92.30%, which is similar to other studies of fluoroquinolone antibiotics[2,3,6,8–14]. Correlations with the Cmax/MIC and T>MIC (%) were similar to the R2 values of 63.40% and 78.12%, respectively. A similar analysis of study with S aureus 03229 is shown in Figure 3. The strongest correlation was also found to exist between the AUC24 h/MIC and the change in log10CFU/thigh (for AUC24 h/MIC, R2=90.83%; for Cmax/MIC, R2=63.18 and for T>MIC[%], R2=64.21%).
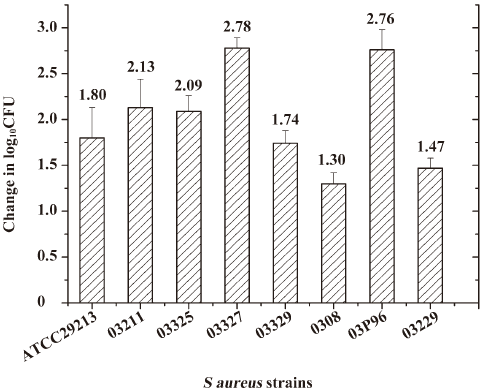
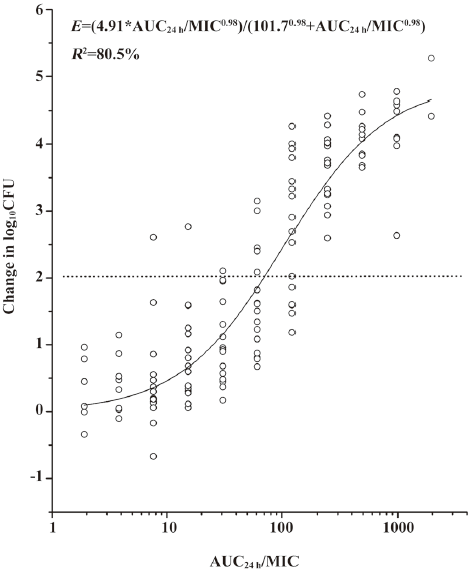
PK/PD parameter magnitude predictive of outcome The S aureus strains ATCC 29213 and 7 clinical isolates were used in this study, with similar growth curves in thighs of saline treated control mice (Figure 4). At the start of therapy (2 h post inoculation), the mean bacterial count varied from 6.36 to 7.14 log10CFU/thigh (mean, 6.73±0.30 log10CFU). In saline treated control mice, organisms increased 1.30 to 2.78 log10CFU (mean, 2.07±0.59 log10CFU). The highest daily dose (640 mg/kg) of antofloxacin hydrochloride reduced organism burden 3.26 to 5.27 log10CFU (mean, 4.45±0.60 log10CFU).
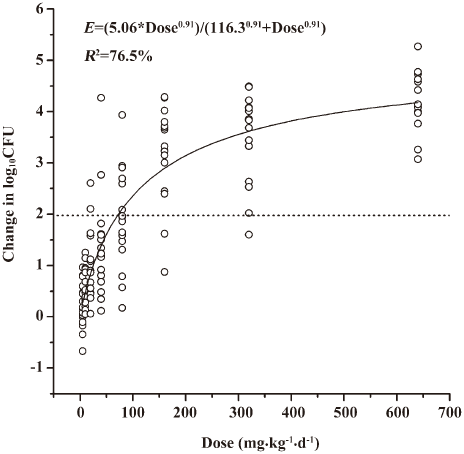
A modified Hill equation was used to calculate the 24 h dose and the AUC24 h/MIC ratios to achieve a static effect (net bacterial growth in thighs after 24 h of therapy). As shown in Table 1, the MICs of antofloxacin against 8 organisms ranged from 0.125 to 1 µg/mL, the daily doses of antofloxacin required for a bacteriostatic effect varied from 34.3 to 153.7 mg/kg per 24 h (mean, 81.2±44.2 mg/kg per 24 h), the AUC24h/MIC ratio from 31.7 to 122.5 (mean, 65.7±30.6), which is similar with that of other fluoroquinolones studies. The dose-response curve of antofloxacin against the 8 S aureus strains evaluated by Sigmoid Emax model is shown in Figure 5; the relationship between the total AUC24 h/MIC ratio and efficacy is shown in Figure 6.
Discussion
Antimicrobial PD studies combining both the pharmacokinetic (AUC, Cmax) and in vitro susceptibility (MIC) data can characterize the time course of the antibiotic effect and describe the relationships among the antimicrobials, pathogens, and host[15]. They provide a rational basis to optimize the drug selection and dosing regimens rather than only relying on static in vitro MIC data.
Numerous in vitro pharmacokinetic model, in vivo animal infection model and human trial studies have suggested that the quinolones have concentration-dependent killing activity. The PK/PD parameters, Cmax/MIC and AUC/MIC ratios, have been identified as potential predictors of efficacy, and the the Cmax/MIC ratio may be an important indicator of the development of bacterial resistance[1–3,8–13,16–18].
Antofloxacin hydrochloride, an 8-NH2 derivant of levofloxacin, is a new fluoroquinolone antibiotic and was developed entirely by Chinese researchers. It exhibits broad-spectrum in vitro activity against Gram-positive and Gram-negative pathogens and is similar in vivo efficacy to levofloxacin[19,20]. Our study used the intramuscular bacterial killing as the therapeutic endpoint and characterized the pharmacodynamic relationship between the antofloxacin exposure and its in vivo antimicrobial activity, then estimated its predictive value of the 24 h AUC/MIC ratio against S aureus.
There are high degrees of interdependence among the three PK/PD indices (AUC/MIC, Cmax/MIC and T>MIC [%]), so we designed a dosing regimen of dose-fractionation to correlate the three PK/PD indices specifically with bacterial outcome. The total daily doses of antofloxacin hydrochloride ranged from 5 to 640 mg/kg per d, and were divided into 1, 2, 4, and 8 doses, respectively. The same daily dose resulted in the same AUC/MIC but higher Cmax/MIC ratio when the dosing intervals are prolonged.
There have been some controversial results about the predictive significance of Cmax/MIC ratio[18]. Drusano et al studied the pharmacodynamics of lomefloxacin in a neutropenic rat model of Pseudomonas sepsis. They found that the Cmax/MIC ratio was significantly correlated with the animal survival rate, particularly when high ratios (10/1 to 20/1) were obtained. At lower doses, producing Cmax/MIC ratios <10/1, the area under the AUC/MIC ratio appeared to be most closely linked to the outcome. The reason was stated to be the larger inoculum size (1×10⁹) of Pseudomonas and higher likelihood that the resistant mutants will exit. Now the Cmax/MIC ratio is the most linkable index with outcome[3]. The report of Leggett et al in 1991 suggested that the AUC/MIC ratio might be the most closely associated PK/PD index even when the Cmax/MIC ratio is less than 10:1[21].
Similar to the previous results of other fluoroquinolones, our study demonstrated that the best correlated PK/PD parameter against S aureus with bactericidal activity was the AUC/MIC ratio, with a R2 of more than 90%[1,2,6,8–14] . In our study, the inoculum size of S aureus given in neutropenic mice was 1×10⁶–1×10⁷CFU per thigh, the mutational frequency to resistance may be of a lower order. The MICs of antofloxacin against S aureus varied from 0.125 to 1 µg/mL and the percentage of higher Cmax/MIC ratios following different dosages (>10:1) was 59.4%. That may be why in our study the PK/PD parameter most closely correlated with the efficacy of the AUC24 h/MIC ratio, but not Cmax/MIC.
When the PK/PD index that is most closely associated with efficacy is determined, the predictive PK/PD values should then be defined against several pathogens. Many pharmacodynamic studies have used in vitro phar-macokinetic models, in vivo animal infection models and clinical trials to show that the optimal pharmacodynamic targets can predict clinical response. Andes et al evaluated the in vivo activity of sitafloxacin, gimifloxacin, gatifloxacin and garenoxacin in a neutropenic murine thigh infection model against Streptococcus pneumoniae, S aureus and Enterobacteriaceae. Their studies suggest similar effective PK/PD predictors among these different fluoroquinolone antibiotics. For S pneumoniae the mean AUC/MIC ratio is 37, 35, 52, and 33; for S aureus the mean AUC/MIC ratio is 71, 35, 36, 81; and for Gram-negative pathogens the mean AUC/MIC ratio is 43, 35, 41, and 33. The values of predictive PK/PD indices were similar among the different dosing intervals, the fluoroquinolone antibiotics, and the site of infection[1,2]. Quintiliani studied the efficacy of trovafloxacin in the treatment of respiratory tract infection and found that the predictive 24-h AUC/MIC ratio was 50–100 against anaerobic infection[22]. Forrest et al found that the AUC/MIC ratio of >125 was the PK/PD target to achieve the best clinical cure rates against the Gram-negative pathogens (Pseudomonas aeruginosa), which was higher than against Gram-positive organisms[8]. In a prospective multivariate analysis, Preston et al found that both peak level/MIC and AUC/MIC were important predictors of successful levofloxacin therapy in pulmonary, soft tissue, and urinary tract infections. When the peak/MIC and AUC/MIC ratios reached 12.2 and 100, respectively, rates of clinical and microbiologic cures approached 100%[23] .
In this study, the novel fluoroquinolone demons-trated excellent in vivo activity against eight S aureus strains, the total daily dose to achieve a net bactericidal effect was 34.3 to 153.7 mg/kg per 24 h (mean, 81.2±44.2 mg/kg per 24 h), the total AUC/MIC ratio of 31.7 to 122.5 (mean, 65.7±30.6), which is similar to other studies of fluoroquinolone antibiotics. These pharmacodynamic targets should be useful for dosing regimen design for future clinical trials. Based on the pharmacokinetics study of a 500 mg oral dose of antofloxacin in healthy subjects, the total 24 h AUC is 86, to consider the effective PK/PD targets of 66 identified in the current in vivo models, the treatment of antofloxacin hydrochloride may be successful against the S aureus strains for which the MICs are as high as 1 µg/mL.
However, only total drug levels are considered in pharmacokinetic calculations in our study, the PK/PD parameters are not based on the free drug levels that penetrate into tissue and play. We should carry out the protein binding of this drug in the serum of the neutropenic infected mice in further study, although some studies suggested that the consideration of both total and free-drug serum levels did not remarkably affect the relationships between the PK/PD parameters and efficacy[1,2,24]. More Gram-positive and Gram-negative pathogens such as S pneumoniae and Escherichia coli should be studied to fully characterize the pharmacodynamics of this new drug in further work.
References
- Andes D, Craig WA. Pharmacodynamics of the new fluoroquinolone gatifloxacin in murine thigh and lung infection models. Antimicrob Agents Chemother 2002;46:1665-70.
- Andes D, Craig WA. Pharmacodynamics of the new des-f(6)-quinolone garenoxacin in a murine thigh infection model. Antimicrob Agents Chemother 2003;47:3935-41.
- Drusano GL, Johnson DE, Rosen M, Standiford HC. Pharmacodynamics of a fluoroquinolone antimicrobial agent in a neutropenic rat model of Pseudomonas sepsis. Antimicrob Agents Chemother 1993;37:483-90.
- Andes D, Craig WA. In vivo activities of amoxicillin and amoxicillin-clavulanate against Streptococcus pneumoniae: application to breakpoint determinations. Antimicrob Agents Chemother 1998;42:2375-9.
- Joly-Guillou ML, Wolff M, Pocidalo JJ, Walker F, Carbon C. Use of a new mouse model of Acinetobacter baumannii pneumonia to evaluate the postantibiotic effect of imipenem. Antimicrob Agents Chemother 1997;41:345-51.
- Onyeji CO, Bui KQ, Owens RC Jr, Nicolau DP, Quintiliani R, Nightingale CH. Comparative efficacies of levofloxacin and ciprofloxacin against Streptococcus pneumoniae in a mouse model of experimental septicaemia. Int J Antimicrob Agents 1999;12:107-14.
- Xiao XM, Xiao YH. Establishment of a neutropenic-mouse thigh model with S aureus infection. Chin J Clin Pharmacol 2007;23:45-9.
- Forrest A, Nix DE, Ballow CH, Goss TF, Birmingham MC, Schentag JJ. Pharmacodynamics of intravenous ciprofloxacin in seriously ill patients. Antimicrob Agents Chemother 1993;37:1073-81.
- Lister PD, Sanders CC. Pharmacodynamics of levofloxacin and ciprofloxacin against Streptococcus pneumoniae. J Antimicrob Chemother 1999;43:79-86.
- Lister PD, Sanders CC. Pharmacodynamics of trovafloxacin, ofloxacin, and ciprofloxacin against Streptococcus pneumoniae in an in vitro pharmacokinetic model. Antimicrob Agents Chemother 1999;43:1118-23.
- Andes DR, Craig WA. Pharmacodynamics of fluoroquinolones in experimental models of endocarditis. Clin Infect Dis 1998;27:47-50.
- Forrest A, Chodosh S, Amantea MA, Collins DA, Schentag JJ. Pharmacokinetics and pharmacodynamics of oral grepafloxacin in patients with acute bacterial exacerbations of chronic bronchitis. J Antimicrob Chemother 1997; 40 Suppl A: 45–57.
- Blaser J, Stone BB, Groner MC, Zinner SH. Comparative study with enoxacin and netilmicin in a pharmacodynamic model to determine importance of ratio of antibiotic peak concentration to MIC for bactericidal activity and emergence of resistance. Antimicrob Agents Chemother 1987;31:1054-60.
- Drusano GL, Preston SL, Owens RC Jr, Ambrose PG. Fluoroquinolone pharmacodynamics. Clin Infect Dis 2001;33:2091-6.
- Craig WA. Pharmacokinetic/pharmacodynamic parameters: rationale for antibacterial dosing of mice and men. Clin Infect Dis 1998;26:1-10.
- Dudley MN, Blaser J, Gilbert D, Mayer KH, Zinner SH. Combination therapy with ciprofloxacin plus azlocillin against Pseudomonas aeruginosa: effect of simultaneous versus staggered administration in an in vitro model of infection. J Infect Dis 1991;164:499-506.
- Vogelman B, Gudmundsson S, Leggett J, Turnidge J, Ebert S, Craig WA. Correlation of antimicrobial pharmacokinetic parameters with therapeutic efficacy in an animal model. J Infect Dis 1988;158:831-47.
- Dudley MN. Pharmacodynamics and pharmacokinetics of antibiotics with special reference to the fluoroquinolones. Am J Med 1991;91:45S-50S.
- He YC. YJ, Xu L, Lv YH, Liu HX, Sun RY, Zheng QS. Design of a clinical trial of non-inferiority for treating acute bacterial infections and its quantitative analysis. J Clin Pharmacol Ther 2007;11:1299-305.
- Lv Y, Xiao YH, Liu Y, Xia YH, Li TY. Tolerance of antofloxacin hydrochloride after ascending single oral dose administration in healthy male volunteers. Chin J Clin Pharmacol 2008;24:17-20.
- Leggett JE, Ebert S, Fantin B, Craig WA. Comparative dose-effect relations at several dosing intervals for beta-lactam, aminoglycoside and quinolone antibiotics against Gram-negative bacilli in murine thigh-infection and pneumonitis models. Scand J Infect Dis Suppl 1990;74:179-84.
- Quintiliani R, Owens RC, Grant EM. Clinical role of fluoroquinolones in patients with respiratory tract infections. Infect Dis Clin Prac 1999;8 suppl 1:S28-S41.
- Preston SL, Drusano GL, Berman AL, Fowler CL, Chow AT, Dornseif B, et al. Pharmacodynamics of levofloxacin: a new paradigm for early clinical trials. JAMA 1998;279:125-9.
- Andes D, Craig WA. Pharmacodynamics of a new streptogramin, XRP 2868, in murine thigh and lung infection models. Antimicrob Agents Chemother 2006;50:243-9.