
Effects of cyclosporin A and itraconazole on the pharmacokinetics of atorvastatin in rats1
Introduction
Antifungal agents or immunosuppressive agents are commonly coadministered with cholesterol-lowering agents in patients. There are growing reports on the risk of development of rhabdomyolysis, induced by concomitant usage of lovastatin, simvastatin, or atorvastatin [competitive inhibitors of 3-hydroxy-3-methylglutaryl-coenzyme A (HMG-CoA) reductase] with cyclosporin A or itraconazole. Rhabdomyolysis is the breakdown of muscle fibers with release of muscle fiber contents (myoglobin) into the systemic circulation, and some of these are harmful to the kidney and frequently result in kidney damage[1]. Cyclosporin A is an inhibitor of P-glycoprotein (P-gp) and itraconazole is a selective inhibitor of hepatic microsomal cytochrome P450 (CYP) 3A enzyme[2]. For example, cyclosporin A increases the plasma concentrations of simvastatin in renal transplant recipients[3]. Itraconazole increases the total area under the plasma concentration-time curve from time zero to time infinity (AUC) of atorvastatin[4], simvastatin[5], and lovastatin[6] by about 3-, 19-, and 20-fold, respectively. Lovastatin, simvastatin, and atorvastatin (the first-line agents for hypercholesterolemia), substrates of CYP 3A, have extensive first-pass metabolism[7]. Thus, the dosage of a HMG-CoA reductase is needed to decrease when they are used concomitantly with P-gp or CYP3A inhibitors. It has been reported that coadministration of various HMG-CoA inhibitors and cyclosporin A to rats, cyclosporin A alters the disposition of the inhibitors, resulting in increased AUC of the inhibitors[8]. It has been reported that itraconazole can inhibit the metabolism of simvastatin in female rat liver microsomes[9].
Atorvastatin is a synthetic lipid-lowering agent (the rate-limiting enzyme in cholesterol biosynthesis) and has been demonstrated to be effective in reducing total cholesterol, low-density lipoprotein cholesterol, and plasma triglycerides[10]. It was developed by Pfizer and was approved by FDA in 1996. Atorvastatin is mainly metabolized by CYP3A to a number of active metabolites, which are excreted mainly from bile[11]. As already stated, atorvastatin is a substrate or an inhibitor of CYP3A and P-gp[12,13].
It has been known that P-gp and CYP3A have notable effects on the absorption and metabolism, respectively, of compounds which are a substrate of P-gp or CYP3A. In order to clarify the drug–drug interactions mediated by P-gp and CYP3A, focusing on the efflux and metabolism, respectively, we investigated the effects of well known inhibitors (cyclosporin A and itraconazole) on P-gp and/or CYP3A4, and evaluated their contributions to the pharmacokinetics of atorvastatin in rats. For this purpose, we assessed the pharmacokinetics and biliary excretion of atorvastatin after intravenous and intragastric administration to rats with cyclosporin A or itraconazole.
Materials and methods
Chemicals Atorvastatin (purity >99%) was supplied by Yang Jiang Medicine Company (Yangjiang, China). Pitavastatin (internal standard, 10 µg/mL) was obtained from the Center of Drug Metabolism and Pharmacokinetics of China Pharmaceutical University (Nanjing, China). Cyclosporin A and itraconazole were products from Hua Dong Medicine Company (Hangzhou, China). Methanol [high-performance liquid chromatographic (HPLC) grade] was purchased from Tedia Company (Fairfield, OH, USA) and water was from ROBUST (Guangzhou, China). Atorvastatin, cyclosporin A, and itraconazole for injection were prepared by dissolving each drug in sterile saline with 2% alcohol. All other chemicals were purchased commercially and were of analytical grade.
Animals Protocols for the animal studies were approved by the Regulations of Experimental Animal Administration, State Committee of Science and Technology of People’s Republic of China. Male Sprague-Dawley rats (7–9 weeks old and weighing 250–280 g) were purchased from Shanghai Sciple-Bi-Kai Animal Company Ltd. (Shanghai, China). All rats were maintained in a clean-room at a temperature of 23±2 °C and relative humidity of 50%±10%, and had free access to water and standard animal diet. Rats were fasted overnight with free access to water for 12 h before the experiment.
Rats were randomly divided into three groups (n=5, each); intravenous and intragastric administration of atorvastatin without (control) and with cyclosporine A or itraconazole.
Drug administration The bile duct was cannulated with a polyethylene (PE) tube (0.4 mm, id and 0.8 mm, od; Natsume, Tokyo, Japan) while each rat was under ether anesthesia. Cyclosporin A (approximately 0.25, 0.5 and 1.0 mL for 5, 10, and 20 mg/kg, respectively) or itraconazole (approximately 0.2, 0.4 and 0.8 mL for 5, 10, and 20 mg/kg, respectively) was administered intravenously from tail to rats. After 5 min, atorvastatin was injected via the tail vein at a dose of 2 mg/kg (about 0.6 mL) or intragastricly administered at a dose of 10 mg/kg (about 0.8 mL) using stomach tube to rats. Then, bile samples were collected in 0–1, 1–2, 2–4, 4–8, and 8–12 h into tubes and the volume of each sample was recorded. Simultaneously, blood samples (210 µL) were obtained by orbital bleeding at 0 (control), 4, 8, 12, 30, 60, 90, 120, 240, 360, and 480 min after intravenous administration, and 0 (control), 5, 10, 20, 30, 60, 90, 120, 240, 360, and 480 min after intragastric administration. Blood samples were centrifuged and plasma samples (100 µL) were stored at –20 °C until use for the liquid chromatography-tandem mass spectrometric (LC-MS) analysis of atorvastatin[14,15].
LC-MS analysis of atorvastatin Concentrations of atorvastatin in the samples were determined using an electrospray ionization LC-MS (Shimadzu, Kyoto, Japan). In brief, a 10 µL aliquot of internal standard in methanol (10 ng/mL) and a 20 µL aliquot of 1% hydrochloric acid were added to a 100 µL aliquot of sample. Then, a 500 µL aliquot of acetic ether was added, vortex-mixed for 3 min, and centrifuged (4000×g, 5 min). The upper organic layer (400 µL) was transferred into a clean glass test tube and evaporated to dryness under a gentle stream of nitrogen gas at 40 °C. The residue was reconstituted in a 100 µL aliquot of the mobile phase, and centrifuged (12 000×g, 10 min). Then, a 20 µL aliquot was injected directly onto the LC-MS system using autosampler. Bile samples were diluted with the mobile phase to appropriate concentrations and other procedures were similar to those in plasma samples. The mobile phase, methanol: 5 mol/L ammonium acetate containing 0.1% methanoic acid (70:30, v:v) was run at a flow-rate of 1.0 mL/min at 25 °C. The analytical column, a reversed-phase Hypersil ODS2 column (particle size, 5 μm; 4.6 mm, id×250 mm, l.; Elite Company, Dalian, China), was maintained at 40 °C. Mass spectrometry was carried out in positive ion selected ion monitoring (SIM) mode using target ions at m/z 559.25 for atorvastatin and 422.15 for internal standard. The detector voltage was 1.60 kV. The heat block temperature was 200 °C and the curved desolvation line (CDL) temperature was 250 °C. The nebulizer gas flow rate was 1.5 L/min[16]. The retention times for atorvastatin and internal standard were 4.5 and 4.8 min, respectively.
The calibration curve of atorvastatin was linear within the ranges from 2 to 1000 ng/mL in both plasma and bile samples (R2>0.99). The lower limit of quantification was 2 ng/mL. The relative standard deviation (RSD) of inter- and intra-day precisions were both less than 10%. The relative recovery of atorvastatin from plasma and bile samples compared with that in water was more than 60%.
Pharmacokinetic analysis The AUC0–t was calculated using the trapezoidal rule method from time zero to the last measured time, t, in plasma. The peak plasma concentration (Cmax) and the time to reach Cmax (Tmax) were directly read from the experimental data. The extent of absolute oral bioavailability (F) was calculated by dividing the mean AUC0–t following intragastric administration by that following intravenous administration after normalization of the dose. The biliary clearance (CLbile) was estimated by dividing the total amount of drug excreted into the 12-h bile by the AUC0–t.
Statistical analysis A P-value <0.05 was deemed to be statistically significant using one-way ANOVA with the Statistical Package for the Social Sciences (SPSS) 13.0. All data are expressed as the mean±standard deviation.
Results
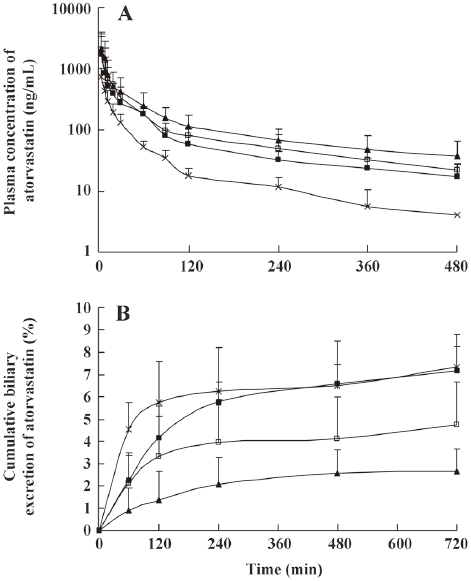
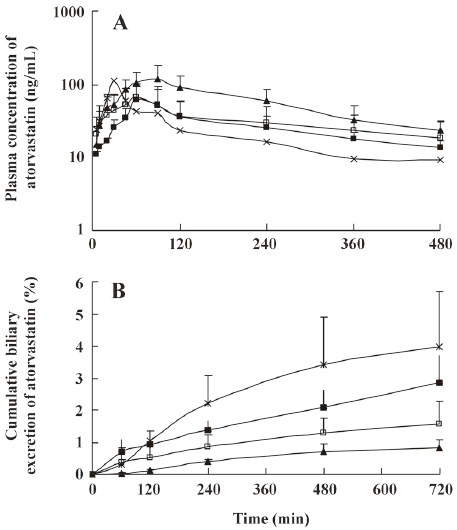
The mean plasma concentration-time and biliary excretion-time profiles of atorvastatin after intravenous and intragastric administration at doses of 2 and 10 mg/kg, respectively, with or without cyclosporine A (5, 10, and 20 mg/kg) are shown in Figures 1 and 2, respectively, and the relevant pharmacokinetic parameters of atorvastatin are listed in Table 1. Compared with the control rats, after intravenous administration of atorvastatin, the CLbile was significantly slower (56.5%, 64.5%, and 79.0% decrease for 5, 10, and 20 mg/kg of cyclosporine A, respectively), the 12-h biliary excretion was significantly smaller (32.1%, 57.5%, and 69.0% decrease for 5, 10, and 20 mg/kg of cyclosporine A, respectively), and the AUC0-t was significantly greater (118%, 193%, and 215% increase for 5, 10, and 20 mg/kg of cyclosporine A, respectively) with cyclosporine A. Compared with the control rats, after intragastric administration of atorvastatin, the CLbile of atorvastatin was significantly slower (92.0%, 96.6%, and 98.0% decrease for 5, 10, and 20 mg/kg of cyclosporin A, respectively), the 12-h biliary excretion was significantly smaller (92.3%, 95.0%, and 97.8% decrease for 5, 10, and 20 mg/kg of cyclosporin A, respectively), and the Tmax was significantly higher (148%, 169%, and 190% increase, respectively), but the AUC0-t was significantly greater (187% increase at 20 mg/kg of cyclosporine A) with cyclosporine A.
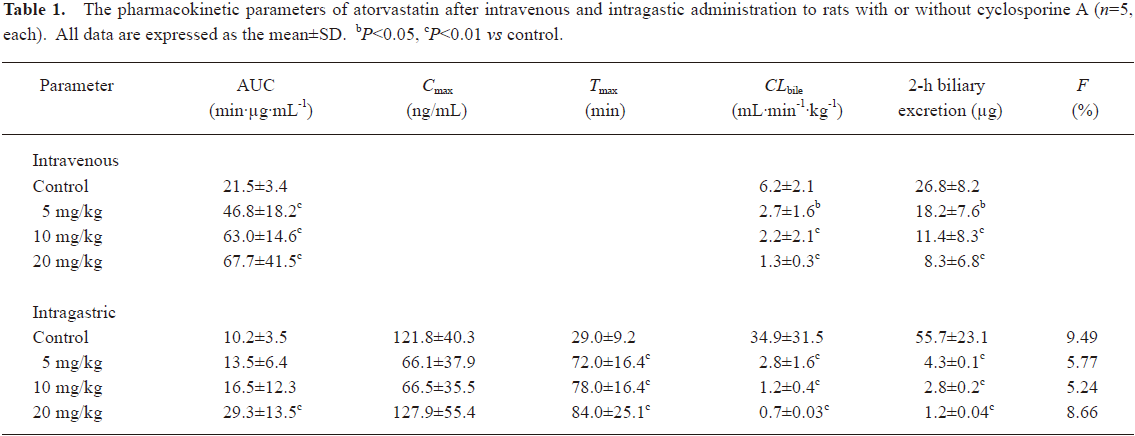
Full table
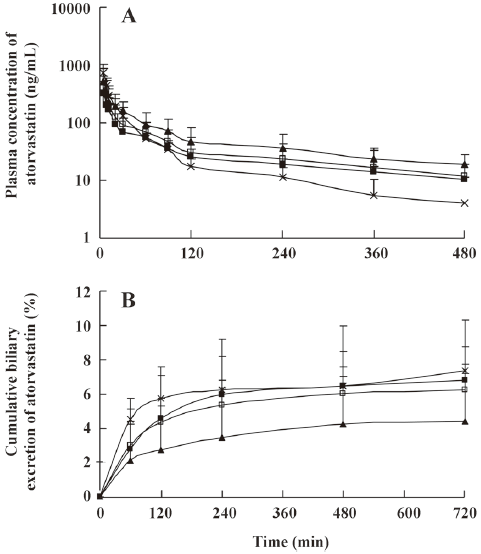
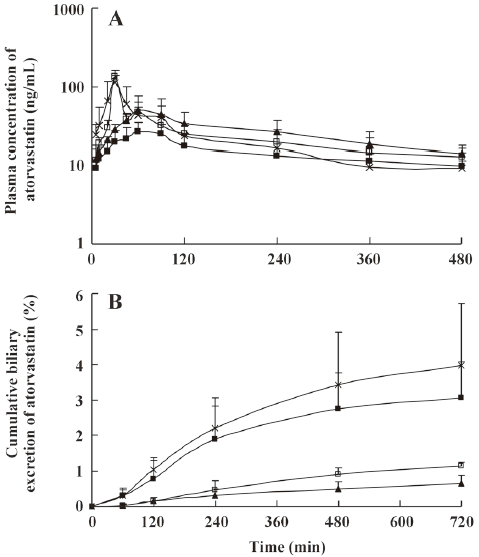
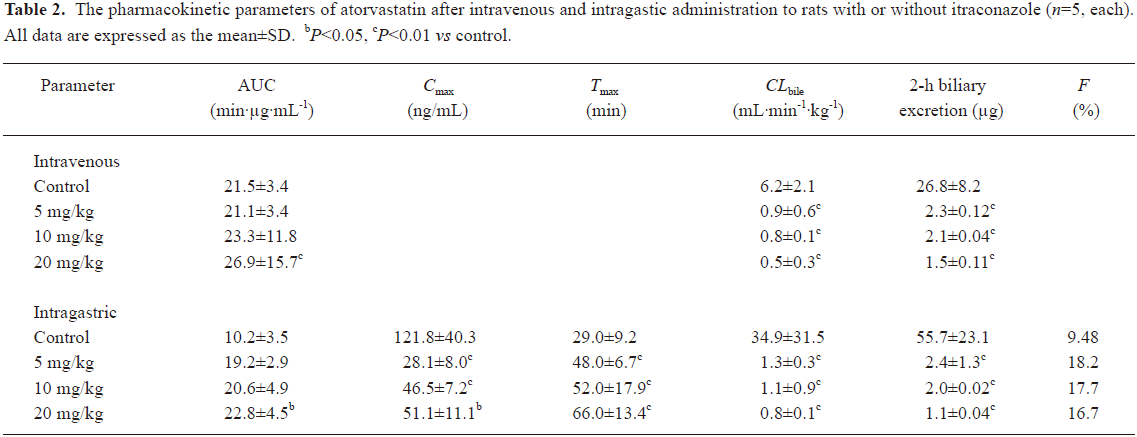
The mean plasma concentration-time and biliary excretion-time profiles of atorvastatin after intravenous and intragastric administration at doses of 2 and 10 mg/kg, respectively, in the presence and absence of itraconazole (5, 10, and 20 mg/kg) are shown in Figures 3 and 4, respectively, and the relevant pharmacokinetic parameters of atorvastatin are listed in Table 2. Compared with the control rats, after intravenous administration of atorvastatin, the CLbile was significantly slower (98.7%, 99.0%, and 99.2% decrease for the 5, 10, and 20 mg/kg of itraconazole, respectively), the 12-h biliary excretion was significantly smaller (91.4%, 92.2%, and 94.4% decrease for the 5, 10, and 20 mg/kg of itraconazole, respectively), and the AUC0-t was significantly greater (24.9% increase at 20 mg/kg of itraconazole) with itraconazole. Compared with the control rats, after intragastric administration of atorvastatin, the CLbile of atorvastatin was significantly slower (99.7%, 99.7%, and 99.8% decrease for 5, 10, and 20 mg/kg of itraconazole, respectively), the 12-h biliary excretion was significantly smaller (98.2%, 96.4%, and 98.0% decrease for 5, 10, and 20 mg/kg of itraconazole, respectively), the Cmax was significantly lower (77.0%, 61.9%, and 58.1% decrease for 5, 10, and 20 mg/kg of itraconazole, respectively), the Tmax was significantly longer (65.5%, 79.3%, and 128% increase for 5, 10, and 20 mg/kg of itraconazole, respectively), and the AUC0-t was significantly greater (123% increase for 20 mg/kg of itraconazole) with itraconazole.
Full table
Discussion
Our study evaluated the effects of cyclosporine A as well as itraconazole on the pharmacokinetics of atorvastatin in rats to investigate potential drug–drug interactions. P-gp acts as an efflux pump or an absorption barrier by preventing transportation of various compounds from the lumen into intestinal cells[17]. P-gp is expressed in the apical brushborder membrane of the enterocyte and bile-duct, and lateral membrane of the hepatocyte[18]. P-gp is also commonly co-expressed with the CYP3A system in many normal organs.
The results of this study indicated that both cyclosporin A and itraconazole caused decreases in the 12-h biliary excretion and CLbile of atorvastatin. After pretreatment with cyclosporine A, the 12-h biliary excretion of atorvastatin decreased with increasing doses of cyclosporine A. This could be due to the effect of P-gp by cyclosporine A on the inhibition of biliary excretion of atorvastatin. Thus, the increase in AUC0–t of atorvastatin could be due to the P-gp effect of cyclosporine A, since cyclosporine A does not affect the hepatic metabolism of atorvastatin[19].
The metabolism of atorvastatin was inhibited by itraconazole and the biliary excretion of atorvastatin was inhibited by cyclosporine A. Moreover, itraconazole had dual potency of inhibiting CYP3A and P-gp. But the inhibitory potency of intraconazole for CYP3A was stronger than that for P-gp. P-gp played an important role in the biliary excretion and CYP3A in small intestine. Itraconazole and cyclosporine A increased the bioavailability of atorvastatin in rats.
Adverse effects of statins are mostly associated with drug–drug interactions[20]. The withdrawal of cerivastatin as a result of deaths due to the development of rhabdomyolysis illustrates the clinical importance of drug–drug interactions[21]. Drug interactions with statins may cause pharmacodynamic and/or pharmacokinetic changes. The pharmacodynamic consequences may or may not be closely correlated to pharmacokinetic changes[22].
The CYP enzyme systems play an important role in the metabolism of the statins, leading to clinically relevant interactions with other agents, such as erythromycin, itraconazole, nefazodone, and human immunodeficiency virus (HIV) protease inhibitors, which are also a substrate of this enzyme system[23]. CYP3A isoenzyme is the main metabolic enzyme for simvastatin, lovastatin, and atorvastatin. Interaction studies reveal that simvastatin and lovastatin have the highest potential for clinically relevant interactions, followed by atorvastatin, and coadministered agents alter the activity of CYP3A and lead to increase in toxicity of the statins[24–26].
Some interactions with CYP3A inhibitors may also involve inhibition of P-gp. Thus, rhabdomyolysis may occur following coadministration of cyclosporine A and statins[27,28]. Thus, attention is needed to the risk of myopathy during treatment of statins with concurrent administration of these agents[29].
References
- Zager RA. Rhabdomyolysis and myohemoglobinuric acute renal failure. Kidney Int 1996;49:314-26.
- Ohno Y, Hisaka A, Suzuki H. General framework for the quantitative prediction of CYP3A4-mediated oral drug interactions based on the AUC increase by coadministration of standard drugs. Clin Pharmacokinet 2007;46:681-96.
- Gumprecht J, Zychma M, Grzeszczak W, Kuźniewicz R, Burak W, Zywiec J, et al. Simvastatin-induced rhabdomyolysis in a CsA-treated renal transplant recipient. Med Sci Monit 2003;9:CS89-91.
- Kantola T, Kivistö KT, Neuvonen PJ. Effect of itraconazole on the pharmacokinetics of atorvastatin. Clin Pharmacol Ther 1998;64:58-65.
- Neuvonen PJ, Kantola T, Kivistö KT. Simvastatin but not pravastatin is very susceptible to interaction with the CYP3A4 inhibitor itraconazole. Clin Pharmacol Ther 1998;63:332-41.
- Neuvonen PJ, Jalava KM. Itraconazole drastically increases plasma concentrations of lovastatin and lovastatin acid. Clin Pharmacol Ther 1996;60:54-61.
- LennemPs H. Fager G. Pharmacodynamics and pharmacokinetics of the HMG-CoA reductase inhibitors. Clin Pharmacokinet 1997;32:403-25.
- Smith PF, Eydelloth RS, Grossman SJ, Stubbs RJ, Schwartz MS, Germershausen JI, et al. HMG-CoA reductase inhibitor-induced myopathy in the rat: cyclosporine A interaction and mechanism studies. J Pharmacol Exp Ther 1991;257:1225-35.
- Ishigami M, Kawabata K, Takasaki W, Ikeda T, Komai T, Ito K, et al. Drug interaction between simvastatin and itraconazole in male and female rats. Drug Metab Dispos 2001;29:1068-72.
- Wierzbicki AS. Atorvastatin. Expert Opin Pharmacother 2001;2:819-30.
- Black A.E, Sinz MW, Hayes RN, Woolf TF. Metabolism and excretion studies in mouse after single and multiple oral doses of the-3-Hydroxy-3-Methylglutaryl-CoA reductase inhibitor atorvastatin. Drug Metab Dispos 1998;26:755-63.
- Kantola T, Krivisto KT, Nenvonen PJ. Effect of itraconazole on the pharmacokinetics of atorvastatin. Clin Pharmacol Ther 1998;64:58-65.
- Wu X, Whitheld LR, Stewart BH. Atorvastatin transport in the Caco-2 cell model: contributions of P-glycoprotein and proton-monocarboxylic acid co-transporter. Pharm Res 2000;17:209-15.
- Berruet N, Sentenac S, Auchere D, Gimenez F, Farinotti R, Fernandez C. Effect of efavirenz on intestinal p-glycoprotein and hepatic p450 function in rats. J Pharm Pharmaceut Sci 2005;8:226-34.
- Kageyama M, Namiki H, Fukushima H, Ito Y, Shibata N, Takada K. In vivo effects of cyclosporin A and ketoconazole on the pharmacokinetics of representative substrates for P-glycoprotein and cytochrome P450 (CYP) 3A in rats. Biol Pharm Bull 2005;28:316-22.
- Ma L, Dong J, Chen XJ. Development and validation of atorvastatin by LC-ESI-MS and application in bioequivalence research in healthy Chinese volunteers. Chromatographia 2007;65:737-41.
- Tsuji A, Terasaki T, Takabatake Y, Tenda Y, Tamai I, Yamashima T, et al. P-glycoprotein as the drug efflux pump in primary cultured bovine brain capillary endothelial cells. Life Sci 1992;51:1427-37.
- Terao T, Hisanaga E, Sai Y, Tamai I, Tsuji A. Active secretion of drugs from the small intestinal epithelium in rats by P-glycoprotein functioning as an absorption barrier. J Pharm Pharmacol 1996;48:1083-9.
- Lau YY, Okochi H, Huang Y, Benet LZ. Pharmacokinetics of atorvastatin and its hydroxyl metabolites in rats and the effects of concomitant rifampicin single doses: relevance of First-pass effect from hepatic uptake transporters,and intestinal and hepatic metabolism. Drug Metab Dispos 2006;34:1175-81.
- Neuvonen PJ, Niemi M, Backman JT. Drug interactions with lipid-lowering drugs: mechanisms and clinical relevance. Clin Pharmacol Ther 2006;80:565-81.
- Saito M, Hirata-Koizumi M, Miyake S, Hasegawa R. Withdrawal of cerivastatin revealed a flaw of post-marketing surveillance system in the United States. Kokuritsu Iyakuhin Shokuhin Eisei Kenkyusho Hokoku 2005;123:41-5.
- Dresser GK, Spence JD, Bailey DG. Pharmacokinetic-pharmacodynamic consequences and clinical relevance of cytochrome P450 3A4 inhibition. Clin Pharmacokinet 2000;38:41-57.
- Williams D, Feely J. Pharmacokinetic-pharmacodynamic drug interactions with HMG-CoA reductase inhibitors. Clin Pharmacokinet 2002;415:343-70.
- Jacobson TA. Comparative pharmacokinetic interaction profiles of pravastatin, simvastatin, and atorvastatin when coadministered with cytochrome P450 inhibitors. Am J Cardiol 2004;94:1140-6.
- Molden E, Asberg A. Metabolic interactions with statins. Tidsskr Nor Laegeforen 2001;121:189-93.
- Igel M, Sudhop T, von Bergmann K. Metabolism and drug interactions of 3–hydroxyl-3-methylglutaryl coenzyme A-reductase inhibitors (statins). Eur J Clin Pharmacol 2001;57:357-64.
- Maltz HC, Balog DL, Cheigh JS. Rhabdomyolysis associated with concomitant use of atorvastatin and cyclosporine. Ann Pharmacother 1999;33:1176-9.
- Hermann M, Asberg A, Christensen H, Holdaas H, Hartmann A, Reubsaet JL. Substantially elevated levels of atorvastatin and metabolites in cyclosporine-treated renal transplant recipients. Clin Pharmacol Ther 2004;76:388-91.
- Launay-Vacher V, Izzedine H, Deray G. Statins’ dosage in patients with renal failure and cyclosporine drug–drug interactions in transplant recipient patients. Int J Cardiol 2005;101:9-17.