
Discrimination analysis of mass spectrometry proteomics for ovarian cancer detection1
Introduction
Ovarian cancer is the leading cause of death from gynecological malignancies and is the fifth most common cancer in women. Currently, more than 80% of ovarian cancer patients are diagnosed at a late clinical stage when there is only a 20% chance of survival for up to 5 years. In contrast, the 20% of women diagnosed with early-stage disease have an excellent prognosis, with over 95% living longer than 5 years after their diagnosis. It is encouraging to correctly identify the ovarian cancer disease while it is still in stage I. The current biomarker repertoire cannot detect treatable early-stage cancer and often classifies it as the common benign condition. With the urgent need for better diagnosis, it is unfortunate that the number of new markers submitted for regulatory approval has virtually dried up.
The cellular abundance of tens of thousands of different proteins, along with their cleaved or modified forms, is a reflection of ongoing physiological and pathological events. The biomolecules in the cancer state may exhibit a series of particular activities related to cancer development on proteomics. The degradation and cleavage of the proteins can generate fragments small enough to enter the blood passively, producing diagnostic traces in the blood. Thus the low molecular weight (LMW) region of the blood, which is a mixture of small intact proteins plus fragments of the large proteins, represents all classes of proteins[1–5].
Mass spectrometry (MS) provides high-resolution mass information for lower weight proteins. It is a powerful tool for determining the masses of biomolecular fragments present in complex samples[6–9]. A mass spectrum consists of a set of mass-to-charge (m/z) values and corresponding relative intensities that are a function of all ionized molecules present with the m/z ratio. MS proteomics generate the lists of proteins that increase or decrease in expression as a cause or consequence of pathology and the proteomic signatures to characterize the pattern diagnostics for the early detection of cancer. Therefore, serum proteomics from MS data would show a diagnostic classifier through testing for the presence or absence of the molecules and their abundance. Surface-enhanced laser desorption ionization–time of flight (SELDI–TOF) and matrix-assisted laser desorption ionization (MALDI) MS are the two most popular approaches presently employed for detecting quantitative or qualitative changes in circulating serum or plasma proteins in relation to the presence of cancer[6]. In SELDI, the proteins of interest from biologically-complex samples bind selectively to chemically-modified affinity surfaces, with non-specifically-bound impurities washed away. The retained sample is complexed with an energy-absorbing molecule and analyzed by laser desorption ionization TOF MS, producing spectra of the m/z ratio[10]. MALDI is similar to SELDI except that it does not have the preselection or enrichment steps for certain proteins in the sample mixture by allowing fractionation based on prebinding to different surfaces or chemical coatings. In MALDI, the samples are mixed with a crystal forming matrix, placed on an inert metal target, and subjected to a pulsed laser beam to produce gas phase ions that traverse a field-free flight tube. The samples are then separated by mass/charge ratio[7,8,10,11].
Since MS spectra contain a huge number of peaks reflecting the large amount of protein fragments in the sample, a manual inspection or a simple comparison to distinguish between healthy or cancerous conditions from the spectral differences is impractical. The discrimination of 1 physical condition from another by comparing their mass spectra has been used in a previous study by Petricoin et al[12]. Petricoin et al used a bioinformatics approach on the raw mass spectra (OC-H4) related to ovarian cancer to differentiate between cancerous and non-cancerous patients. The data consisted of 218 serum spectra from 100 ovarian cancer patients and 118 non-cancer patients. The preliminary training set of spectra derived from 50 unaffected women, and 50 patients with ovarian cancer were analyzed by an iterative artificial intelligence algorithm. The discovered pattern was then used to classify the rest of 116 independent masked serum samples: 50 from women with ovarian cancer, and 66 from unaffected women or those with non-malignant disorders.
The discovered pattern correctly identified all 50 ovarian cancer cases in the masked set, including all 18 stage I cases. Of the 66 cases of non-malignant disease, 47 were recognized as not cancer, and 17 were not matched. Petricoin and coworkers recently created 2 additional ovarian data sets using other processes, which are available from the NIH and FDA Clinical Proteomics Program[13].
In this paper we propose a novel algorithm for the pattern classification of healthy versus cancer from protein mass spectra. This is archived through the building of an optimal linear discriminant by maximizing the across-class variance while minimizing the within-class variance. It is capable of classifying the state of healthy versus disease from human serum mass spectra. The factors that may potentially affect the classification are also investigated.
Materials and methods
Sample sources Two ovarian SELD–TOF mass spectra data sets were obtained from the NIH and FDA Clinical Proteomics Program (http://home.ccr.cancer.gov/ncifdaproteomics/ppatterns.asp). They were created through weak cation exchange chips, and named as OC-WCX2a and OC-WCX2b. OC-WCX2a used the same samples as OC-H4 (through hydrophobic chips) reported in Petricoin et al’s study[12]. OC-WCX2a samples were processed by hand, while OC-WCX2b was generated through robotic sample handling (eg washing and incubation) and from the upgraded PBSII SELDI-TOF mass spectrometer (Ciphergen, Freemont, CA, USA).
The healthy samples in OC-WCX2a came from women at risk for ovarian cancer, while the ovarian cancer-positive samples came from women with tumors spanning all major epithelial subtypes and stages of disease. Gold standards were used for the definitive diagnosis obtained by biopsy, surgery, autopsy, long-term follow up, or other acknowledged standard. Each spectrum in these data sets is contained in the individual file and is separated into the healthy or disease state. These data files are in either comma-delimited or Microsoft Excel (Seattle, WA USA) format.
In OC-WCX2a, the median age was 49 years (range 21–75). On the basis of age distribution, premenopausal and postmenopausal women were equally represented in the training and test groups, thus menopausal status should not have been a discriminator in the analysis. The OC-WCX2b sample set included 253 patients (91 controls and 162 patients with ovarian cancers). The ranges of the ages of patients varied substantially (cases=32−78 years; controls=23−83 years). OC-WCX2a was sampled at 15154 m/z values over the range 0–20000, while the spectral points of OC-WCX2b were up to16 382 m/z values.
Principles and methods The classificatory discriminant analysis is generally used to classify observations into two or more known groups on the basis of the observation value features. Euclidean distance is used to determine the proximity. A linear classifier achieves this by making a classification decision based on the value of the linear combination of the features. The linear discriminant analysis (LDA) is used in statistics to find the linear combination of features which best separate two or more classes of objects or events. The resulting combinations may be used as a linear classifier, or more commonly in dimensionality reduction (preselection) before later classification. LDA explicitly attempts to model the difference between the classes of data. There are two classes for LDA in our case. Consider a set of observations (x; MS peak measurements) for each sample with known class (y; cancerous or not). This set of samples is called the training or calibration data set. The classification problem is then to find a good predictor for the class y of any sample of the same distribution (not necessarily from the training set) given only an observation x. LDA approaches the problem by assuming that the probability density functions and are both normally distributed. Under this assumption, the Bayes’ optimal solution is to predict points as being from the second class if the likelihood ratio is below threshold T, so that
If we make the simplifying homoscedastic assumption (ie that the class covariances are identical), then several terms cancel and the above decision criterion becomes a threshold on the scalar product (the standard inner product of the Euclidean space),, for some constant c, where
This means that the probability of an input x being in a class y is purely a function of this linear combination of the known observations. For a set of mass spectral peaks and a classification variable defining their groups, we can develop a discriminant criterion using a measure of generalized squared distance to classify each sample profile into one of the groups. The derived discriminant criterion then can be applied to a second new test data set.
The performance of a discriminant function can be diagnosed by estimating error rates. The error rates are from the resubstitution or cross-validation results. Resubstitution classification puts each observation into the established model to summarize the misclassified rate. Cross-validation treats n-1 out of n training samples as a training set. It determines the discriminant functions based on these n-1 observations and then applies them to classify the one sample left out. This is done for each of the n samples. The overall misclassification rate for each group is the proportion of samples in that group that are misclassified. This method achieves a nearly unbiased estimate, but with a relatively large variance. To demonstrate the accuracy and robustness of the method, samples are split into training and test data sets. The use of a test set allows one to confirm that the discriminant has not been over fit to the training data. If the discriminant has been over fit to the training spectra then one would expect excellent performance in the classification of the training spectra, but poor performance in the classification of the test spectra. We have designed and implemented the method by SAS (SAS/STAT, version 9; SAS Institute, Cary, NC, USA) to derive the discriminant functions and then classify complex samples from MS data.
Procedures
Baseline subtraction and intensity normalization Sample classification from proteomic data is often difficult because the signal intensity for each m/z point can be affected by both biological processes and experimental condition variabilities, as bias introduced by sample nature, chemical reagents, protein chip quality, mass spectrometer instrumentation, and operator variance can effect overall spectral performance. The preprocessing steps of MS output are critical for the overall analysis of proteomic data and pattern recognition. Each mass spectrum exhibits a base intensity level (a baseline) that varies across the m/z axis, and generally varies across different fractions. When the baseline is subtracted, the results in some m/z peaks may have negative relative intensities.
The absolute peak intensities may not be comparable across different samples. This motivates the need for a normalization scheme which ultimately enables the comparison of the peak profiles. A number of choices of normalization are available. After experimental computation, we chose to normalize with respect to the maximum intensity in the sample value within the randomly-generated subset. The processed intensities could be interpreted over a uniform range across fractions and samples. In this way, differences in spectral quality that can emanate from biases, such as protein chip variance, and not from the inherent disease process itself can be minimized. Also, this method allows for low-amplitude features to contribute substantially to the classification. The spectra are normalized according to the formula:
NV=(V–Min)/(Max–Min) (1)
where NV is the normalized value, V is the intensity value, Min is the intensity of the smallest intensity value, and Max is the maximum intensity of the m/z bin within the randomly-selected pattern. This equation linearly normalizes the peak intensities so as to fall within the range 0–1.
Peak cluster and alignment across samples Complex fragment mixtures produce a commensurate number of m/z peaks from 0 up to the upper limit of detection. It has been found that no peaks occurred in exactly the same location across all spectra. This is not surprising since there can be considerable spatial variability due to the instrument (instrument error is 0.2%*m/z) and intra- and inter-patient variability. In addition, a particular m/z peak may consist of many subpeaks from different molecular fragments.
In order to make the peak profiles comparable across different samples, we need to cluster and align the same biological peak that might be horizontally shifted in different spectra and reset them into one common set of peak locations across all of the samples.
Visual examination of the individual spectra showed that the peaks are not evenly distributed over the entire m/z range. The number of peaks approximately decreases as the m/z ratio increases. The misclassification result showed that peak clustering based on a fixed space was not feasible. Bin processing would be a good choice. For each spectrum, the horizontal axis (m/z) is divided into bins of equal numbers of nearest neighbors (or more advance approaches using spatially-adapted bins). The m/z values within a given bin are replaced with the midpoint, and the corresponding expression intensities are replaced with the maximum expression values across that bin. This approach has two strong benefits: to yield good peak calibrations, and logically reduce the dimension of the data. This enables us to maximally discriminate between the healthy and normal samples in the training set.
Step-peak selection The majority of the peaks are not helpful in classifications. Another limitation is the near singularity of the covariance matrices when the number of peaks used for the classification is too large. The detectable peaks in the spectra can be selected from the initial analysis by the measure of discriminatory power for all peaks. The peaks with discriminative information are more likely to represent individual proteins, protein fragments, or peptides.
In this peak-reduction procedure, the peaks are ordered according to their information content as measured by the F-statistics. This is equivalent to computing the ratio of variances of peak intensities between and within the two groups (B/W ratio) and sorting in decreasing order. We subsequently experimented with stepwise discriminant analysis to select a subset of the peaks for use in discriminating among the classes. The peaks are chosen to enter the model according to the significance level of an F-test statistics. In most cases, any peaks are considered have some discriminatory power however small. In order to prevent any peaks, including those that do not contribute to the discriminatory power of the model in the population, a small significance level should be specified. Peak selection simultaneously reduces the dimension of the data and preserves the ability to discriminate one class from another, thus providing the best discriminators using the sample estimates.
Discrimination modeling and diagnosis The classification methods have been explored using the statistical tools as follows: linear discrimination, quadratic discrimination, non-parametric discrimination (kernel, k-nearest neighbor classification, and Mahalanobis distance) and linear support vector machines. The entire scheme was implemented with SAS.
When a set of MS training spectra is input, it outputs a discriminant classifier capable of classifying new mass spectra into one of the classes. The model is diagnosed in terms of misclassification by resubstitution and cross-validation.
Training/test-split validation The utility of proteomics patterns is highly dependent upon the level of the inherent sensitivity, specificity, and positive predictive value (PPV). Test data are used to determine the correct classification based on the classifier constructed from the training set and to ensure the power and quality of the methods. Sensitivity (true positive rate) is probability that an individual with the disease will have a positive test. Sensitivity measures the proportion of people with the disease that test positive, while specificity (true negative rate) is the probability that an individual without the disease will have a negative test. Specificity measures the proportion of the people without the disease who test negative. PPV is the probability that an individual with a positive test will have the disease. (Given a positive test, what is the probability of having the disease). PPV measures the proportion of patients with the disease out of all patients testing positive.
In the data-split method, the input data set is split into a training set (70%), which is given to the classification method in order to build the model, and a test set (30%), which is used to assess the quality of the model. Consequently, one would expect the second validation test to be more stringent and to predict higher and more realistic error rates.
Results
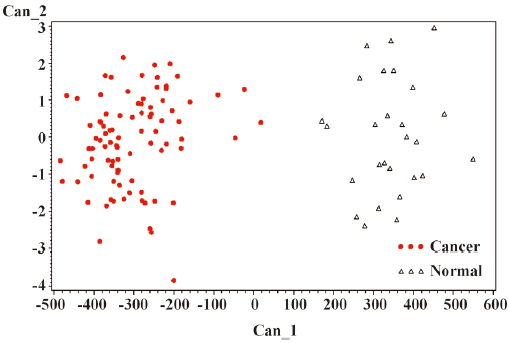
The general strategy of the proteomics program is to create recognition patterns from the spectral differences of protein fragments (Figure 1) to distinguish cancer patients versus healthy controls (Figure 2). The first two canonical coefficients of Can-1 and Can-2 in Figure 2 show that the classes differ most widely on the linear combination of the mass peaks.
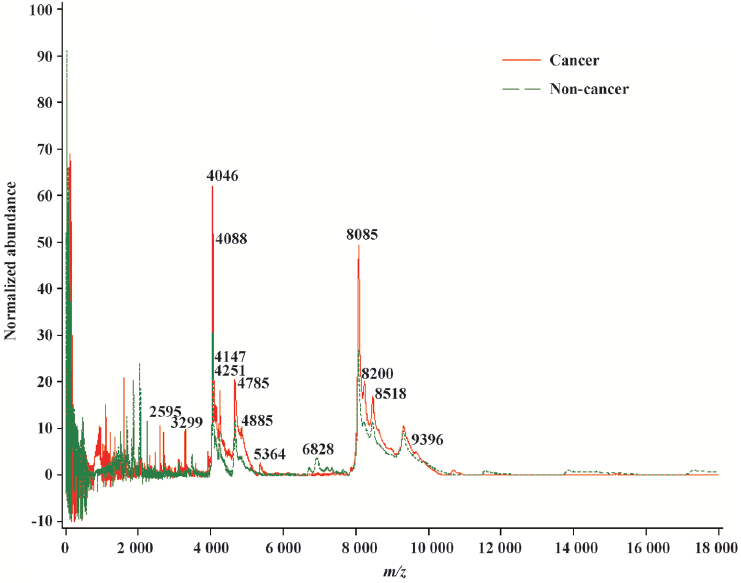
The optimal discriminatory pattern is identified from the best combination of m/z bins consisting of the unique cluster of classifiers.
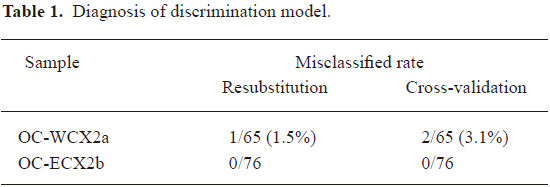
The misclassified rate in Table 1 confirms that the discrimination model established is valid and reliable. To confirm the accuracy, the blinding test data are used for determining the ability to distinguish between those with the disease and those without the disease in terms of sensitivity, specificity, and the PPV of the patterns. The consistently high level of performance on the testing spectra demonstrates that it was not over fit to the training spectra.
Full table
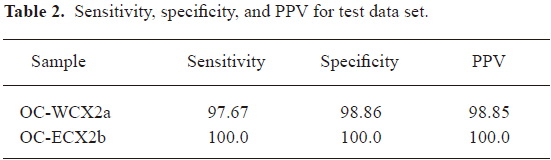
A classification from training/test-data split allows 30% classification of the OC-WCX2a samples with a sensitivity of 97.67%, a specificity of 98.86%, and PPV of 98.85%. A good performance was achieved on the OC-WCX2b data set. The classification was perfect, that is, the test samples were classified with a sensitivity of 100%, a specificity of 100%, and a PPV of 100% (Table 2).
Full table
The intrinsic person-to-person variability of the content of biofluids, the variances in sample processes, and instrumental operations makes the recognition pattern in the background of a dynamic proteome extremely challenging. Tests results are dichotomized (cancer or healthy), but diseases often present in gradations of severity. Spectrum changes in disease severity however can change sensitivity and specificity. If the sample spectrum discriminant space is nearly equidistant to two class means, it is an ambiguous spectrum. The classification for the ambiguous spectrum is not likely constant on some classifiers. In more severe disease, the sensitivity goes up and it seems more likely to be able to make a good diagnosis. In cases where a disease is suspected when there is no disease present (such as benign ovarian cancer or non-gynecological inflammatory disorder), the disease might be harder to be diagnosed correctly. In our study, the success in correctly diagnosing stage I ovarian cancer suggested that proteomics patterns generated from biofluids provided a useful indicator of the early onset of the disease. There are many premenopausal stage I cancers that are much younger than many of the postmenopausal controls in our study sets. Age is not a driver for classification since the premenopausal stage I cancers were classified correctly, as were all of the postmenopausal controls in the blinded testing. Sources of bias include sample handling differences between cases and controls, preparation and application of the laser desorption ionization matrix, and the use of different SELDI[13–15]. The spectrum quality typically varies with different samples, experimental formats, instruments, and laboratories[16]. Ongoing work is been conducted in an effort to understand the incorrect classifications due to the ambiguous spectra. Recently, attempts have been made to assess the spectral quality to determine weather a spectrum is a likely candidate for further analysis[17,18]. In addition, the combination of the proteomic approach with other methods of ovarian cancer diagnosis, such as cancer antigen (CA-125) for ovarian cancer and ultrasound, molecular fingerprints, or a histopathological assessment can further improve the precision.
We have discussed in detail the steps in preprocessing the mass spectral data for pattern discovery, as well as our criterion for choosing a small set of peaks for classifying samples. The information that is critical for building models with strong prediction capabilities should be retained. With more experience, the preprocessing methods will improve in sophistication and robustness.
The field of clinical chemistry has not yet established a thorough knowledge base of the compendium of molecular entities that exist in serum or plasma in the LMW range[1]. At this time, there is no complete list of all of the peptides and molecules that are normally found in the circulation of humans. Organic metabolites, lipids (such as lysophosphatidic acid or LPA), small peptides, and protein fragments are all analyzed by laser desorption ionization–TOF MS.
Discussion
Serum samples were obtained before examination, diagnosis, or treatment, and were immediately frozen in liquid nitrogen. At the laboratory, the samples were thawed and separated into 10 µL portions. The separated serum was applied to the surface of a protein-binding chip, and washed with pH-adjusted buffer. The bound proteins were then treated with a MALDI matrix, washed, and dried. The chip, containing multiple patient samples, was inserted into a vacuum chamber where it would be irradiated with a laser. The laser desorbed the adherent proteins, causing them to be launched as ions. The TOF of the ion before detection by an electrode is a measure of the m/z value of the ion.
Mathematical patterns do not necessarily determine the identity of the proteins that prove to be useful to detect early disease or response to treatment. Many of these proteins can be identified lead to an understanding of the molecular pathways involved in disease states. Besides ovarian cancer, similar techniques are being applied to other cancers. Researchers are looking for protein patterns in the blood that are diagnostic for early-stage aggressive prostate, lung, and breast cancers, as well as patterns that can predict the risk for prostate, colon, skin, and pancreatic cancers. To identify the molecules of the differentially-expressed proteins most important in discrimination, it would be interesting in future work to take advantage of the additional information experimentally-available from controlled proteolytic digests or MS/MS. A peptide’s sequence is directly identified by MS/MS, or tandem MS is applied to a proteolytic digest of the target proteins after these fragments have been separated via chromatography (eg liquid chromatography MS). The work is yielding new insights about which molecular pathways are altered in tumor development.
In order for laser desorption ionization–TOF MS profiling to become a clinically-reliable tool, it must undergo validation. The validation of discriminatory peaks in the mass spectra should include statistically–powered independent testing and validation sets that include large numbers of inflammatory controls, benign disorders, and healthy controls, as well as other cancers. Quality control and reference materials for SELDI or MALDI–TOF MS should be developed and used more widely to monitor and improve method reliability. Standardized protocols should be developed for sample collection, handling, and processing to avoid or reduce bias.
The use of a higher resolution mass spectrometer has demonstrated that high-resolution spectrometry affords the best spectral reproducibility over time, can produce accurate mass tagging, as well as overall superior clinical accuracy. Plans are also in place to gain early access to the latest generation and most sensitive MS instrument, the Fourier transform ion cyclotron resonance MS, which will be used for the detection of low-abundance proteins and their post-translational modifications in tissues and biological fluids. The instrumentation is capable of both high-throughput and complete protein characterization. This throughput allows for key discriminatory features (key m/z values) to be distinguished within hundreds of serum or plasma samples to detect diseases, such as cancer at earlier stages, to enable more effective medical intervention.
Proteomics approaches, such as the use of a SELDI mass spectrometer in conjunction with LDA, could greatly facilitate the diagnosis pattern of ovarian cancer. The mathematical principles and computations in our method are different from the previously-reported bioinformatics tools. The results from same samples with different methods can be used for comparison. Our mathematical model is quite flexible in that it allows putting risk factors of ovarian cancer into the model for strata analysis. The high sensitivity and specificity archieved by our method shows great potential for the early detection of ovarian cancer.
References
- Liotta LA, Ferrari M, Petricoin E. Clinical proteomics: written in blood. Nature 2003;425:905.
- Rai AJ, Chan DW. Cancer proteomics: Serum diagnostics for tumor marker discovery. Ann N Y Acad Sci 2004;1022:286-94.
- Diamandis EP. Analysis of serum proteomic patterns for early cancer diagnosis: Drawing attention to potential problems. J Natl Cancer Inst 2004;96:353-6.
- Ransohoff DF. Lessons from controversy: ovarian cancer screening and serum proteomics. J Natl Cancer Inst 2005;97:315-9.
- Colantonio DA, Chan DW. The clinical application of proteomics. Clin Chim Acta 2005;357:151-8.
- Diamandis EP. Mass spectrometry as a diagnostic and a cancer biomarker discovery tool: opportunities and potential limitations. Mol Cell Proteomics 2004;3:367-78.
- Aebersold R., Mann M. Mass spectrometry-based proteomics. Nature 2003;422:198-207.
- Pusch W, Flocco MT, Leung S, Thiele H, Kostrzewa M. Mass spectrometry-based clinical proteomics. Pharmacogenomics 2003;4:463-76.
- Diamandis EP, van der Merwe D. Plasma protein profiling by mass spectrometry for cancer diagnosis: Opportunities and limitations. Clin Cancer Res 2005;11:963-5.
- Soltys SG, Le QT, Shi G, Tibshirani R, Giaccia AJ, Koong AC. The use of plasma surface-enhanced laser desorption/ionization time-of-flight mass spectrometry proteomic patterns for detection of head and neck squamous cell cancers. Clin Cancer Res 2004;10:4806-12.
- Gramolini AO, Peterman SM, Kislinger T. Mass spectrometry-based proteomics: a useful tool for biomarker discovery? Clin Pharmacol Ther 2008;83:758-60.
- Petricoin E III, Ardekani A, Hitt B, Levine P, Fusaro V, Steinberg S, et al. Use of proteomic patterns in serum to identify ovarian cancer. The Lancet 2002;359:572-7.
- Banks RE, Stanley AJ, Cairns DA, Barrett JH, Clarke P, Thompson D, et al. Influences of blood sample processing on low-molecular-weight proteome identified by surface-enhanced laser desorption/ionization mass spectrometry. Clin Chem 2005;51:1637-49.
- Baggerly KA, Morris JS, Edmonson SR, Coombes KR. Signal in noise: evaluating reported reproducibility of serum proteomic tests for ovarian cancer. J Nat Cancer Inst 2005;97:307-9.
- Ransohoff DF. Bias as a threat to the validity of cancer molecular-marker research. Nat Rev Cancer 2005;5:142-9.
- White CN, Zhang Z, Chan DW. Quality control for SELDI analysis. Clin Chem Lab Med 2005;43:125-6.
- Wong JW, Sullivan MJ, Cartwright HM, Cagney G. msmsEval: tandem mass spectral quality assignment for high-throughput proteomics. BMC Bioinformatics 2007;8:51.
- Flikka K, Martens L, Vandekerckhovel J, Gevaert K, Eidhammer I. Improving the reliability and throughput of mass spectrometry-based proteomics by spectrum quality filtering. Proteomics 2006;6:2086-94.