
Pharmacokinetic and pharmacodynamic study of LFA3Ig fusion protein in healthy volunteers and patients with psoriasis1
Introduction
Psoriasis, a recognized T-cell-mediated immune disorder, is characterized by infiltration of activated memory T cells into lesion skin that stimulates hyperproliferation of keratinocytes and results in the development of red, raised, and scaly plaques[1–3]. The activation of memory T cells is critical for mounting an effective immune response in the skin. The expression of CD2 is increased on activated memory T cells compared with naive T cells[4]. The interaction of CD2 with its ligand LFA-3 augments T-cell responses by increasing the adhesion of lymphocytes to antigen-presenting cells and by triggering CD2-mediated signals[5,6]. Thus to block the CD2–LFA-3 costimulating signal has become a novel strategy to treat psoriasis. New biological agents that are being developed to target this signal pathway include alefacept and siplizumab. Alefacept, a fully human LFA-3/immunoglobulin G (IgG)1 fusion protein, was designed to prevent the interaction between LFA-3 and CD2. It has been proven to be safe and effective, with a prolonged duration of off-treatment response in the treatment of chronic plaque psoriasis[7–9]. Siplizumab is a humanized antibody to CD2, and this agent has shown potent immunomodulatory effects, selectively suppressing the function of T and NK cells. It has also demonstrated clinical efficacy as a treatment for psoriasis[10].
LFA3IgFP is a human LFA-3/IgG1 fusion protein developed by the Shanghai Center for Cell Engineering and Antibody (Shanghai, China). Our previous in vitro study indicated that this fusion protein could interfere with the activation of T lymphocytes through specific binding with CD2 on the surface of T lymphocytes[11]. It was also demonstrated that the repeated administration of LFA3IgFP could induce a dose-dependent decrease in the numbers of the total circulating lymphocytes in cynomolgus monkeys. The present clinical trials attempted to determine the blood serum concentration of the fusion protein and to periodically monitor lymphocyte subsets, such as CD4+ and CD8+ cells by flow cytometry (FCM). The aim of this study was to reveal the pharmacokinetics (PK) and pharmacodynamics (PD) of LFA3IgFP in healthy adult volunteers and psoriatic patients, and these results would be useful in guiding the design of future phase II and phase III clinical trials.
Materials and methods
Drug nomenclature LFA3IgFP, which was provided by he Shanghai Center for Cell Engineering and Antibody (Clinical trial approval N
Study design and patients The study was designed as a single-center, open-label clinical trial. It was a safety and PK study, not an efficacy study. As this was a descriptive PK and tolerability study, the sample size was not based on statistical considerations.
Study 1 was an open-label dose escalation study in healthy volunteers. Twenty-four healthy volunteers were randomly (1:1:1) assigned to receive LFA3IgFP intramuscularly at a single-dose of 5, 15, or 25 mg; study 2 was a single group, multiple-dose, open-label study in patients with chronic plaque psoriasis. Twelve patients were administered LFA3IgFP intramuscularly at a dosage of 15 mg once a week for 8 weeks. Considering that liver and renal function and other disease states may affect the PK parameters and therapeutic outcomes, we selected healthy volunteers and patients strictly according to the eligibility/exclusion criteria. We excluded patients with hepatitis or renal disease or a history of cancer. Patients were also excluded if they had fever within 48 h before LFA3IgFP administration or suffered from a symptomatic viral or bacterial infection within 2 weeks before enrollment or with a history of an allergic reaction to the study medication or similar compounds. In study 2, patients eligible for enrollment were 18 years or older with moderate-to-severe chronic plaque psoriasis (body surface involvement >=10%, PASI >=12). They had previously received systemic treatment or phototherapy or were candidates for such treatment. To avoid potential interactions between LFA3IgFP and other prescription and non-prescription medication, the use of all prescription and non-prescription medications was prohibited within 1 week of enrollment.
All of the patients arrived at the study center 24 h before administration, and remained at the center for 48 h after administration. To assess the safety and effect of LFA3IgFP, physical examinations, including vital signs and clinical laboratory tests, were performed 12 h before receiving study medication. Biochemical and physical examinations were also monitored 15 and 50 d after administration in study 1, and 9 and 60 d after the last administration in study 2. Adverse events (AE) were monitored during the treatment and follow-up period. Blood was drawn 1 h before dosing for hematology and peripheral lymphocyte subsets. Volunteers were served a standard breakfast before receiving study medication.
The study was conducted in accordance with the revised Declaration of Helsinki and Good Clinical Practice Requirements. The study was also approved by the ethics committee of the First Affiliated Hospital of The Third Military Medical University. All of the patients signed informed consent forms before participating in the study.
Sample collection In study 1, venous blood samples for analysis of lymphocyte subsets and serum concentration were drawn before administration and at 2, 6, 12, 24, 36, and 48 h after administration. Additional samples were collected on d 3, 5, 7, 10, 15, 22, 29, 35, and 50. In total, 2 mL whole blood was drawn each time. In study 2, blood samples for the analysis were drawn before each administration at weeks 1, 2, 3, 4, 5, 6, 7, and 8, and 48 h after each administration at weeks 5, 6, 7, and 8. Samples were also obtained at 1, 3, 5, 9, 14, 44, and 60 d after the last administration. In total, 2 mL of whole blood was drawn each time. Samples for the analysis of lymphocyte subsets were drawn before administration and at 14, 35, 49, 63, and 109 d after the first administration. For each LFA3IgFP concentration sample, serum was harvested by means of centrifugation from 1.5 mL whole blood and stored at –20 °C. For each lymphocyte subset analysis, 0.5 mL whole blood sample was collected in anticoagulated tubes, and the samples had to be stained and detected by FCM within 24 h.
ELISA for LFA3IgFP levels Serum concentrations of LFA3IgFP were determined by ELISA using a murine anti-LFA3 monoclonal antibody (IC3; BD Biosciences, Category N
Data analysis The PK parameters were obtained using the Practical Pharmacokinetic Program 3p97 (version 97; Chinese Pharmacological Association, Beijing, China). Clearance rates (Cls/F), apparent volumes of distribution (Vd/F), elimination half-lives (T1/2ke) and areas under the concentration-time curves (AUC) were calculated by statistical moment theory using the trapezoidal rule in Micro Excel XP software. Maximum serum concentration values (Cmax) and the corresponding time (Tmax) were defined as observed. Continuous data were presented as mean±SD, median or range, and categorical data were presented as counts or percentages. Both serum concentrations of LFA3IgFP and lymphocyte subset proportions (%) were summarized for all patients at each time point.
Statistical analysis Statistical analyses were performed with a standard computerized statistical program, SPSS 13.0 for Windows software (SPSS, Chicago, IL, USA). All grouped data were expressed as mean±SD. ANOVA was used to test for differences among 3 groups when the data followed a normal distribution, while the Kruskal-Wallis test was used when the measurement variable did not meet the normality assumption of an ANOVA. For differences between 2 groups, if the t-test assumptions were met we used t-test, but if the t-test assumptions were not met we used the Wilcoxon test. A P-value <0.05 was considered to be statistically significant.
Results
Validity of the method for determination The pass/fail criteria for the assay were determined by the performance of QC in each assay. The results of the blank serum samples fortified with 100, 10, and 1 μg·L–1-tested LFA3IgFP showed that the recovery rates were 99.75%±2.09%, 10.09%±0.29%, and 1.02%±0.02%, respectively (n=5, parallel experiments). The coefficient of variation (CV%) of the intra assay was less than 11.5%, and the CV% of the inter assay was less than 16%. It is important to calculate the concentration in samples by the parameters obtained from the standard curve of the same microplate. The range of the serum concentration assay was 1–100 μg·L-1. In other words, the assay for determination had a lower limit of quantification (LOQ) of 1.0 μg·L–1 for LFA3IgFP, and we defined levels of LFA3IgFP that were not quantified as below the limit of quantification. Samples that returned values above the LOQ were diluted into the assay range with pooled normal human serum and tested repeatedly in the assay. When possible, these samples were diluted repeatedly, and repeated data were averaged with original data for a final concentration. The standard curve was obtained through logistic 4 parameter regression. The validity of the method depended on the determination of serum levels. Specificity, sensitivity, accuracy, and precision all met the requirements for the PK and PD study.
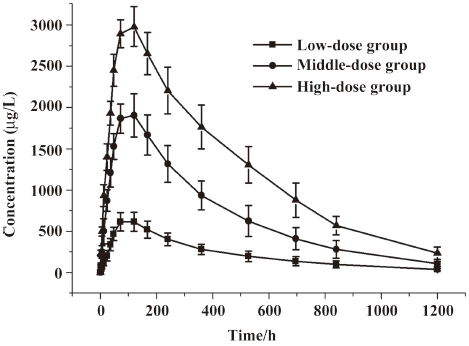
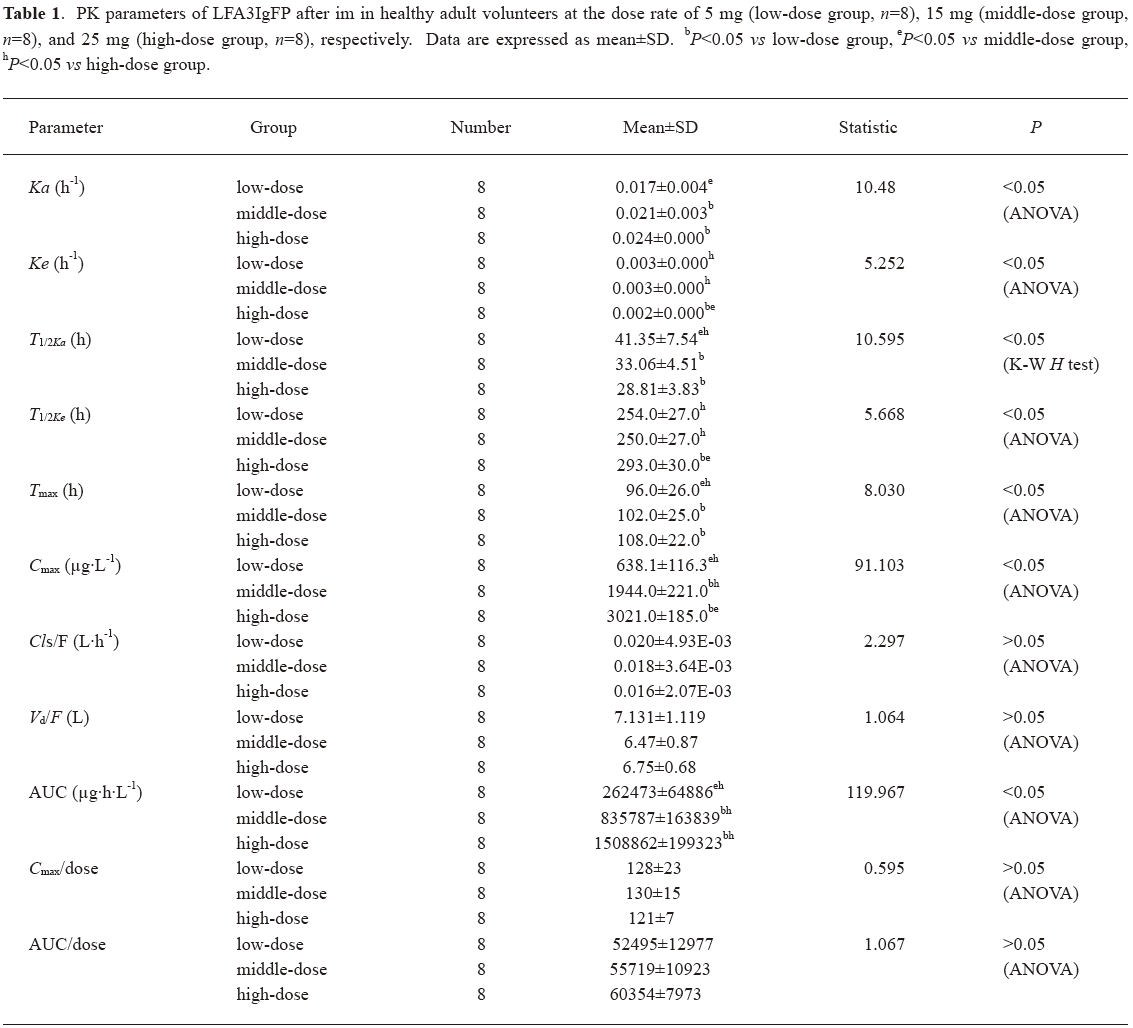
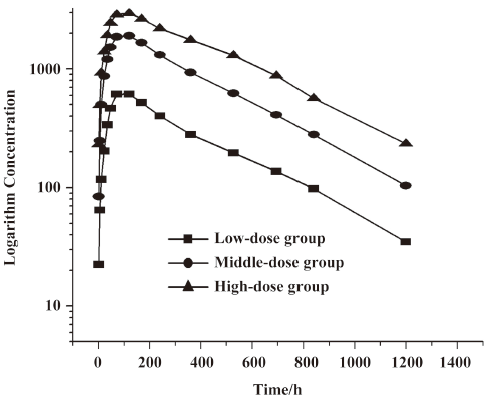
Concentration-time curves and PK after single dose of LFA3IgFP In study 1, a total of 384 samples from 24 healthy, adult male volunteers were collected for the LFA3IgFP concentration analysis, and no blood sample was missed. The ages of the 3 groups were 20.5±1.0 years, 22.0±2.0 years, and 23.3±2.1 years, and the weight of 3 groups were 60.9±3.8 kg, 56.7±3.2 kg, and 60.6±9.1 kg, respectively. The between-group demographic characteristics were of no clinical significant differences (P>0.05). Serum concentration-time profiles of LFA3IgFP following intramuscular (im) administration at doses of 5, 15, and 25 mg best fitted to a 1 compartment open model (Figure 1). There were significant differences among the 3 dose groups in some parameters, such as the absorption half-life (T1/2ka), T1/2ke, peak concentration (Cmax), and AUC. The mean LFA3IgFP Cmax was 638±116 μg·L–1, 1944±221 μg·L-1, and 3021±185 μg·L-1, respectively (Table 1). Concentrations of LFA3IgFP were slowly increased after im administration with T1/2ka at 41.3±7.5 h, 33.1±4.5 h, and 28.8±3.8 h (P=0.01<0.05, Wilcoxon test) in the 3 groups, respectively. T1/2ke were 254±27 h, 250±27 h, and 293±30 h, respectively. At the high-dose group (25 mg group), the value of T1/2ke was prolonged slightly and the difference was statistically significant (P=0.005<0.05, Kruskal-Wallis H-test). In study 1, the AUC was area under the concentration-time curve from 0 to 1200 h after administration and was defined as AUC0–1200. Along with the dose increase, the AUC0–1200 of the 3 groups was 262473±64886 μg·h·L-1, 835787±163829 μg·h·L-1, and 1508862±199323 μg·h·L-1 (P<0.05, Kruskal-Wallis H-test), respectively. With a dose ratio of 1:3:5, the ratio of the AUC among the 3 groups was 1:3.2:5.8. Despite the increase in AUC, the Cls/F among them were of no significant difference (ANOVA, P=0.125>0.05, Table 1). The Cmax/doses of the 3 groups were (128±23)×10-3 L-1, (130±15)×10-3 L-1, and (121±7)×10-3 L-1 (ANOVA, P=0.481>0.05; Table 1). The AUC/doses of the 3 groups were (52495±12977)×10-3 h·L-1, (55719±10923)×10-3 h·L-1, and (60354±7973)×10-3 h·L-1, respectively (ANOVA, P=0.362>0.05; Table 1), indicating that the PK behavior of LFA3IgFP within the examined dose range was of linear profile.
Full table
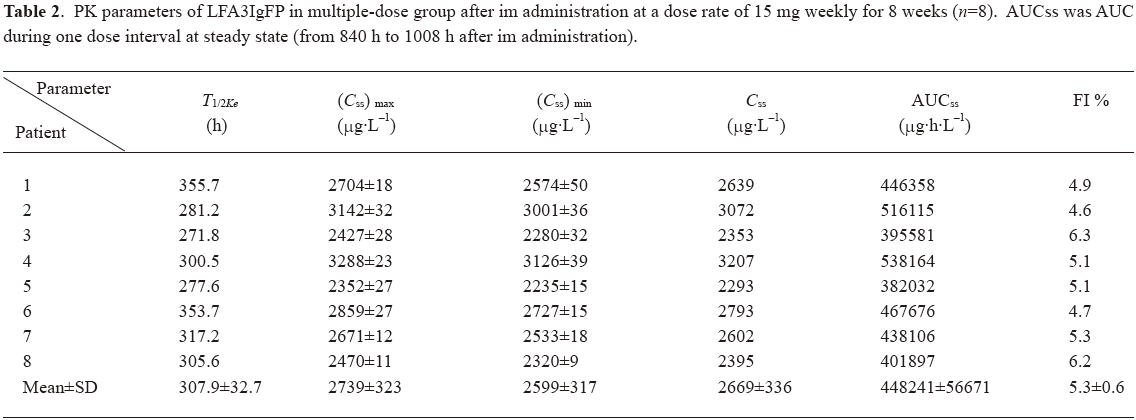
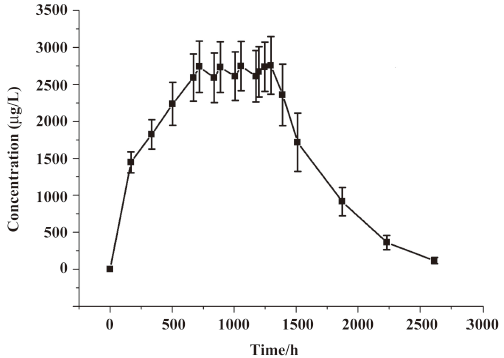
Concentration-time curves and PK after multiple dosing In study 2, we recruited 12 patients for the multiple dose administration study. Four patients were rejected because not all of their blood samples were collected. Thus only 8 patients (5 males and 3 females) were selected for the statistics. Their ages ranged from 18 to 49 years. The average weight was 57.5 kg. After repeated im administration of LFA3IgFP for an 8 week period at a dosage of 15 mg weekly, blood samples from the 8 patients were collected for the LFA3IgFP concentration analysis, with six samples out of a total of 152 were missed due to sample transporting damage or the absence of complete blood cell, which resulted in a 96% recovery rate. The steady state was achieved after the fifth im administration (week 5), based on the similarity of peak concentrations on week 5, 6, 7, and 8. The maximum steady state concentration (Css max) and the minimum steady state concentration (Css min) were 2739±323 μg·L-1 and 2599±317 μg·L-1, respectively. The mean AUC during a dosing interval at steady state (AUCss) was 448241±56671 μg·h·L-1, and the mean fluctuation index at the steady state was 5.3%±0.6% (Table 2).
Full table
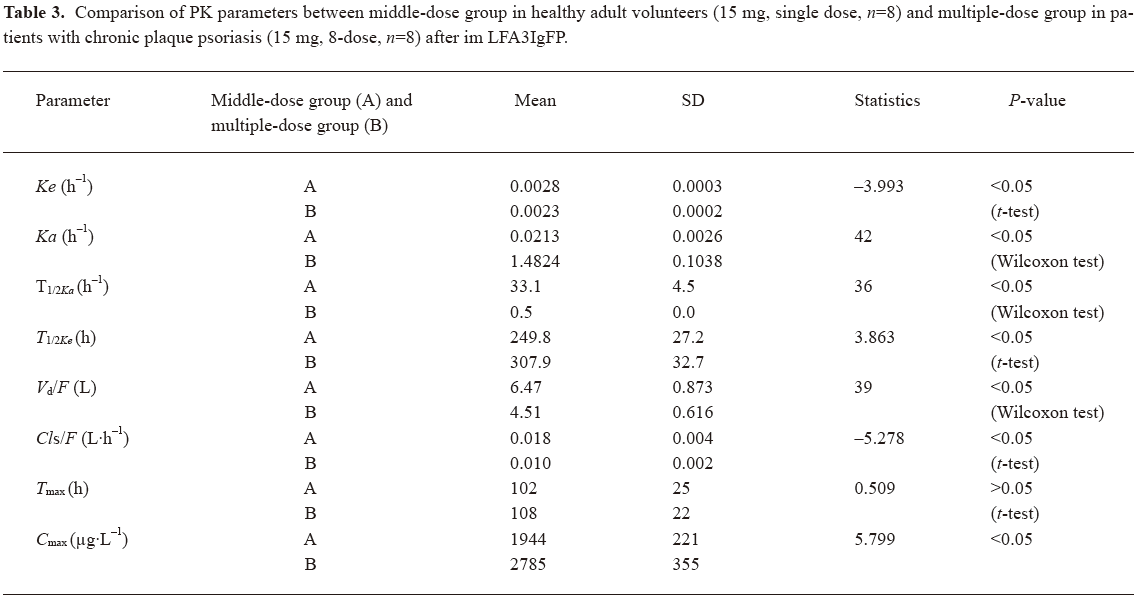
Compared with the 15 mg single-dose administration, the multiple-dose group administration showed a significantly increased absorption (Ka, P<0.05, Wilcoxon test) and a decreased clearence (Ke, P<0.05, Student’s t-test), resulting in a shorter T1/2ka (P<0.05, Wilcoxon test) and a longer T1/2ke (P<0.05, Student’s t-test; Table 3). The difference may be due to the disordered immune systems in plaque psoriatic patients. Cmax (2785 μg·L-1) after the multiple dose was slightly higher than that of the single 15 mg dose (1944 μg·L-1), indicating that LFA3IgFP had a tendency to accumulate in the body after successive im administration at a dosage of 15 mg once a week for 8 weeks (Table 3). The accumulation factor (R=steady state AUC(0–168)/single dose AUC(0–168)) was 3.5.
Full table
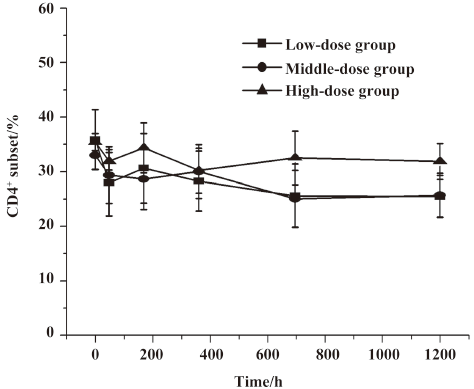
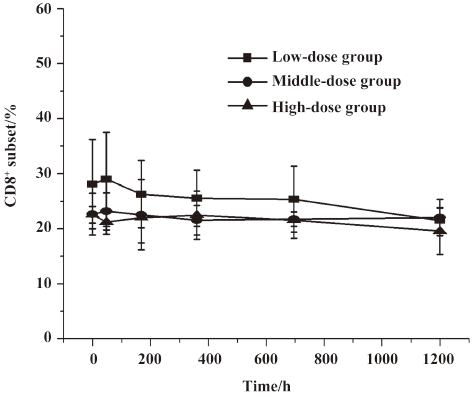
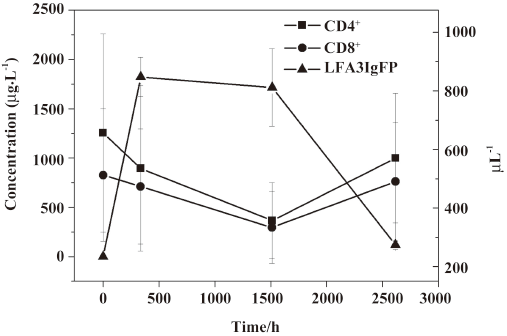
Lymphocyte subset proportions Peripheral lymphocyte subsets were analyzed in all 24 healthy volunteers and 8 patients with chronic plaque psoriasis. Blood samples for the analysis of lymphocyte subsets were drawn at the same time with those for the serum concentration assay. For each lymphocyte subset, the maximal percentage decline from baseline and time of maximal decline were determined. In study 1, a decrease in CD4+ lymphocyte subset was observed in 20 out of 24 volunteers (83.3%) within 2 d after administration, and a decrease in the CD8+ lymphocyte subset was found in 13 (54.2%) patients, but these changes were transient for a subsequent increase toward baseline which occurred in all healthy patients approximately 7 d after im administration (Figures 2,3,4,5). In study 2, a maximum reduction in CD4+ lymphocyte subset (decrease to 54.4% from baseline) was observed at d 63 after the first administration (Student’s t-test, P<0.01; Figure 6), and a maximum decrease in CD8+ lymphocyte subset (decrease to 63.8% from baseline) was also observed at the same time (Student’s t-test, P<0.01; Figure 6). The decrease could possibly be more significant with more doses (>8 doses). These lymphocyte counts increased toward baseline in all patients at approximately d 60 after the last dose (Student’s t-test, P<0.05; Figure 7).
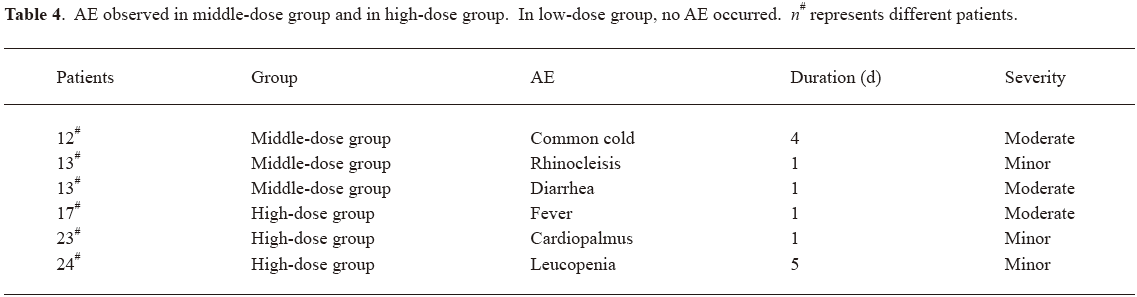
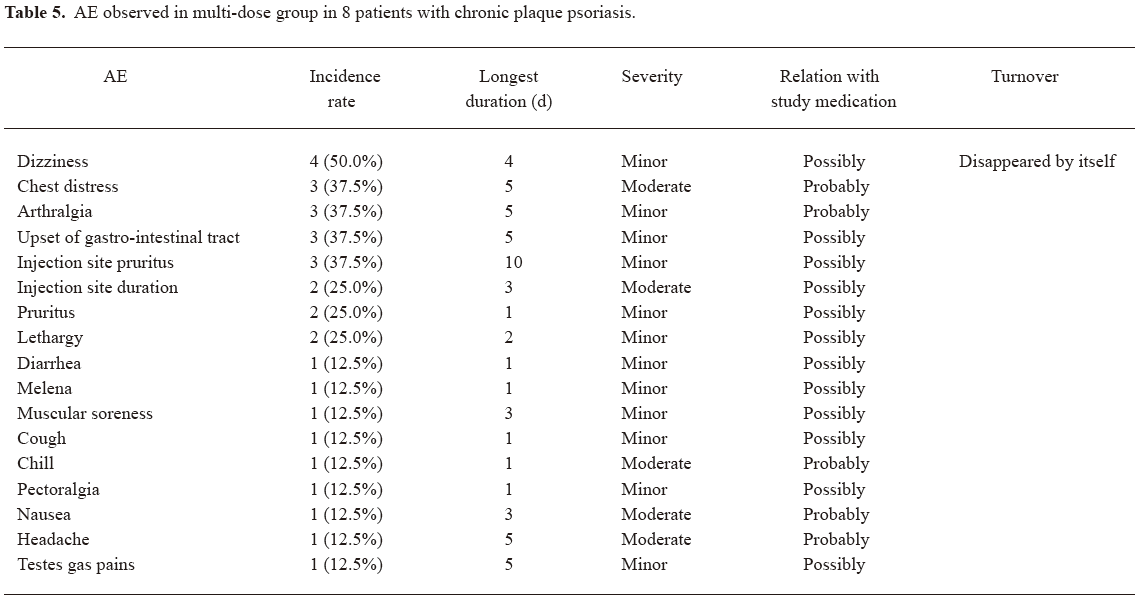
Safety and tolerability LFA3IgFP im administration was well tolerated. There appeared to be a dose-related increase in the occurrence of AE. In other words, AE were observed more often in the middle-dose group and the high-dose group. In the middle-dose group, 2 (25%) out of 8 patients experienced 1 or more AE, while in the high-dose group, 3 (37.5%) out of 8 patients experienced 1 or more AE; however, in the low-dose group, no AE occurred. Meanwhile, 4 (50%) out of 8 patients experienced 1 or more AE in the multiple-dose group. The AE observed in study 1 were common cold, rhinocleisis, diarrhea, fever, cardiopalmus, and leucopenia. Most of these events were considered by the investigator to be related to LFA3IgFP. All of these events were mild or moderate in severity (Table 4). In the multiple-dose group, no serious adverse event (SAE) was experienced after LFA3IgFP im administration (Table 5). No patient was withdrawn owing to AE. No clinically important trends were observed in clinical laboratory evaluations, physical examinations, or vital signs.
Full table
Full table
Discussion
LFA3IgFP, made by the Shanghai Center for Cell Engineering and Antibody, is a dimeric fusion protein comprising the extracellular CD2-binding portion of the human LFA-3 and the Fc (hinge, CH2, and CH3 domains) portion of human IgG1. Structural differences between LFA3IgFP used in this study and alefacept were not compared due to the complicated structure of the glycosylated proteins. It was demonstrated by the in vitro cell models that the fusion protein could interfere with the activation of T lymphocytes through specific binding with CD2 on the surface of T lymphocytes, and its efficiency showed no significant difference with that of alefacept[11].
In this early phase, a small-scale exploratory study, we investigated the safety, PK, and PD properties of LFA3IgFP after im administration in healthy volunteers and patients with chronic plaque psoriasis. Both the single- and multiple-dose im regimens were generally well tolerated in this relatively small sample. No patient experienced SAE. AE observed in the trials appeared similar to those previously reported for alefacept. The measurement of LFA3IgFP serum levels was important for the PK study, but difficult owing to its low concentration compared with normal human IgG. We determined the LFA3IgFP serum concentration using the same method as described by Ashay et al[2], and the only difference was that we substituted murine monoclonal anti-LFA3 monoclonal antibody IC3 for IE6 (Biogen, Cambridge, MA, USA). Unfortunately, the method was relatively insensitive because of the cross-activity between the IC3 antibody and HRP-labeled antihuman IgG1. We also tried to coat the microtiter plate with the purified anti-LFA-3 monoclonal antibody (cell line HB-205, clone TS2/9.1.4.3), but the method suffered the same problem of insensitivity. This may be due to the specification or structure differences between LFA3IgFP and alefacept, or IC3 and IE6. Finally, a suitable assay was developed based on 2 murine monoclonal anti-LFA3 antibodies with different idiotypes (IC3 and TS2). This assay preserved the advantages of ELISA and overcame the deficiencies of the cross-activity between the coated antibody and human IgG1. The robustness of the assay was demonstrated under a range of experimental conditions. Specificity, sensitivity, accuracy, and precision all met the requirements for the PK and PD study.
To assess the clinical response of LFA3IgFP administration, immune response to this drug was also monitored. The decrease in CD4+ and CD8+ lymphocyte subsets was observed in all single- and multiple-dose groups. To determine how well psoriasis responded to the treatment under the test, the PASI was calculated before, during, and after the treatment period in study 2. Approximately 70% of patients achieved a 75% reduction in their baseline PASI scores after a 15 mg weekly im administration for 8 weeks. However, due to the small number of patients and the lack of placebo control arm, we can not draw a conclusion about the efficacy of LFA3IgFP im administration.
The results of this PK and PD study suggest that in healthy volunteers, changes of LFA3IgFP serum concentration within 50 d following drug administration are quick and transient. LFA3IgFP concentrations rapidly increased and were detectable in the serum of all patients 2 h after im administration and then remained detectable for approximately 1200 h (ie 50 d) after the last infusion. The mean serum Cmax of LFA3IgFP were approximately 638±116 μg·L-1, 1944±221 μg·L-1, and 3021±185 μg·L-1, respectively. The mean Cls/F were 0.020±0.005 L·h-1, 0.018±0.004 L·h-1, and 0.016±0.002 L·h-1, respectively. The mean Vd/F were 7.131±1.119 L, 6.470±0.873 L, and 6.751±0.683 L, respectively. Following the im administration regimen, exposure to LFA3IgFP (Cmax and AUC) was proportional to the dose administered. Patients enrolled in the low-dose group demonstrated a 5-fold lower Cmax than that of the high-dose group. T1/2ke for all 3 different dose groups was consistent at approximately d 10.
In patients with chronic plaque psoriasis, the steady state of serum concentration was observed approximately 4 weeks after the im administration of LFA3IgFP. Css max was 2739±323 μg·L-1 while Css min was 2599±317 μg·L-1 following an 8 dose regimen. The difference between Css max and Css min appears small. In addition, the variability of many other parameters in the multiple-dose group also appears small (Table 2). There are at least 2 reasons for this. First, the sample size in this study is small. Second, drug accumulation at steady state should be concerned. Compared with single-dose 15 mg im administration, a shorter T1/2ka and a longer T1/2Ke was observed. Further investigations showed significant accumulation, and the accumulation factor was 3.5. This suggests that the dosage regimen of 15 mg once a week may be too frequent, and a dosage adjustment or a longer dosing interval should be evaluated in later clinical trials.
In summary, our study demonstrated that the im administration of LFA3IgFP was well tolerated and was associated with immune response and clinical response in patients with chronic plaque psoriasis. The PK of LFA3IgFP was concentration dependent, and the steady state serum concentrations of LFA3IgFP could be detected 4 weeks after the first administration. However, definitive conclusions concerning the safety and efficacy of this drug cannot be drawn in the absence of a placebo-controlled study using an adequate sample size. The safety and efficacy of LFA3IgFP will be further investigated in the ongoing pivotal phase II and III clinical trials.
References
- Austinl M, Ozawa M, Kikuchi T, Walters IB, Krueger JG. The majority of epidermal T cells in Psoriasis vulgaris lesions can produce type 1 cytokines, interferon-γ, interleukin-2, and tumor necrosis factor-α, defining TC1 (cytotoxic T lymphocyte) and TH1 effector populations: a type 1 differentiation bias is also measured in circulating blood T cells in psoriatic patients. J Invest Dermatol 1999;113:752-9.
- Vaishnaw AK, TenHoor CN. Pharmacokinetics, biologic activity, and tolerability of alefacept by intravenous and intramuscular administration. J Pharmacokinet Pharmacodyn 2002;29:415-26.
- Gordon KB, Vaishnaw AK, O’Gorman J, Haney J, Menter A. Alefacept Clinical Study Group. Treatment of psoriasis with alefacept: correlation of clinical improvement with reductions of memory T-cell counts. Arch Dermatol 2003;139:1563-70.
- Robert C, Kupper TS. Inflammatory skin diseases, T cells, and immune surveillance. N Engl J Med 1999;341:1817-28.
- Danielian S, Fagard R, Alcover A, Acuto O, Fischer S. The tyrosine kinase activity of p56lck is increased in human T cells activated via CD2. Eur J Immunol 1991;21:1967-70.
- June CH, Fletcher MC, Ledbetter JA, Samelson LE. Increases in tyrosine phosphorylation are detectable before phospholipase C activation after T cell receptor stimulation. J Immunol 1990;144:1591-9.
- Krueger GG, Papp KA, Stough DB, Loven KH, Gulliver WP, Ellis CN, et al. A randomized, double-blind, placebo-controlled phase III study evaluating efficacy and tolerability of 2 courses of alefacept in patients with chronic plaque psoriasis. J Am Acad Dermatol 2002;47:821-33.
- Lebwohl M, Christophers E, Langley R, Ortonne JP, Roberts J, Griffiths CE, et al. An international, randomized, double-blind, placebo-controlled phase 3 trial of intramuscular alefacept in patients with chronic plaque psoriasis. Arch Dermatol 2003;139:719-27.
- Gordon KB, Langley RG. Remittive effects of intramuscular alefacept in psoriasis. J Drugs Dermatol 2003;2:624-8.
- Cather J. Investigational therapies for psoriasis. J Am Acad Dermatol 2003;49:133-8.
- Lin B, Tan M, Li J, Wang H, Xue J, Hua J, et al. Bioassay of the recombinant human lymphocyte function-associated antigen 3-IgG fusion protein in vitro and in vivo. Curr Immunol 2006;26:357-61.