
Prolonged exposure to resistin inhibits glucose uptake in rat skeletal muscles1
Introduction
Resistin, a novel, cysteine-rich hormone mainly secreted by adipose tissues, has been implicated in obesity and type 2 diabetes[1]. Recent research demonstrated that recombinant resistin protein impaired insulin action in normal mice and cultured adipocytes and immunoneutralization of resistin improved insulin action in mice with diet-induced obesity[1]. Plasma resistin levels were increased in db/db, ob/ob and diet-induced obese mice[1], while resistin mRNA levels in obese rodents were often found to be decreased[2–4]. Resistin is also believed to be a thiazolidinedione (TZD)-regulated protein, a new class of insulin sensitizing drugs, as TZD treatment suppressed resistin expression in 3T3-L1 adipo-cytes and in white adipose tissues of mice fed with a high-fat diet[1].
The pathophysiological role of resistin in human has not been fully elucidated. The putative human homologue of resistin is only 59% identical to mouse resistin at the amino acid level. The source of resistin appears to differ between human and mice[1,5], with research suggesting macrophages, while adipocytes in mice, are the principal source of resistin in human. This reinforces the notion that adipose tissue, rather than simply adipocytes, functions as a dynamic endocrine organ. Resistin (also called “found in inflammatory zone 3”, FIZZ3) has been implicated in a low-grade inflammatory condition associated with obesity[6]. Increased plasma resistin concentration has been observed in obese[7] and diabetic people[8]. Moreover, TZD treatment resulted in decreased plasma resistin concentration in patients with type 2 diabetes[9], suggesting resistin plays an important role in the etiology of insulin resistance and diabetes[10].
In our study, we utilized the single commercial resistin protein to examine its effects on glucose uptake in skeletal muscle cells. Additionally, considering the higher expression of the resistin gene in human macrophages, and the fact that some rodent adipocytes may make a more complex condition (eg the alteration of cytokines secretion, the different polymeric forms of resistin[11]) besides the increased resistin secretion, we applied the cultured supernatant from 293-T cells transfected with resistin-expressing vectors to further assess the effect of the complex condition on glucose uptake in skeletal muscle cells.
Materials and methods
Antibodies Monoclonal antibody (6×His) was purchased from Clontech (Mountain View, CA, USA). Monoclonal Antibody (anti-flag) was from Sigma (St Louis, MO, USA). Primary polyclonal GLUT1, GLUT4, and SNAP23 antibodies and horseradish peroxidase-conjugated secondary antibodies were purchased from Santa Cruz (Santa Cruz, CA, USA). IRS-1 polyclonal antibody was from Cell Signaling (Danvers, MA, USA). Phospho-specific polyclonal antibody against IRS-1 (Tyr612) was from Biosource (Camarillo, CA, USA). These primary antibodies were respectively diluted for Western blotting [resistin (anti-His), 1:8000, (anti-Flag), 1:1000; GLUT4, 1:700; GLUT1, 1:600; IRS-1, 1:800; Phospho-IRS-1 Tyr612, 1:500; SNAP23, 1:800], as well as all secondary antibodies (1:2500).
Plasmid construction Full-length rat Resistin were amplified by reverse transcriptase PCR (RT-PCR, 58 ºC, 33 cycles). Primer sequence were forward, 5'-GCA GGA TCC ACC ACC ATG AAG AAC CTT TCA T-3', and reverse, 5'-TAT CTC GAG CGG GAA CCA ACC CGC-3', and contained BamH I and the Xho I sites, respectively. The PCR products were then subcloned into the eukaryotic expression vector pcDNA3.1Myc/His(B) (Invitrogen, Carlsbad, CA, USA).
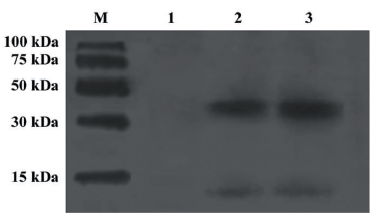
Cell culture and transient transfection 293-T cells were cultured in Dulbecco’s modified Eagle’s medium (DMEM) containing 10% fetal bovine serum (FBS), 100 µg/mL penicillin and streptomycin until reaching 70%–80% confluence. The cells were then cultured with serum free media (SFM, MP Biomedicals, Seven Hills, NSW, Australia) and transfected with expression vectors, utilizing FugeneTM 6 transfection reagent (Roche, Basel, BS, Switzerland). To confirm transfection, the 293-T cell supernatant was collected 24 h post-transfection, centrifuged (700 g for 5 min) then probed for resistin expression by Western blotting, together with the single commercial resistin. Recombinant resistin concentration in the cultured supernatant was quantified by ELISA (YuanXiang Medical Instruments, Shanghai, China).
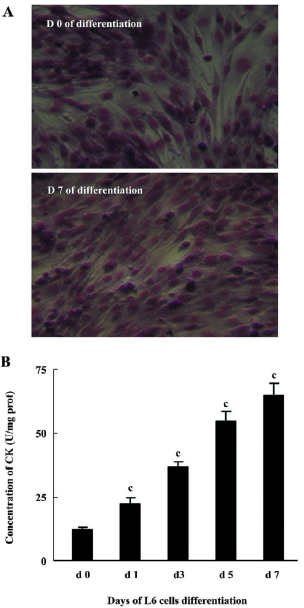
Differentiation of myoblasts L6 rat myoblasts (ATCC, Manassas, VA, USA) were maintained in DMEM supplemented with 10% FBS and differentiated into myotubes by exposure to DMEM supplemented with 2% FBS. Myogenic differentiation to myotubes was confirmed morphologically and biochemically as previously described[12]. Morphological differentiation parameters (alignment, elongation, and fusion) were assessed by light microscopy after staining with May-Grünwald Giemsa (JianCheng Biochemical Institute, Nanjing, China). Myogenic differentiation was determined biochemically by measuring creatine kinase (CK) activity using a spectrophotometric-based kit (JianCheng Biochemical Institute, Nanjing, China).
2-Deoxyglucose uptake assay Myotubes were cultured in 24-well plates and treated with single commercial resistin (130 ng/mL, 0–24 h, Alexis, San Diego, CA, USA) or cultured supernatant (0–24 h) contained in conditioned medium (50% cultured supernatant from 293-T cells transfected with resistin-expressing vectors and 50% SFM), or without them for periods of 0–24 h, then incubated for 15 min with or without insulin (10 nmol/L). Uptake of 2-deoxy-D-[3H]glucose (CIC, Beijing, China) was assayed for 10 min as previously described[13] with minor modifications. Briefly, the cells were washed with ice-cold phosphate-buffered saline, and then 200 µL NaOH (1 mol/L) was added to each well. Aliquots of the cell lysate were transferred to the scintillation vials for radioactivity counting and the remainder was used for the protein assay. Non-specific uptake was determined in the presence of cytochalasin B (10 µmol/L) and was subtracted from all values.
Western blotting L6 myotube cells were grown in 6-well plates, treated with single resistin, cultured supernatant containing recombinant resistin, or without them for 2 h followed with or without insulin (100 nmol/L, 15 min). The total or phosphorylated protein was extracted as previously described[14]. The plasma membrane (PM) protein was extracted using the Eukaryotic Membrane Protein Extraction Reagent (Pierce, Rockford, IL, USA). After SDS-PAGE, the proteins (20 µg/lane) were electrophoretically transferred to a nitrocellulose membrane (Whatman, London, UK). Blocked with TBST (Tris-Buffered Saline Tween-20; 0.14 mol/L NaCl, 0.02 mol/L Tris base, pH 7.6, and 0.1% Tween) containing 3% BSA (Bovine serum albumin) for 1 h at room temperature, the membrane was hybridized with primary antibodies at a appropriate dilution at 4 ºC overnight. The membrane was then washed with TBST for 5 min and repeated 5 times. Then, the membranes were incubated with horseradish peroxidase-conjugated secondary antibodies for 1 h at room temperature, washed with TBST and developed with ECL (Enhanced chemiluminescence; Amersham, Picataway, UK).
Protein assay The total protein content of the cell extracts or cultured supernatant was determined with BCATM Protein Assay Reagent (Pierce, Rcokford, IL, USA).
Statistical analysis All data are expressed as mean±SD. Data were analyzed by one-way ANOVA or Student’s t-test utilizing the SPSS 10.0 statistic software package (SPSS Inc, Chicago, IL, USA) with P<0.05 considered significant.
Results
Identification of single commercial resistin and resistin in culture supernatant of resistin-transfected 293-T cells Single commercial resistin and resistin in culture supernatant of resistin transfected 293-T cells were identified by Western blot analysis. They both existed mainly as trimers (Figure 1). The resistin concentration of the culture supernatant was 260 ng/mL quantified by ELISA.
L6 myoblast differentiation Morphological changes to myotube formation in L6 myoblasts were noted 7 d following the induction of myogenic differentiation. May-Grünwald Giemsa staining data suggested that over 90% of the cells contained more than 1 nucleus (Figure 2A). CK activity increased gradually after the induction of differentiation (Figure 2B).
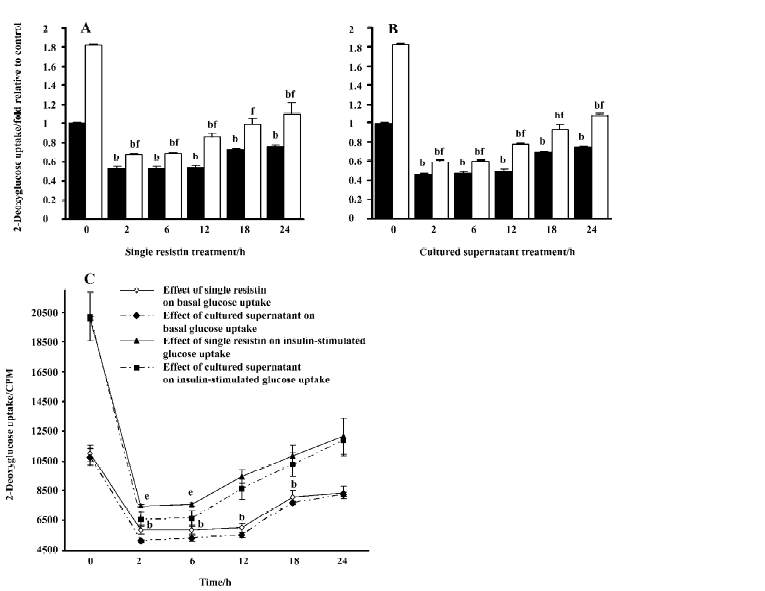
Effects of resistin on basal and insulin-stimulated glucose uptake in L6 myotubes Resistin decreased basal and insulin-stimulated glucose uptake, with a significant decrease elicited by resistin at as little as 2 h (Figure 3A, 3B). An approximate 25% decrease in basal glucose uptake was observed in L6 myotubes after 24 h resistin treatment. Although insulin increased basal glucose uptake, the magnitude of the response was significantly attenuated (approxi-mately 1.81 and 1.1-fold in the control and the 24 h resistin-stimulated cells, respectively). Glucose uptake following insulin exposure was reversed to lower the basal values when treated with resistin for 2, 6, 12, and 18 h. A trend towards partial recovery of the insulin response at later time-points was observed. Additionally, the exposure of the cells to the cultured supernatant containing recombinant resistin, at a concentration of 130 ng/mL in our research, had a greater effect on inhibition of basal and insulin-stimulated glucose uptake (Figure 3C). Resistin treatment did not affect cell viability as assessed by 3-(4,5-dimethyl-2-thiazolyl)-2,5-diphenyltetrazolium bromide (MTT) assay (control: 1.0±0.07; single resistin: 0.96±0.08; cultured supernatant: 0.96±0.07).
Effects of resistin on basal and insulin-stimulated GLUT4 translocation to the PM We consequently examined the effects of resistin treatment on GLUT4 translocation to the PM in response to insulin in L6 myotubes. The results demonstrated that resistin decreased insulin-stimulated GLUT4 translocation to the plasma, but did not alter basal GLUT4 translocation (Figure 4). Our data suggested that 2 h resistin treatment did not alter the total content of either GLUT4 (control: 1.0±0.18; single resistin: 1.0±0.17; cultured supernatant: 1.03±0.19) or GLUT1 (control: 1.0±0.2; single resistin: 1.02±0.2; cultured supernatant: 1.09±0.21) in L6 myotubes (Figure 4A, 4C).
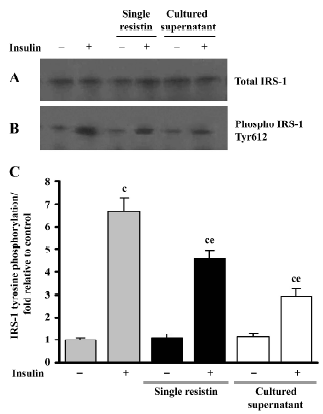
Effects of resistin on insulin-stimulated IRS-1 tyrosine phosphorylation We examined the IRS-1 tyrosine phosphorylation status to further elucidate the effects of resistin (2 h) on IRS-1 in L6 myotubes. As seen in Figure 5, single resistin greatly inhibited insulin-stimulated IRS-1 tyrosine phosphorylation; meanwhile, the cultured supernatant containing recombinant resistin resulted in a much greater inhibition at a concentration of 130 ng/mL in our research, both without affecting the total IRS-1 protein content.
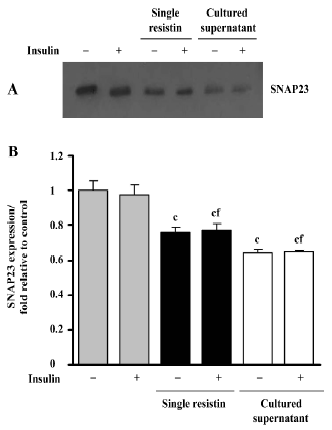
Effects of resistin on SNAP23 expression SNAP23 is a key SNAREs (SNAP receptors) component and is required for docking and/or fusion of intracellular vesicles to the PM. As shown in Figure 6, resistin treatment (2 h) decreased the SNAP23 total content in L6 myotubes, in the presence or absence of insulin. There was an approximate 0.23-fold decrease in protein content, relative to the control, resulting from exposure to resistin, while a 0.35-fold decrease was noted following exposure to the cultured supernatant treatment. Our results also suggested that insulin did not alter SNAP23 protein content (Figure 6).
Discussion
In the current study we examined the effects of resistin and cultured supernatant containing recombinant resistin on glucose uptake in rat skeletal muscle cells. Considerable debate exists regarding the role of resistin in the pathophysiology of insulin resistance in human and animals, and whether resistin acts primarily in muscles, liver or fat[15–18]. Recent research [19], however, implicates resistin function in skeletal muscles, for example; adenoviral overexpression of murine resistin, at supraphysiological concentrations for 7 d, resulted in glucose intolerance, hyperinsulinemia, and an impaired ability of insulin to lower blood glucose in male Wistar rats. Furthermore, the inhibition of resistin activity in transgenic mice expressing a dominant inhibitory version of the protein improved insulin sensitivity and glucose tolerance in mice[17], while the injection of resistin into mice resulted in impaired glucose tolerance and insulin action[1].
Here we investigated the effect of resistin on basal and insulin-stimulated glucose-uptake in skeletal muscle cells, with resistin treated for 0–24 h. We observed an inhibition of basal or insulin-stimulated glucose uptake in L6 rat skeletal muscle cells when incubated with resistin. These results were similar to those noted following acute resistin treatment in L6 rat skeletal muscle cells[20]. Furthermore, we measured the level of GLUT4 on the plasma membrane in L6 cells. It is well known that insulin-stimulated glucose uptake is mediated by the translocation of insulin-sensitive glucose transporters (GLUT4) from intracellular vesicles to the PM. Our results indicated that the effect of resistin on insulin-stimulated glucose uptake involved a decrease in the extent of translocation of GLUT4 to PM. Trying to explain the decreased basal glucose uptake, we found no overall change in the GLUT1 or GLUT4 protein content.
To further investigate the mechanism of how resistin decreased insulin-stimulated GLUT4 translocation and glucose uptake, we examined the protein content and tyrosine phosphorylation level of IRS-1, which plays a central role in metabolic effects of insulin[21]. Intriguingly, resistin decreased insulin-stimulated tyrosine phosphorylation of IRS-1, without changes on IRS-1 total protein content. It has been previously reported that the insulin-activated PI3K (Phosphoinositide Kinase-3)-Akt/PKB (Protein Kinase B) pathway resulted in a translocation of GLUT4 from the cytosol to the PM[22]. Research has also suggested that Tyr612 phosphorylation of IRS-1 generates the major docking site for PI3K mediated insulin signaling[23]. Based on previous work documenting the effect of Tyr612 phosphorylation status on insulin signaling[24], we speculated that the down-regulated level of phosphorylated Tyr612 in L6 cells incubated with resistin might impair the IRS-1/PI3K-Akt signaling pathway activation in response to insulin, suggesting a potential mechanism by which resistin decreases insulin-stimulated GLUT4 translocation and glucose uptake.
A decrease of basal glucose uptake was observed, although no changes were noted in the content of GLUT4 and GLUT1 on the plasma membrane. To further elucidate this effect, we investigated SNAP23 protein content and found that its expression was downregulated when treated with resistin. It has been suggested that SNAP23 promotes the docking and fusion of secretory vesicles to the PM and controls vesicle transport by retention mechanisms and dynamic sorting[25,26]. We speculated that downregulated SNAP23 might decrease the rate of the GLUT4 vesicle recycling through the cytosol to the PM, Then, the downregulated recycling rate noted in the GLUT4 vesicles lead to a decreased cyclic utilization rate of GLUT4 for glucose transport, per unit time; no variability was noted in the PM protein content of GLUT4.
As mentioned above, 2 kinds of research systems, single resistin and supernatant containing recombinant resistin from transfected 293-T cells, were performed and both acquired similar results. However, interestingly, the incubation of L6 cells with the cultured supernatant containing recombinant resistin from transfected 293-T cells, at a concentration of 130 ng/mL in our research, resulted in a greater inhibition of glucose uptake, SNAP23 expression, and Tyr612 phosphorylation of IRS-1, compared to single resistin treatment (130 ng/mL). As SNAP23, IRS-1 and glucose uptake, several main steps in this bio-pathway, from up to down, were different. We inferred it might just be due to the difference between the single resistin and the cultured supernatant. We proposed 2 possible explanations: first, the different polymer styles of resistin (different polymer styles of resistin obviously had different bio-activity[11]); the other is the cultured supernatant which included some cofactors of resistin. However, in our research, the main polymer styles of resistin protein in the 2 research system were both trimers, and we believed the co-factors worked. Compared with the single commercial resistin that might just act as a cytokine working outside of skeletal muscle cells, resistin-transfected 293-T cells might have both secreted resistin in cultured supernatant and prior-secreted resistin in cells. Moreover, previous research[11] in our laboratory suggested that the resistin protein contained a putative leucine zipper, which may also act as a transcription factor to regulate the expression of genes associated with metabolism. In this way, the prior-secreted resistin could lead to consequent changes in the cultured supernatant. The consequent changes, together with the secreted resistin, would play roles on skeletal muscle cells when the cultured supernatant was added. These data lead us to believe that the cultured supernatant from transfected 293-T cells contained additional effectors that facilitated the physiological effects of resistin. Further research, however, is needed to verify this hypothesis.
In summary, our results demonstrated that resistin inhibited basal and insulin-stimulated glucose uptake. Our results also suggested these effects were mediated by tyrosine phosphorylation of IRS-1 and increased SNAP23 protein content or as some yet-unidentified mediators. Our results also showed that the inhibitory effects of glucose uptake following exposure to cultured supernatant containing recombinant resistin from transfected 293-T, at concentration of 130 ng/mL in our research, were greater than those noted in resistin-treated L6 cells. Our data demonstrated that resistin is a potential direct regulator of glucose homeostasis.
References
- Steppan CM, Bailey ST, Bhat S, Briwn EJ, Baberjee RR, Wright CM, et al. The hormone resistin links obesity to diabetes. Nature 2001;409:307-12.
- Rajala MW, Lin Y, Ranalletta M, Yanq XM, Qian H, Ginqerich R, et al. Cell type-specific expression and coregulation of murine resistin and resistin-like molecule-alpha in adipose tissue. Mol Endocrinol 2002;16:1920-30.
- Steppan CM, Lazar MA. Resistin and obesity-associated insulin resistance. Trends Endocrinol Metab 2002;13:18-23.
- Rajala MW, Qi Y, Patel HR, Takahashi N, Baberjee R, Pajvani UB, et al. Regulation of resistin expression and circulating levels in obesity, diabetes, and fasting. Diabetes 2004;53:1671-9.
- Ghosh S, Singh AK, Aruna B, Mukhopadhyay S, Ehtesham NZ. The genomic organization of mouse resistin reveals major differences from the human resistin: functional implications. Gene 2003;305:27-34.
- Lehrke M, Reilly MP, Millington SC, Iqbal N, Rader DJ, Lazar MA. An inflammatory cascade leading to hyperresistinemia in humans. Plos Med 2004;1:e45.
- Degawa-Yamauchi M, Bovenkerk JE, Juliar BE, Watson W, Kerrk K, Jones R, et al. Serum resistin (FIZZ3) protein is increased in obese humans. J Clin Endocrinol Metab 2003;88:5452-5.
- McTernan PG, Fisher FM, Valsamakis G, Chetty R, Harte A, McTernan CL, et al. Resistin and type 2 diabetes: regulation of resistin expression by insulin and rosiglitazone and the effects of recombinant resistin on lipid glucose metabolism in human differentiated adipocytes. J Clin Endocrinol Metab 2003;88:6098-106.
- Bajaj M, Suraamornkul S, Hardies LJ, Pratipanaeatr T, DeFronzo RA. Plasma resistin concentration, hepatic fat content, and hepatic and peripheral insulin resistance in pioglitazone-treated type II diabetic patients. Int J Obes Relat Metab Disord 2004;28:783-9.
- McTernan PG, Kusminski CM, Kumar S. Resistin. Curr Opin Lipidol 2006;17:170-5.
- Gong H, Ni Y, Guo X, Fei L, Pan X, Guo M, et al. Resistin promotes 3T3-L1 preadipocyte differentiation. Eur J Endocrinol 2004;150:885-92.
- el-Naqqar Kanda F. Direct effects of tumor necrosis factor alpha (TNF-alpha) on L6 myotubes. Kobe J Med Sci 2004;50:39-46.
- Ceddia RB, Somwar R, Maida A, Fanq X, Bikopouls G, Sweeney G. Globular adiponectin increases GLUT4 translocation and glucose uptake but reduces glycogen synthesis in rat skeletal muscle cells. Diabetoloqia 2005;48:132-9.
- Andreozzi F, Laratta E, Sciacqua A, Perticone F, Sesti G. Angiotensin II impairs the insulin signaling pathway promoting production of nitric oxide by inducing phosphorylation of insulin receptor substrate-1 on Ser312 and Ser616 in human umbilical vein endothelial cells. Circ Res 2004;94:1211-8.
- Banerjee RR, Rangwala SM, Shapiro JS, Rich AS, Rhoades B, Qi Y, et al. Regulation of fasted blood glucose by resistin. Science 2004;303:1195-8.
- Pravenec M, Kazdova L, Landa V, Zidek V, Mlejnek P, Jansa P, . Transgenic and recombinant resistin impair skeletal muscle glucose metabolism in the spontaneously hypertensive rat. J Biol Chem 2003; 278: 45 209–15.
- Kim KH, Zhao L, Moon Y, Kang C, Sul HS. Dominant inhibitory adipocyte-specific secretory factor (ADSF)/resistin enhances adipogenesis and improves insulin sensitivity. Proc Natl Acad Sci USA 2004;101:6780-5.
- Muse ED, Obici S, Bhanot S, Monia BP, McKay RA, Rajala MW, et al. Role of resistin in diet-induced hepatic insulin resistance. J Clin Invest 2004;114:232-9.
- Satoh H, Nguyen MT, Miles PD, Imamura T, Usui I, Olefsky JM. Adenovirus-mediated chronic “hyper-resistinemia” leads to in vivo insulin resistance in normal rats. J Clin Invest 2004;114:224-31.
- Moon B, Kwan JJ, Duddy N, Sweeney G, Begum N. Resistin inhibits glucose uptake in L6 cells independently of changes in insulin signaling and GLUT4 translocation. Am J physiol Endocrinol Metab 2003;285:E106-15.
- Giovannone B, Scaldaferri ML, Federici M, Porzio O, Lauro D, Fusco A, et al. Insulin receptor substrate (IRS) transduction system: distinct and overlapping signaling potential. Diabetes Metab Res Rev 2000;16:434-41.
- Sowers JR. Insulin resistance and hypertension Am J Physiol Heart Circ Physiol 2004;286:1597-602.
- Taniquchi CM, Emanuelli B, Kahn CR. Critical nodes in signalling pathways: insights into insulin action. Nat Rev Mol Cell Biol 2006;7:85-96.
- Gual P, Le Marchand-Brustel Y, Tanti JF. Positive and negative regulation of insulin signaling through IRS-1 phosphorylation. Biochimie 2005;87:99-109.
- Bryant NJ, Govers R, James DE. Regulated transport of the glucose transporter GLUT4. Nat Rev Mol Cell Biol 2002;3:267-77.
- Foster LJ, Klip A. Mechanism and regulation of GLUT-4 vesicle fusion in muscle and fat cells. Am J Physiol Cell Physiol 2000;279:C877-90.