
Dihydroartemisinin is an inhibitor of ovarian cancer cell growth1
Introduction
Ovarian cancer is the third most common gynecological cancer in women, but it has the highest mortality rate of all gynecological cancers. Ovarian cancer is so deadly because it is infrequently diagnosed at an early stage. There are often no symptoms in its earlier stages, and the cancer may grow for some time before it causes pressure, pain, or other problems. However, even when symptoms appear, it is difficult to tell whether they are caused by ovarian cancer, or by some other less threatening disease. Approximately two-thirds of patients present with advanced-stage disease (stage III or IV) at diagnosis. The majority of cases initially respond to standard therapies with different anticancer drugs, including platinum-containing compounds and taxol, but long-term survival and cure rates are still disappointingly low because of the development of drug resistance[1]. As a result, while women diagnosed with localized cancer, or one that has not spread beyond the ovary, have a 93.5% 5 year survival rate, only about 19% of all cases are detected at this stage[2]. When the cancer is already regional or distant by the time it is first diagnosed, the 5 year survival rate drops to 68.8% and 28.5%, respectively[3]. Ovarian cancer remains a difficult cancer to treat in that the mortality rate has not improved in the past few decades. Therefore, while it is challenging, finding a new drug capable of killing these resistant ovarian cancer lines would drastically reduce the disease’s mortality rate.
Artemisinin (Qinghaosu), the active constituent of the herb Artemisia annua (sweet wormwood), has been used as early as the Han Dynasty in ancient China to treat malaria and is still widely used as an effective antimalaria drug in clinics. More recently, some laboratory studies have suggested that artemisinin and its derivatives have anticancer properties, such as in breast cancer and oral squamous cell carcinomas[4–22], although the underlying mechanisms is not clearly known[11,23,24]. In addition, artemisinin and its derivatives can increase sensitivity of human glioma cells to ionizing radiation[25] and inhibit tumor angiogenesis[5,26]. In the present studies, we examined the anticancer activity of dihydroartemisinin (DHA), an artemisinin derivative, in human ovarian cancer cells and demonstrated that DHA is a new potent drug for the inhibition of ovarian cancer cell growth via the induction of apoptosis (programmed cell death) and blocking of the cell cycle progression. These studies will provide important preclinical information and a mechanism for the clinical application of DHA in ovarian cancer therapy in the near future.
Materials and methods
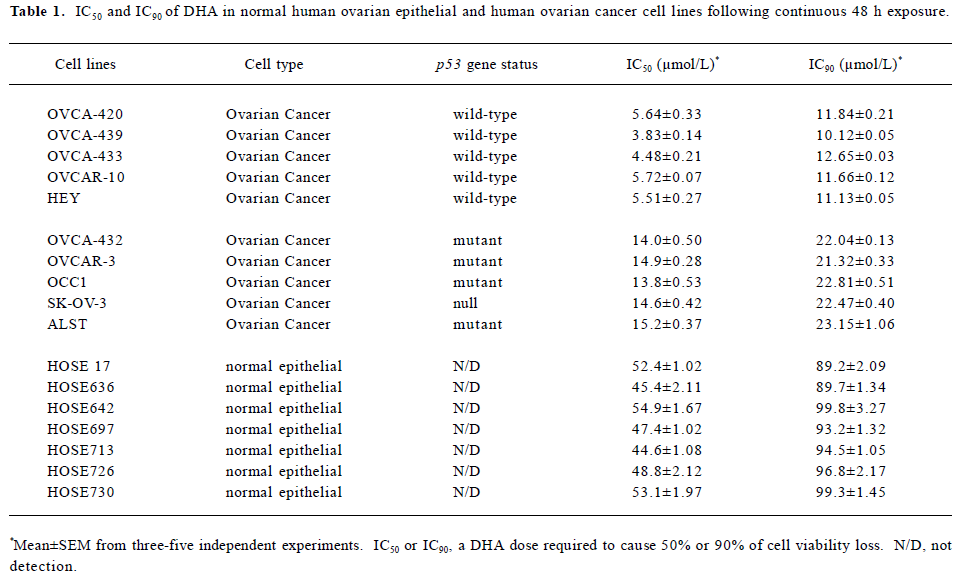
Cell culture and DHA Ten ovarian cancer cell lines, as listed in Table 1, were purchased from American Type Culture Collection and maintained in Dulbecco’s modified Eagle medium (DMEM, Invitrogen, Carlsbad, CA, USA) supplemented with 10% fetal bovine serum, 100 unit/mL penicillin, 100 µg/mL streptomycin, and a mixture of nonessential amino acids (Sigma-Aldrich, St Louis, MO, USA). Seven normal human ovarian surface epithelial (HOSE) cell lines, as listed in Table 1, were cultured in a mixture of medium 199 and MMCDB105 medium supplemented with 10% fetal bovine serum. Yellow DHA was purchased from Sigma-Aldrich (USA) and dissolved in sterile double distilled water (DD water) with a stock solution of 20 mmol/L and stored at -20 oC. DHA was directly diluted in medium to appropriate concentrations just before the experiments. Artemisinin, artesunate, arteether, artemether, and arteannuin were kindly provided by the Laboratory of Molecular Pharmacology, Division of Basic Science, National Cancer Institute, National Institutes of Health, Bethesda, Maryland, USA.
Full table
Transfection of siRNA siRNA for human Bcl-2 and Bax were designed and synthesized by Ambion (Austin, TX, USA). The specific sequences of these siRNA were as follows: Bcl-2, 5'-CAGGACCUCGCCGCUGCAGACC-3'; Bax, 5'-GACGAACUGGACAGUAA-CA-3'; and luciferase, 5'-CGUACGCGGAAUACUUCGA-3' (as a control). Transfections were performed at approximately 70% confluency in 6-well plates using oligofectamine (Invitrogen, USA) according to the manufacturer’s instructions. Briefly, 2.5×10⁵ cells were seeded in complete growth medium the day before transfection. For each transfection reaction, siRNA-oligo-fectamine complexes were prepared by mixing oligonucleotides with oligofectamine diluted at 1:5 (v/v) with medium directly before addition to the cells. Final concentrations of the siRNA were between 1 and 100 nmol/L. Transfections were performed in 1 mL serum-free medium for 4 h. Thereafter, 0.5 mL medium containing 30% Fetal Calf Serum (FCS, v/v) was added to achieve complete growth conditions (10% FCS). In each experiment, control cells receiving only oligofecta-mine without siRNA and luciferase siRNA-transfected cells (as a negative control), were included. Cells were assayed 48 h after transfection.
Cell viability analysis Cell viability was performed by a MTT (3-[4,5-methylthiazol-2-yl]-2,5-diphenyl-tetrazolium bromide) viability assay, the most commonly used assay to determine cell growth and death. The MTT survival assay is described in detail in previous studies[27]. Briefly, exponentially growing cells were recultured (5000 cells/well) overnight in 96-well tissue culture plates. Different doses of DHA diluted in medium were added to the respective wells, and the cells were then postincubated for either 24 or 48 h. 20 µL MTT (Sigma-Aldrich, USA) was directly added to the media in each well with a final concentration of 2 mg/mL. After 4 h incubation, the medium containing MTT was discarded and 120 µL DMSO (Sigma-Aldrich, USA) was added for 10 min. Absorbance was measured in an ELISA reader at 570 nm, with the absorbance at 690 nm to correct for back-ground, and viability was expressed as the percentage of untreated controls. As an alternative method to analyze cell viability, trypan blue exclusion assays were performed after adherent and non-adherent cells were harvested. To validate the MTT assay as a measure of cell viability, trypan blue exclusion was performed in some experiments in parallel. All experiments were performed at least 3 times.
Flow cytometry assay Cell cycle analysis was performed by flow cytometry. After the cells were untreated and treated with DHA, the medium was collected into centrifuge tubes. The removed cells by trypsin were poured into the same tubes. The cells were centrifuged for 5 min at 1800×g. The supernatant were poured out, washed once with 1×phos-phate-buffered saline (PBS), and centrifuged for 5 min again. The cells were finally fixed by 5 mL of precooled 70% ethanol for at least 4 h. The fixed cells were centrifuged and washed with 1×PBS. After centrifugation, the cell pellets were resuspended in 500 µL propidium iodine (10 µg/mL) containing 300 µg/mL RNase (Sigma-Aldrich, USA). Then the cells were incubated on ice for 30 min and filtered with a 53 µm nylon mesh. Cell cycle distribution was calculated from 10 000 cells with ModFit LT software (Becton Dickinson, CA, USA) using FACScaliber (Becton Dickinson, San Jose, CA, USA).
DNA fragmentation gel electrophoresis Apoptosis induction was determined by a DNA fragmentation gel electrophoresis, as described in previous studies[28]. The cells untreated and treated with DHA were collected by trypsin and centrifuged for 5 min at 13000×g. The cells were washed with 1×PBS and centrifuged again. The cell pellets were then lysated with a 200 µL lysis buffer (10 mmol/L Tris-HCl at pH 7.6, 100 mmol/L EDTA, 20 mmol/L NaCl) and centrifuged. The supernatant was transferred into new tubes. 20 µL SDS plus 200 µL RNase A (10 mg/mL, Sigma-Aldrich, USA) was added to each tube. After 2 h incubation at 56 °C, 30 µL proteinase K (50 mg/mL, Sigma-Aldrich, USA) was added to each tube. The cell lysates were incubated at 37 °C for another 2 h. The DNA was finally precipitated with the addition of 10 µL of 10 mol/L potassium acetate and 1 mL 100% ethanol at -80 °C for 30 min. The extracted DNA samples were centrifuged and washed with 70% ethanol. Pure DNA were finally loaded and run on a 1% agarose gel at 80 V in running buffer (89 mmol/L Tris-acetate, 2 mmol/L Na2EDTA, and 89 mmol/L boric acid), stained with ethidium bromide, and photographed. The samples were run in tandem with a DNA molecular weight ladder (Life Technologies, Gaithers-burg, MD, USA) providing molecular size markers of 0.5–12 kilobase pairs. Gel photographs were evaluated for typical ladder patterns of low molecular weight DNA fragments in multiples of 180–200 base pairs, a hallmark of apoptosis.
Determination of apoptosis by terminal deoxynucleotidyl transferase-mediated nick end labeling assay Terminal deoxynucleotidyl transferase-mediated nick end labeling (TUNEL) was performed using the Apo-BrdUTM apoptosis detection kit (PharMingen, San Diego, CA, USA) to quantify induction of apoptosis following the manufacturer’s instructions. Briefly, the untreated or treated cells were fixed in 1% (w/v) paraformaldehyde in PBS and incubated on ice for 15 min. Then the cells were washed 3 times with PBS and preserved in 70% (v/v) ethanol overnight. About 1×10⁶ cells/treatment in duplicate, along with positive and negative controls, were counted, pelletized, washed twice with wash buffer, and subjected to labeling reaction using terminal deoxynucleotidyl transferase overnight at RT. At the end of the reaction, the cells were rinsed twice before treatment with fluorescein-labeled anti-BrdU antibody solution in the dark for 30 min at RT. The cells were stained with propidium iodide/RNase solution for 30 min in the dark and analyzed by flow cytometry (Epics XL-MCL, Beckman Coulter, Miami, FL, USA).
Western blot assay The protein expression was detected by using Western blot assays, as previously described[27,28]. The cells untreated and treated with DHA were harvested by trypsin and centrifugation. The cells were washed twice with ice-cold PBS and lysed with a protein lysis buffer containing Tris-HCl (50 mol/L, pH 7.4), Nonidet P-40 lysis buffer (1%), Na-deoxycholate (0.25%), NaCl (150 mmol/L), EDTA (1 mmol/L), phenylmethanesulfonyl fluoride (1 mmol/L), Na3VO4 (1 mmol/L), NaF (1 mmol/L), and an inhibitor cocktail (Sigma-Aldrich, USA). After centrifugation, the supernatant was transferred into new tubes. The protein concentration was determined by the Bio-Rad protein assay (Bio-Rad, USA). 50 µg total whole cell lysates were separated on SDS-PAGE and electroblotted onto nitrocellulose membranes (Millipore, Billerica, MA, USA). The membranes were then incubated in blocking solution [5% non-fat milk in 20 mmol/L Tris-HCl, 150 mmol/L NaCl, 0.1% Tween-20 (TBS-T)], followed by overnight incubation with the appropriate primary antibodies (Santa Cruz Biotechnology, Santa Cruz, CA, USA). After being completely washed with TBS-T, the membranes were incubated with horseradish peroxidase-conjugated secondary antibodies (Santa Cruz Biotechnology, USA) for 1 h. Finally, immunocomplexes were developed with an enhanced horseradish peroxidase/luminol chemiluminescence reagent (Sigma-Aldrich, USA) according to the manufacturer’s instruction. Mouse monoclonal antibodies against Bax (2D2, 1:500 dilution), Bad (C-7, 1:1000 dilution), Bcl-2 (100, 1:2000 dilution), Bcl-xL (H-5, 1:1000 dilution), and a goat antibody against α-actin (I-19, 1:2000 dilution) were purchased from Santa Cruz Biotechnology (USA). Each protein band was then quantitatively analyzed using Imagemaster (Amersham, Pittsburg, PA, USA) and Software Image Analyzer (Amer-sham, Pittsburg, PA, USA).
RT-PCR assay The relative changes of mRNA transcripts were performed by semi-quantitative RT-PCR assays, as describe in previous studies[27]. Briefly, 1.5×10⁶ cells untreated and treated with DHA were lysated with 1 mL TRIZOL method (according to Invitrogen specifications). The concentration of RNA was determined by absorbance at 260 nm, and its integrity was confirmed by means of electrophoresis on 1% agarose gels, and then stained with 0.1 mg/L ethidium bromide (EB). A total of 1 µg RNA was converted to cDNA using 15 U reverse transcriptase in 20 µL buffer, that contained 1 mmol/L deoxynucleoside triphosphate (dNTP), 1 U RNase inhibitor, and an 0.5 µg oligo (deoxythymidine) primer. An aliquot (5%) of cDNA was amplified using the following primers:
Bcl-2:
5'-CTC AGT CAT CCA CAG GGC GA-3' (forward) 540 bp
5'-AGA GGG GCT ACG AGT GGG AT-3' (reverse)
Bax:
5'-ACA AAG ATG GTC ACG GTC TGC C-3' (forward) 429 bp
5'-GGT TTC ATC CAG GAT CGA GAC GG-3' (reverse)
Bad:
5'-GTT TGA GCC GAG TGA GCA GG-3' (forward) 315 bp
5'-ATA GCG CTG TGC TGC CCA GA-3' (reverse)
Bcl-xL:
5'-CAG TGA GTG AGC AGG TGT TTT GG-3' (forward) 264 bp
5'-GTT CCA CAA AAG TAT CCC AGC CG-3' (reverse) GAPDH:
5'-CAA CTA CAT GGT CTA CAT GTT CC-3' (forward) 724 bp
'-CAA CCT GGT CCT CAG TGT AG-3' (reverse)
The PCR conditions were as follows: predenaturation at 94 ºC for 5 min, denaturation at 94 ºC for 30 s, annealing at 60 ºC (Bcl-2 and β-actin) or 64 ºC (Bcl-xL, Bax and Bad) for 40 s, and polymerization at 72 ºC for 40 s with Taq DNA polymerase. After 28 cycles, PCR products, together with the β-actin PCR product of the same template, were separated by electrophoresis and revealed by EB staining. Then each band of the electrophoresis gel was semiquantitatively analyzed using Imagemaster and Software Image Analyzer. Intensities of the mRNA levels were normalized to those of the β-actin products as ratios to produce arbitrary units of relative abundance.
Statistics Assays were performed in at least triplicate for each sample exposure, and an average value was deter-mined. Results were expressed as mean±SD. Statistical analysis was performed using ANOVA and Student-Newman-Keuls comparison for parametric data sets. P-values of <0.05 were considered significant.
Results
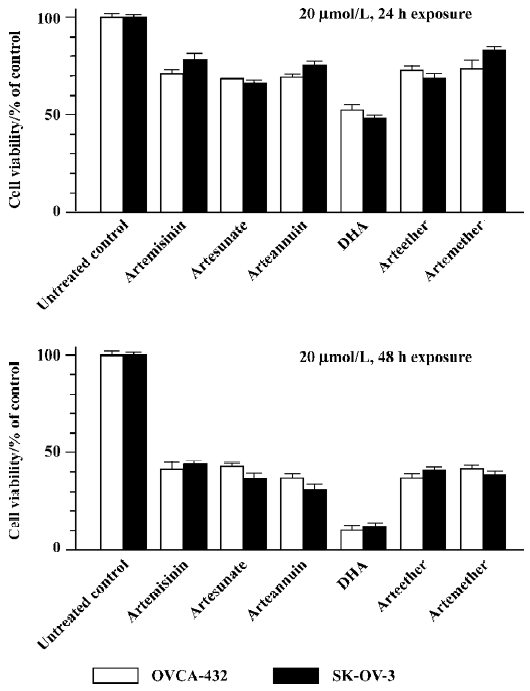
Artemisinin and its derivatives inhibits growth of human ovarian cancer cells We first compared the effects of artemisinin and its 5 derivatives, artesunate, arteether, artemether, DHA, and arteannuin (10 µmol/L, 24 h exposure), on cell survival of 2 ovarian cancer cell lines, Human ovarian adenoma cells SK-OV-3 and OVCAR-432, by using MTT viability assays. As shown in Figure 1, 24 or 48 h exposure to 20 µmol/L artemisinin and its derivatives caused a loss of cell viability to different extents. Similar results were observed with trypan blue dye exclusion assays (data not shown) and in other human ovarian cancer cell lines (data not shown). It is notable that among them, DHA was the most effective and potent in inhibiting cell growth of ovarian cancer cells following 24 or 48 h exposure with a single dose of 20 µmol/L. For example, 24 h treatment with 20 µmol/L DHA reduced cell viability to approximately 50%, while 48 h exposure caused about a 90% loss of cell viability compared to the untreated control. Thus, DHA was used for subsequent studies. These findings indicate that artemisinin and it’s derivatives examined can indeed be used as a new class of compounds with possible therapeutic potential in ovarian cancer.
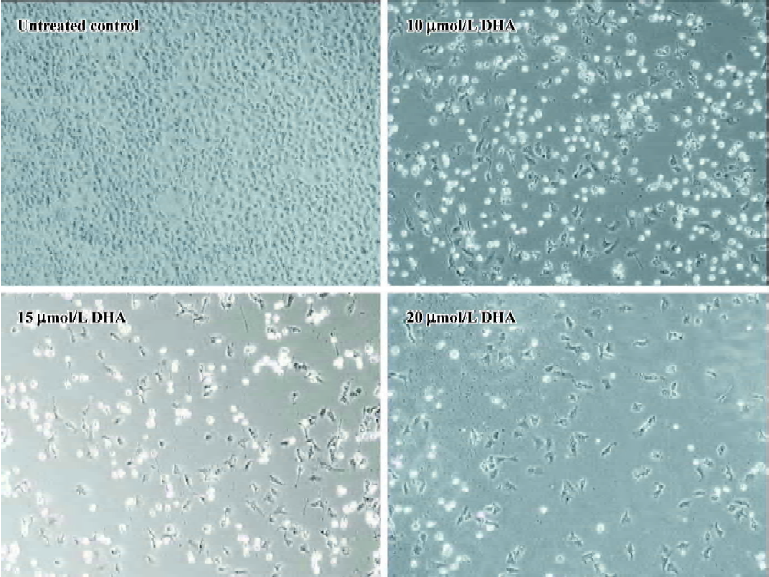
DHA inhibits cell growth in a dose- and time-dependent manner To further investigate the antitumor activity of DHA in ovarian cancer cells, we next examined the DHA inhibition of cell growth in 7 normal human ovarian epithelial cell lines and 10 human ovarian cancer cell lines. The cells were exposed to different doses of DHA for 48 h and then subjected to MTT assays. In order to easily see the different effects of DHA in a panel of the cell lines examined, Inhibitory Concentration 50% (IC50)or Inhibitory Concentration 90% (IC90), a DHA dose required to cause 50% or 90% of cell viability loss, in each cell line were calculated. As summarized in Table 1 and Figure 2, although DHA showed an inhibitive activity of cell growth in all examined cell lines, normal ovarian epithelial cell lines were much more resistant to DHA treatment than ovarian cancer cell lines. Among them, ovarian cancer cell line HEY is the most sensitive to DHA, while normal ovarian cell line HOSE642 was the most resistant. For example, 5.51 and 11.13 µmol/L DHA were respectively required for IC50 and IC90 in ovarian cancer cell line HEY compared to 54.9 µmol/L and 99.8 µmol/L, for IC50 and IC90 in normal ovarian cell line HOSE642 (a 10-fold difference, P<0.005). Typical survival curves in 2 ovarian cancer cell lines, OVCA-432 and SK-OV-3, following 24 or 48 hr exposure to DHA, are shown in Figure 3. Moreover, a significant morphology change in DHA-treated cells was able to be seen in a dose-dependent manner (Figure 4).
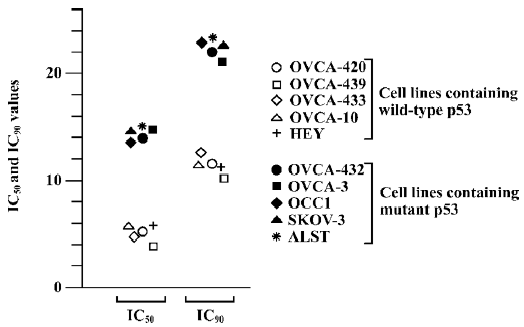

It was noted that among the human ovarian cancer cells examined, the cell lines having wild-type (functional) p53 gene status were more sensitive to DHA compared to the cell lines containing mutations of p53 or null p53 status. For instance, 3.83 and 10.13 µmol/L were required for IC50 and IC90 in wild-type p53 cell line OVCA-439, while the IC50 and IC90 were 15.2 µmol/L and 23.15 µmol/L in mutant p53 cell line ALST. The means of IC50 and IC90 in the 5 cell lines with wild-type p53 respectively were 5.04±0.52 and 11.52±0.4, but the mean of IC50 and IC90 in the 5 cell lines with mutant p53 were 14.5±0.39 and 22.36±0.49 (about 2–3-fold, P<0.01). It is obvious that p53 mediates cell susceptibility of ovarian cancer to DHA treatment. In other words, p53 gene status is an important determinant of DHA chemosensitivity and p53 mutations are often associated with decreased sensitivity to DHA in ovarian cancer.
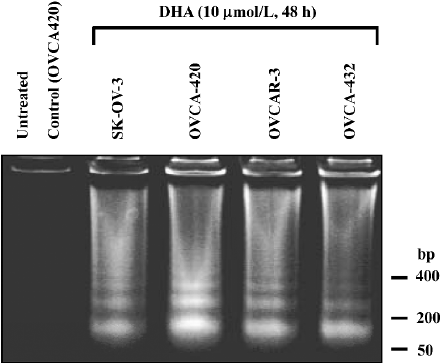
DHA induces apoptosis and cell cycle arrest We investigated whether DHA, like many anticancer drugs in ovarian cancer therapy, induced apoptosis. Four ovarian cancer cell lines, OVCA-420, OVCA-432, SK-OV-3, and OVCAR-3, were untreated and treated with 10 µmol/L DHA for 48 h, and the cells were collected for DNA fragmentation determination by using DNA fragmentation gel electrophoresis assay. As shown in Figure 5, DHA treatment induced a significant apoptosis (DNA ladders) in all 4 cell lines containing either wild-type or mutant p53. Similar results with apoptosis induction were observed in other cell lines treated with DHA, including cell lines containing p53 mutation (data not shown).
To further determine the apoptosis induction, flow cytometry assay was performed in OVCA-420 cells treated with DHA at various doses (0–15 µmol/L) for 48 h as described in Materials and methods. Apoptotic cells contain less than 2 N DNA content and appear as a sub-G1 cell population. As shown in Figure 6, a significant accumulation of sub-G1 cells was detected in the cells treated with increased doses of DHA, which was consistent with our apoptosis data using DNA fragmentation gel electrophoresis assays (Figure 5). For example, only 10% of sub-G1 cells were shown with 2.5 µmol/L DHA, however, 47% of sub-G1 cells were seen following treatment with 15 µmol/L DHA.
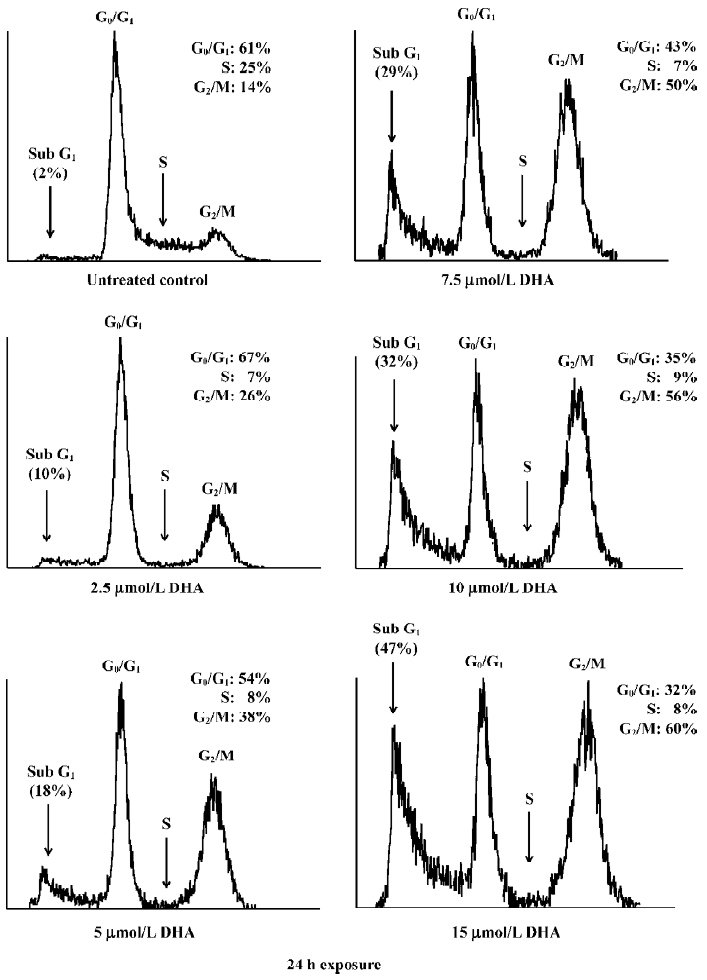
DHA also caused an arrest of cell cycle progression. DHA treatment resulted in a gradual G1 and G2/M arrest with increased doses, that is, an increase of both G1 and G2 peaks (Figure 6). For example, 56% of cells were arrested at the G2/M phase following 15 µmol/L exposure of DHA, while only 26% of cells were at the G2/M phase after treatment with 2.5 µmol/L DHA. In contrast, the population of the G0/G1 phase decreased with increasing doses of DHA. For example, 32% of cells were arrested at the G0/G1 phase following 15 µmol/L exposure of DHA, while 67% of cells were at the G0/G1 phase after treatment with 2.5 µmol/L DHA. Similar results were obtained with other human ovarian cancer cell lines (data not shown). These findings indicate that cell cycle arrest and apoptosis induction may be important mechanisms for antitumor cell growth activity of DHA in ovarian cancer.
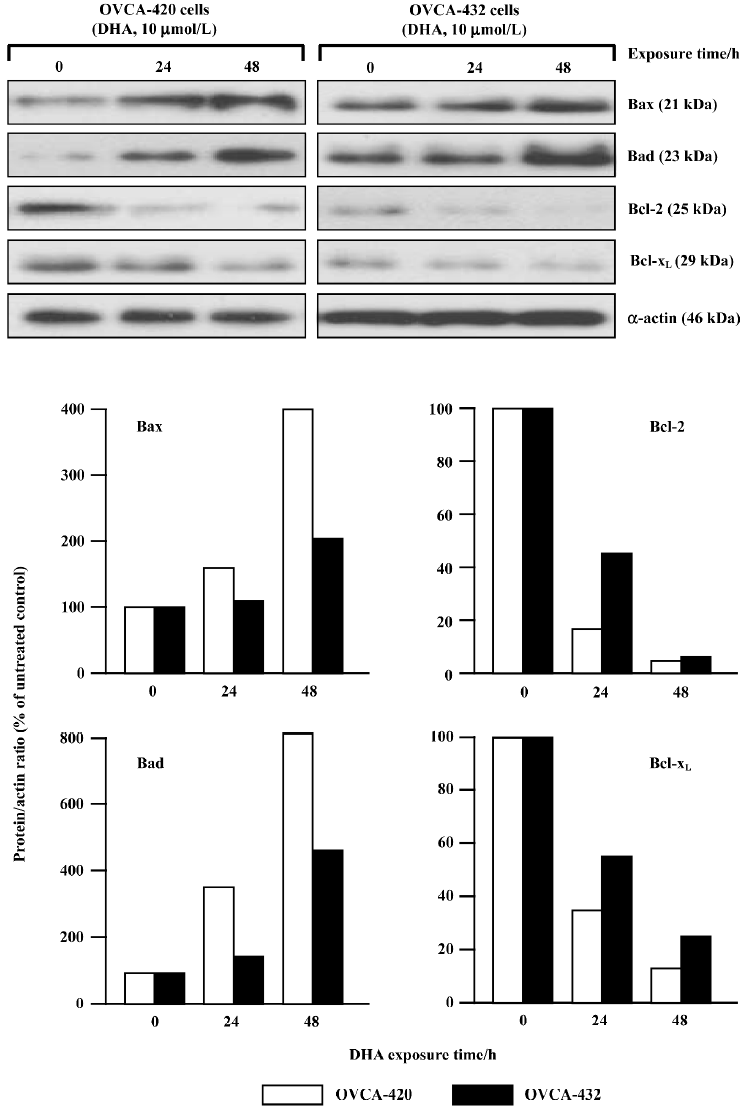
DHA targets the Bcl-2 family for apoptosis induction To study the possible contribution of the Bcl-2 gene family to DHA-induced apoptosis, the effects of DHA on several members of the Bcl-2 gene family were examined, including 2 apoptotic inhibitors Bcl-2 and Bcl-xL and 2 apoptotic promoters Bax and Bad. OVCA-420 and OVCA-432 cells were exposed to 24 or 48 h of 10 µmol/L DHA exposure, collected, and subjected to protein expression analysis by Western blot assays and mRNA expression analysis by RT-PCR assays. As shown in Figure 7, an increase of 2 promoter proteins, Bax and Bad, was detectable in both OVCA-420 and OVCA-432 cells after DHA treatment. However, DHA significantly reduced 2 antiapoptotic proteins, Bcl-2 and Bcl-xL, in both cell lines. Moreover, the alterations of these proteins were time-dependent. For example, a 54% decrease of Bcl-xL protein expression appeared in OVCA-420 cells following 24 h exposure to DHA, while a 27% decrease of Bcl-xL protein expression occurred in response to 48 h treatment of DHA.
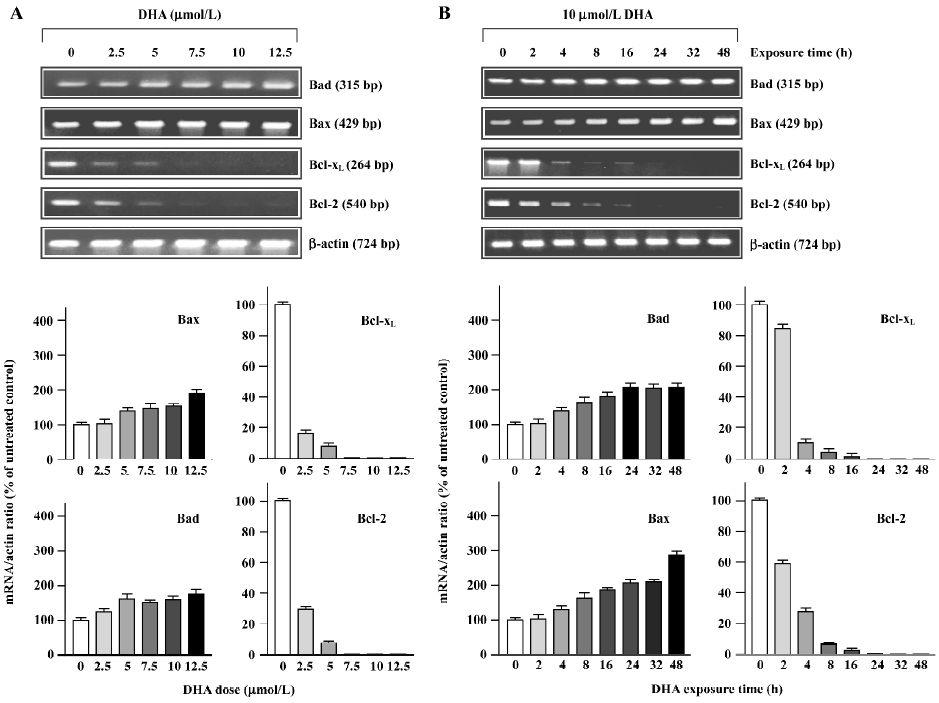
The alterations of mRNA expression in OVCA-420 cells treated with DHA are shown in Figure 8, as determined with RT-PCR assays. 2.5 µmol/L DHA caused a significant decrease of Bcl-xL and Bcl-2 mRNA. Moreover, both Bcl-xL and Bcl-2 mRNA became undetectable after 5–7.5 µmol/L treatment (Figure 8A). Both Bcl-2 and Bcl-xL mRNA expression started to decline 2 h after DHA addition to the medium and became undetectable 16–24 h following 10 µmol/L DHA treatment (Figure 8B). Both Bax and Bad mRNA expressions were elevated in response to higher doses of DHA (Figure 8A) and later time points following DHA exposure (Figure 8B). These results with protein expression results indicate that DHA regulates members of the Bcl-2 gene family at both the transcription and post-transcription levels.
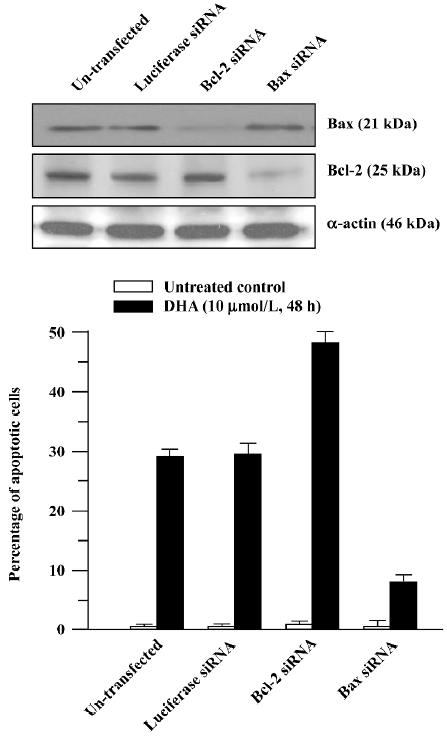
To further determine the role of the Bcl-2 family in DHA antitumor cancer activity, Bcl-2 siRNA and Bax siRNA were employed. RNAi is the process where the introduction of double stranded RNA into a cell inhibits gene expression in a sequence-dependent fashion. RNAi is usually described as a post-transcriptional, gene-silencing mechanism in which dsRNA triggers the degradation of homologous messenger RNA. The mediators of RNAi are 21- and 23-nucleotide siRNA that bind to a ribonuclease complex called RNA-induced silencing complex (RISC), which guides the small dsRNA to its homologous mRNA target. Consequently, RISC cuts the mRNA approximately in the middle of the region paired with the antisense siRNA, after which the mRNA is further degraded. As shown in Figure 9A, transfection of Bcl-2 siRNA or Bax siRNA significantly reduced the Bcl-2 or Bax protein level. The cells transfected with Bcl-2 siRNA exhibited a significantly increased sensitivity to the DHA-induced apoptosis compared to the untransfected control cells (Figure 9B), that is, more apoptotic cells were observed in the Bcl-2 siRNA-transfected cells than in the control cells (49% vs 28%, P<0.01). In contrast, the decreased sensitivity obtained in the cells transfected with Bax siRNA in response to DHA caused apoptosis in comparison with the control cells, that is, 8% of apoptotic cells vs 28% of apoptotic cells (P<0.01). However, transfection of luciferase siRNA did not produce any effect on DHA-triggered apoptosis. These results suggest that the Bcl-2 gene family, at least Bcl-2 and Bax, is an important target in DHA induction of apoptosis in ovarian cancer cells.
Discussion
Although it has been reported that artemisinin inhibits cell proliferation in breast cancer and other types of cancers[4–22], it is still not known whether artemisinin and its derivatives work as growth inhibitors in ovarian cancer cells. Our results in this study suggest that artemisinin and its 5 derivatives examined, including artesunate, arteether, artemether, arteannuin, and DHA, differentially inhibit cell growth in human ovarian cancer. DHA is the most effective one in the inhibition of ovarian cancer cell division among them. Moreover, DHA inhibits growth of human ovarian cancer cells by doses at micromolar levels (Table 1 and Figures 1–3), but these doses of DHA exhibit little or no significant cytotoxicity in normal ovarian cells (Table 1).
Another important result from this study is that p53 gene status may be an important regulator in ovarian cancer cell susceptibility to DHA. Ovarian cancer cells with wild-type (functional) p53 gene status exhibit a higher sensitivity to DHA than ovarian cancer cells with mutant or null p53 gene status (Table 1 and Figure 2). It has been well known that the tumor suppressor protein p53 plays a central role in the regulation of cell cycle arrest and cell death[29] and also plays an important role in modulating radiosensitivity and chemosensitivity of tumor cells, including ovarian cancer[30–32]. Thus, the different response to DRAT in ovarian cancer cells with different p53 gene status will be valuable in determining the actual application of DHA to ovarian cancer patients in clinics, since the p53 gene is the most frequently mutated gene in human cancers (including ovarian cancer), specifically at later stages for invasive cancers[33,34]. The role of p53 in DHA sensitivity of ovarian cancer cells will be needed for further study.
Cell death has been shown to occur by 2 major mechanisms, necrosis and apoptosis (a programmed cell death). Classical necrotic cell death occurs due to noxious injury or trauma, while apoptosis takes place during normal cell development, regulating cellular differentiation and number. While necrotic cell death results in cell lysis, cellular apoptosis is characterized morphologically by cell shrinkage, nuclear pyknosis, chromatin condensation, and blebbing of the plasma membrane. It seems that all known anticancer drugs kill cancer cells predominantly through apoptosis[35,36]. A cascade of molecular and biochemical events has been identified, including the activation of an endogenous endonuclease that cleaves DNA into oligonucleosomes detectable as a ladder of DNA fragments in agarose gels. Typically, the DNA of apoptotic cells is cleaved into a population of fragments composed of multimers that are 180–200 bp in length. These multimeric fragments are readily observed on agarose gels as a “ladder”, thus, observation of oligonucleo-somal DNA fragments by DNA laddering has long been the most acceptable assay used for the detection of apoptosis. DHA triggers significant “DNA fragments” as shown by agarose gels (Figure 5) and induces the sub-G1 phase as determined by flow cytometry (Figure 6). DHA also cause dose-dependent G2 arrest, although the involved mechanisms is unclear. Thus, cell cycle arrest and apoptosis might be responsible, at least in part, to DHA inhibition of cell growth in ovarian cancer as a working model presented in Figure 9.
It is now well established that members of the Bcl-2 family are the most prominent regulators of apoptosis in a variety of cell types, including cancer cells[37–39]. A large number of antitumor drugs cause apoptosis via the regulation of the Bcl-2 gene family[40]. The Bcl-2 family consists of a growing number of proteins, which contain 4 conserved Bcl-2 homology domains (Bcl-2 Homology (BH)1, BH2, BH3, and BH4), together with a transmembrane domain, all being identified as crucial for the regulation of apoptosis. Based on functional studies and the retention of BH domains, the Bcl-2 family can be divided into 3 subgroups[39]. The Bcl-2 subgroup includes all anti-apoptotic proteins, such as Bcl-2 and Bcl-xL. The Bax subgroup consists of pro-apoptosis members, such as Bax and Bad. Both groups contain more than 1 BH domain. The third subgroup contains only BH3 proteins, such as Bid and Bim, which can interact with either anti-apoptotic proteins or proapoptosis members and promote apoptosis. Our observations have demonstrated that during the induction of apoptosis, DHA downregulates Bcl-2 and Bcl-xL and upregulates Bax and Bad at both the mRNA and protein levels (Figures 7 and 8). Furthermore, as expected, silencing Bcl-2 or Bax increases or reduces cell sensitivity to DHA-induced apoptosis (Figure 9). Therefore, these results with gain of function or a loss of function demonstrate that targeting the Bcl-2 family-mediated apoptosis components is an important mechanism for DHA antitumor activity in ovarian cancer cells. Identification of mechanisms that regulate DHA-induced apoptosis might provide a new target for further therapeutic intervention of DHA to therapy of ovarian cancer.
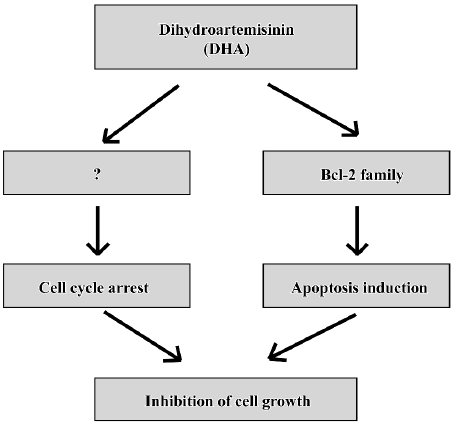
In summary, these results show for the first time that DHA inhibits cell growth via inhibiting cell cycle progression and inducing apoptosis in ovarian cancer(Figure 10) and provides evidence of potential implications for the rational application of DHA as a novel anticancer drug against ovarian cancer, although lots of work need to be done before DHA will really be utilized in clinical treatments of ovarian cancer.
References
- Tewari KS, Mehta RS, Burger RA, Yu IR, Kyshtoobayeva AS, Monk BJ, et al. Conservation of in vitro drug resistance patterns in epithelial ovarian carcinoma. Gynecol Oncol 2005;98:360-8.
- Skirnisdottir I, Garmo H, Holmberg L. Non-genital tract metastases to the ovaries presented as ovarian tumors in Sweden 1990–2003: occurrence, origin and survival compared to ovarian cancer. Gynecol Oncol 2007;105:166-71.
- Tan DS, Agarwal R, Kaye SB. Mechanisms of transcoelomic metastasis in ovarian cancer. Lancet Oncol 2006;7:925-34.
- Nam W, Tak J, Ryu JK, Jung M, Yook JI, Kim HJ, et al. Effects of artemisinin and its derivatives on growth inhibition and apoptosis of oral cancer cells. Head Neck 2007;29:335-40.
- Dell’Eva R, Pfeffer U, Vene R, Anfosso L, Forlani A, Albini A, et al. Inhibition of angiogenesis in vivo and growth of Kaposi’s sarcoma xenograft tumors by the anti-malarial artesunate. Biochem Pharmacol 2004;68:2359-66.
- Lee J, Zhou HJ, Wu XH. Artemisinin induces apoptosis in human cancer cells. Anticancer Res 2004;24:2277-80.
- Singh NP, Lai H. Selective toxicity of dihydroartemisinin and holotransferrin toward human breast cancer cells. Life Sci 2001;70:49-56.
- Efferth T, Olbrich A, Bauer R. mRNA expression profiles for the response of human tumor cell lines to the antimalarial drugs artesunate, arteether, and artemether. Biochem Pharmacol 2002;64:617-23.
- Yamachika E, Habte T, Oda D. Artemisinin: an alternative treatment for oral squamous cell carcinoma. Anticancer Res 2004;24:2153-60.
- Chen HH, Zhou HJ, Fang X. Inhibition of human cancer cell line growth and human umbilical vein endothelial cell angiogenesis by artemisinin derivatives in vitro. Pharmacol Res 2003;48:231-6.
- Xie B, Ling JJ. Anti-tumor activity of artemisinin and its derivatives. J Guangzhou Univ Tradit Chin Med 2005;22:75-7. Chinese..
- Liu X. Studies on artemisinin and its derivatives. Guangxi Med J 2003;25:1950-9. Chinese..
- Sun WC, Han JX, Yang WY. The in vitro anti-tumor effect of four artemisinic acid and artesunate B derivatives. Acta Pharmacol Sin 1992;13:541-3. Chinese..
- Yang XP, Pan QC, Liang YJ. The anti-tumor activity of sodium artesunate. Chin J Cancer 1997;16:186-9. Chinese..
- Lin F, Qian ZY, Xue HW, Ding J, Lin LP. Comparison of inhibitory effects between artemisinin and artemisunate on proliferation of MCF-7 cells in vitro. Chin Tradit Herb Drugs 2003;4:347-9. Chinese..
- Zhang JX, Wang SX, Zhang FG, Zhang YH. Primary study of effect of hypoxic killing and radiation sensitivity of artemisinin on human cervical cancer cell. Chin J Cancer 2001;20:1363-6. Chinese..
- Dong HY, Wang ZF, Song WH, Wang L, Yang BF. Apoptosis induced by artemisinin in K562 cells. Bull Chin Cancer 2003;12:473-5. Chinese..
- Yang XP, Zhang X. Induction of human tumor cell apoptosis by sodium artesunate and its molecular mechanism. Chin Tradit Herb Drugs 2002;33:819-21. Chinese..
- Wang Q, Wu LM, Zhao Y, Zhang XL, Wang NP. The anticancer effect of artesunate and its mechanism. Acta Pharm Sin 2002;37:477-8. Chinese..
- Lin F, Qian ZY, Ding J, Lin LP. Effect of dihydroartemisinin on the proliferation of MCF-7 cell. Chin J New Drugs 2002;11:934-6. Chinese..
- Zhou J, Meng R, Li LM, Liu Y, Li BX, Yang BF. In vitro effect of artemisinin on human leukemia cells and primary cells. Chin J Intern Med 2003;42:713-4. Chinese..
- Posner GH, McRiner AJ, Paik IH. Anticancer and antimalarial efficacy and safety of artemisinin-derived trioxane dimers in rodents. J Med Chem 2004;47:1299-302.
- Efferth T. Molecular pharmacology and pharmacogenomics of artemisinin and its derivatives in cancer cells. Curr Drug Targets 2006;7:407-21.
- Golenser J, Waknine JH, Krugliak M, Hunt NH, Grau GE. Current perspectives on the mechanism of action of artemisinins. Int J Parasitol 2006;36:1427-41.
- Kim SJ, Kim MS, Lee JW, Lee CH, Yoo H, Shin SH, et al. Dihydroartemisinin enhances radiosensitivity of human glioma cells in vitro. J Cancer Res Clin Oncol 2006;132:129-35.
- Jung M, Tak J, Chung WY, Park KK. Antiangiogenic activity of deoxoartemisinin derivatives on chorioallantoic membrane. Bioorg Med Chem Lett 2006;16:1227-30.
- Fan S, Ma YX, Gao M, Yuan RQ, Meng Q, Goldberg ID, et al. The multisubstrate adapter Gab1 regulates hepatocyte growth factor (scatter factor)-c-Met signaling for cell survival and DNA repair. Mol Cell Biol 2001;21:4968-84.
- Fan S, Gao M, Meng Q, Laterra JJ, Symons MH, Coniglio S, et al. Role of NF-kappaB signaling in hepatocyte growth factor/scatter factor-mediated cell protection. Oncogene 2005;24:1749-66.
- Vogelstein B, Lane D, Levine AJ. Surfing the p53 network. Nature 2000;408:307-10.
- Fan S, El-Deiry WS, Bae I, Freeman J, Jondle D, Bhatia K, et al. p53 gene mutations are associated with decreased sensitivity of human lymphoma cells to DNA damaging agents. Cancer Res 1994;54:5824-30.
- El-Deiry WS. The role of p53 in chemosensitivity and radio-sensitivity. Oncogene 2003;22:7486-95.
- Cuddihy AR, Bristow RG. The p53 protein family and radiation sensitivity: Yes or no? Cancer Metastasis Rev 2004;23:237-57.
- Levine AJ. p53, the cellular gatekeeper for growth and division. Cell 1997;88:323-31.
- Levine AJ, Momand J, Finlay CA. The p53 tumour suppressor gene. Nature 1991;351:453-6.
- Bremer E, van Dam G, Kroesen BJ, de Leij L, Helfrich W. Targeted induction of apoptosis for cancer therapy: current progress and prospects. Trends Mol Med 2006;12:382-93.
- Isoldi MC, Visconti MA, Castrucci AM. Anti-cancer drugs: molecular mechanisms of action. Mini Rev Med Chem 2005;5:685-95.
- Walensky LD. BCL-2 in the crosshairs: tipping the balance of life and death. Cell Death Differ 2006;13:1339-50.
- Adams JM, Cory S. Life-or-death decisions by the Bcl-2 protein family. Trends Biochem Sci 2001;26:61-6.
- Thomadaki H, Scorilas A. BCL2 family of apoptosis-related genes: functions and clinical implications in cancer. Crit Rev Clin Lab Sci 2006;43:1-67.
- Kim R. Recent advances in understanding the cell death pathways activated by anticancer therapy. Cancer 2005;103:1551-60.