
Evaluation of hepatitis B virus replication and proteomic analysis of HepG2.2.15 cell line after cyclosporine A treatment1
Introduction
The hepatitis B virus (HBV) is regarded as one of the most fatal human pathogens, with an estimated 350 million individuals chronically infected worldwide and approximately one million deaths annually. Many chronically-infected patients gradually develop severe liver cirrhosis that may eventually progress to hepatocellular carcinoma (HCC). It has been reported that chronic HBV infection is associated with a 100-fold-higher risk of developing HCC[1], thus the HBV has been classified by the International Agency for Research on Cancer as “carcinogenic to humans”. In order to reduce the morbidity and mortality of the HBV-related disease, it is of utmost importance to understand the mechanism of HBV replication in order to identify novel targets for anti-HBV therapeutic intervention.
The HBV is a DNA virus that undergoes reverse transcription during its replication cycle. It has a unique double-stranded, circular DNA genome that is capsuled within the viral capsid and enveloped[2]. Four open reading frames, including the viral envelope, core, reverse transcriptase-polymerase, and the hepatitis B X (HBx) gene were encoded by the viral genome. The product of the X gene, termed the HBx, protein is multifunctional. In HBV replication, the HBx protein interacts with the mitochondrial permeability transition pore (MPTP), causing its opening and subsequent outflow of intra-mitochondrial calcium into the cytoplasm, followed by the activation of the cytoplasmic, calcium-dependent, proline-rich tyrosine kinase-2 and downstream Src kinase pathway to promote HBV replication. HBV replication can be significantly inhibited by MPTP blockers, cytosolic calcium chelators, and Src inhibitors, and can be rescued by calcium-mobilizing regents[3–5]. The HepG2.2.15 cell line, a HepG2 human hepatoma cell line derivative which was stably transfected with a plasmid containing 2 head-to-tail dimers of the HBV genome, can not only release high levels of hepatitis B surface antigens (HBsAg) and hepatitis B e antigens (HBeAg) into supernatants, but also supports the assembly and secretion of replicative intermediates of HBV DNA and Dane particles during culture[6,7]. This provides us with a useful in vitro model to study the impact on HBV replication by various reagents, as well as the mechanisms that may be involved.
Recent studies have demonstrated that cyclosporine A (CsA) can inhibit HBV replication in vitro[4,5]. It is hypothesized that CsA can predominantly bind to mitochondrial cyclophilin, inhibit the MPTP opening, and disrupt the mitochondrial calcium signaling to inhibit HBV replication[8]. CsA targets the mitochondria, which is located upstream in the cellular signaling pathways and influence HBV replication. In the current study, we examined the effect of CsA on HBV replication in vitro and the mechanisms involved. In addition, a proteomic analysis was used to assess the large-scale protein expression profile of HepG2.2.15 cells after CsA treatment in order to identify some key proteins that may play critical roles in HBV replication and also discover some potential targets for novel anti-HBV agents.
Materials and methods
Cell culture HepG2.2.15 cells were cultured in RPMI-1640 medium (Hyclone, Logan, USA) supplemented with 10% fetal bovine serum (FBS; Gibco, Carlsbad, CA,USA) and 200 mg/L G418 (Sigma, St Louis, MO, USA) at an atmosphere of 5% CO2 at 37 °C. Subconfluent monolayer HepG2.2.15 cells were harvested from the culture dishes by trypsin treatment and then plated onto 6-well flat bottom plates at a density of 1×10⁶ cells per well. 24 h later, the cells were treated by CsA at different concentrations (0, 0.6, 1.3, 2.5, 5.0, and 10.0 µg/mL). The culture supernatants were collected every 24 h for ELISA analysis, and fresh mediums containing CsA at the indicated concentration were added to the culture. After CsA treatment for 4 d, the cells were harvested and intracellular DNA was isolated for slot blot hybridization using the DNA extraction kit (QIAGEN, Hilden, Germany) according to the manufacturer’s instructions.
MTT analysis of cytotoxicity A methyl thiazolyl tetrazolium (MTT) test was used to evaluate the cytotoxicity of CsA. HepG2.2.15 cells were first cultured in a 96-well microplate (1×10⁴ cells/well) in 100 µL complete RPMI-1640 for 12 h. The cells were then treated with the indicated concentration of CsA in FBS-free Minimum Essential medium (MEM) for 96 h. By the end of the incubation, 25 µL MTT (5 mg/mL) was added to each well and incubation was allowed to continue for another 4 h. Finally, 100 µL DMSO was added to each well. The plate was read using a microplate reader (Bio-Rad, Hercules, CA, USA) at a wavelength of 570 nm.
ELISA analysis of HBsAg and HBeAg The HBsAg and HBeAg levels in the supernatant were detected by an ELISA detecting kit (Abbott, Abbot Park, IL, USA) according to the manufacturer’s instructions. The suppression rate of the expression of HBsAg and HBeAg in the CsA-treated groups was calculated using the following formula:
Suppression rate=[A value (control)/A value (negative control) A value (CsA)/A value (negative control)]/[A value (control)/A value (negative control) 2.1]
Slot blot hybridization The HBV DNA replication level was evaluated by slot blot hybridization. Briefly, 5 µg extracted DNA was boiled to denature for 10 min and filtered with a Hoefer slot blot apparatus (San Francisco, CA, USA) on a nylon membrane according to the supplier’s protocol. For the HBV DNA probes preparation, cloned HBV complementary DNA and β-actin complementary DNA were amplified by PCR. The following primers were used in this study: HBV probe, forward: 5’-AGACTCGTGGTGGACTTCTCT-3’, reverse: 5’-GGGTTCAAATGTATACCCAAAGAC-3’; β-actin probe, forward: 5’-CGCTGCGCTGGTCGTCGACA-3’, and reverse: 5’-GTCACGCACGATTTCCGGCT-3’. The amplified probes were purified by electrophoresis from agarose gels and labeled with digoxigenin-11-dUTP using the DIG high prime kit (Roche, Mannheim, Germany). Prehy-bridization, hybridization, washes after hybridization, and antidigo-xigenin-alkaline phosphatase (AP) incubation were performed as described by the manufacturers. After the membrane was visualized by chemiluminescent substrate CSPD solution with Kodak X-ray film (Kodak, Rochester, NY, USA), the same membrane was rehybridized with the other probes and exposed again. The slot blot result was quantitated by densitometry using Kodak 1D 3.6 software and the HBV DNA signal was normalized to β-actin.
2-D electrophoresis (2-DE) The cells were treated with CsA at a concentration of 5 µg/mL for 4 d and harvested by centrifugation for the protein sample preparation. Lysis buffer containing 7 mol/L urea, 2 mol/L thiourea, 4% (3-[(3-cholami-dopropyl)dimethyl-ammonio]-1-propanesulfonate) (CHAPS), 1% DTT, 2% immobilized pH gradient (IPG) buffer (pH 3~10 liner, Amersham Biosciences,Uppsala, Sweden), and a protease inhibitor cocktail (Complete tablets, Roche, Mannheim,Germany) were mixed with the harvested cells and incubated for 20 min at room temperature. Nucleic acids were removed by centrifugation at 50 000×g for 30 min. 2-D electrophoresis (2-DE;Amersham Biosciences,Uppsala,Sweden). was performed according to the manufacturer’s instructions. In brief, the samples containing the lysis buffer were mixed with the rehydration solution [8 mol/L urea, 2% CHAPS, 20 mmol/L DTT, 0.5% IPG buffer (pH 3~10 non-linear), and 0.002% bromophenol blue] to a total volume of 450 µL, and subjected to Isoelectric focusing (IEF) on an IPG strip. Rehydration and IEF were carried out on the Amersham Biosciences IPGphor as follows: rehydation with 30 V for 12 h, 500 V for 1 h, 1000 V for 1 h, 1000–8000 V for 30 min, and 8000 V was applied until the total volt hours reached 72.0 kVh at 20 °C. After IEF separation, the strips were equilibrated for 15 min in SDS equilibration buffer (50 mmol/L Tris-HCl, 6 mol/L urea, 30% glycerol, 2% SDS, and 0.002% bromophenol blue) containing 1% DTT, followed by SDS equilibration buffer containing 2.5% iodoacetamide for another 15 min. After equili-bration, the strips were loaded onto vertical SDS-PAGE (12.5% T constant). The 2-D SDS electrophoresis was run using the Ettan DALTsix electrophoresis unit (Amersham Biosciences,Uppsala,Sweden). Three independent experiments were carried out in this study. The experiments of each treatment group (control or CsA-treated) were repeated 3 times.
Silver staining and image analysis Silver staining was done according to the protocol of Yan et al[9] with minor modifications (substitution of ethanol for methanol in fixation). All chemicals used in silver staining were purchased from Sigma (USA). Silver-stained gels were scanned using an ImageScanner (Amersham Biosciences,Uppsala,Sweden) and analyzed with the ImageMaster 2D Elite software. Six gels were divided into 2 groups, 3 for the controls and 3 for the CsA-treated cells. Image spots were initially detected; the background was subtracted, followed by volume normalization, and spots matched by manual assistance. Three gel images of the control group were averaged and set as the reference gel. The protein spots were quantitated based upon their relative volume. Only the spots with expression levels greater than 2-fold were considered significant and selected for the mass spectrometry analysis.
In-gel digestion, matrix-assisted laser desorption/ionization-time of flight mass spectrometry analysis and protein identification The protein spots were excised from different gels and transferred into Eppendorf tubes (Gilson, Villiers, Le Bel, France). Each spot was washed twice in milli-Q water, destained by washing with a 1:1 solution of 30 mmol/L potassium ferricyanide and 100 mmol/L sodium thiosulfate, and equilibrated in 200 mmol/L ammonium bicarbonate for 20 min to a pH of 8.0. The gels were then washed twice in milli-Q water, dehydrated by the addition of acetonitrile, and dried in a SpeedVac (Thermo Savant, Holbrook, NY, USA). Subse-quently, the gels were rehydrated in 10 µL proteomics grade trypsin (Sigma, St Louis, MO, USA) solution (20 ng/µL in 40 mmol/L NH4HCO3 in 9% acetonitrile, ACN) and incubated at 37 °C for 10 h. The peptides were extracted by adding 50 µL of solution containing 50% ACN and 5% trifluoroacetic acid (TFA). The extracted solutions were dried in a lyophilizer and reconstituted in 5 µL 0.1% TFA solution (Virtis, Gardiner, NY, USA).
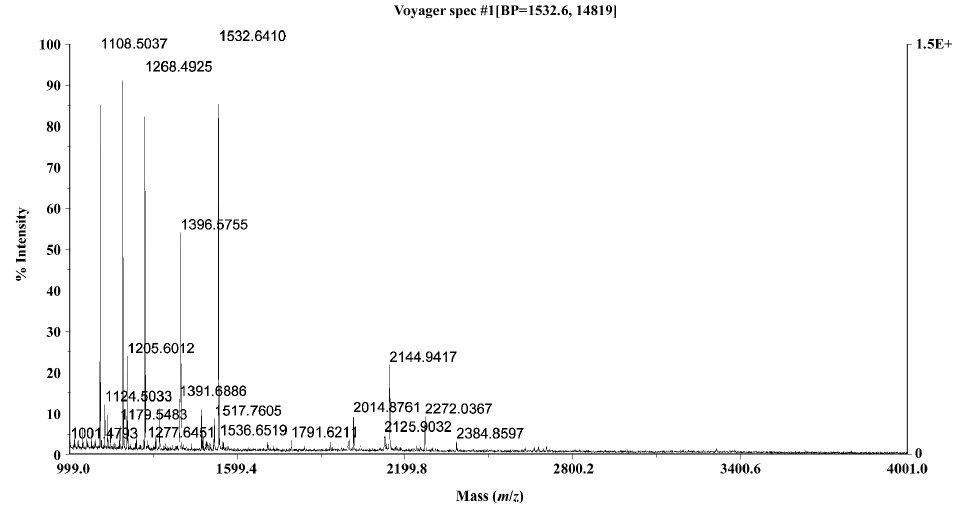
One µL of peptide mixture was mixed with an equal volume of 10 mg/mL alpha-Cyano-4-hydroxycinnamic acid (Sigma, USA) saturated with 50% ACN in 0.05% TFA and analyzed with a Voyager-DE STR matrix-assisted laser desorption/ionization-time of flight mass spectrometry (MALDI-TOF MS) using a delayed ion extraction and ion mirror reflector mass spectrometer (Applied Biosystems, Foster City, CA, USA). The instrument setting was set at reflector mode with a 160 ns delay extraction time, positive polarity, 63.5% grid voltage, and 20 000 V accelerating voltage. Laser shots at 200 per spectrum were used to acquire the spectra with mass range from 1000~4000 Da. External calibration was carried out using insulin chain B oxidized and P14R (Sigma, St Louis, MO, USA) and the internal calibration was performed using the autolytic peaks of trypsin.
For the interpretation of the mass spectra data, the monoisotopic peptide masses were input into Mascot (http://www.Matrixscience.com). A database search (NCBInr) was performed using the following words: homo sapiens/human, trypsin digest (we allowed for up to 1 missed cleavage), cysteines modified by carbamidomethylation, and 100 ppm mass tolerance using internal calibration.
Western blot analysis After SDS-PAGE, the gels were transferred electrophoretically onto a nitrocellulose membrane (Amersham Biosciences,Uppsala, Sweden) and blocked for 2 h with Tris-buffered saline (TBS) containing 5% skim milk. The primary antibody used was goat anti-human eukaryotic translation initiation factor (eIF)-5A (Santa Cruz, CA, USA; 1:500 dilution). The membranes were incubated with the primary antibody overnight at 4 °C, washed 3 times with TBS containing 0.1% Tween-20, and then the membrane was incubated with horseradish peroxidase-conjugated anti-goat secondary antibody (Chemicom, Temecula, CA, USA) 1:2000 for 1 h at room temperature, and developed with a chemiluminescence reagent (EZ-ECL chemiluminescence detection kit, Beit-Haemek, Israel). Detecting actin (Santa Cruz Biotechnology Inc, Santa Cruz, CA, USA) acted as the loading control. Images were acquired on an image station 2000R (Kodak, Rochester, NY,USA) and analyzed with the software supplied by the manufacturer.
Statistics The data of the ELISA analysis and slot blot hybridization were expressed as mean±SD. One-way ANOVA of Dunnett’s test was used to analyze the significance between the control and the CsA-treated groups A bivariate correlate analysis was used to analyze the correlation between the CsA concentrations and HBV replication levels. The statistical significance in terms of the expression profiles of HepG2.2.15 cells with or without CsA treatment was estimated by the Student’s t-test. All calculations were done with SPSS 11.5 software (SPSS, Chicago, IL, USA). P<0.05 was considered statistically significant.
Results
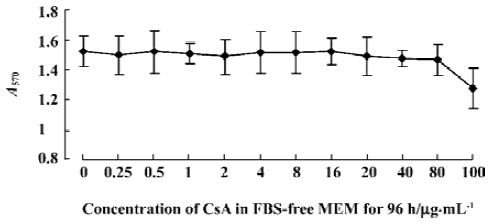
No apparent cytotoxicity of CsA on the HepG2.2.15 cell line at low concentrations Before we studied the effect of CsA on HBV replication in vitro, we first wanted to determine whether CsA had direct toxicity on the HepG2.2.15 cell line. The cells were incubated with CsA at graded concentrations of 0 (vehicle control), 0.25, 0.5, 1, 2, 4, 8, 16, 20, 40, 80, and 100 µg/mL. The cytotoxicity of CsA on HepG2.2.15 cells was evaluated by MTT test. As shown in Figure 1, HepG2.2.15 remained viable in the presence of 0–80 µg/mL CsA treatment. When the final concentration of CsA was increased to 100 µg/mL, there was a mild decrease in the optical density value, indicating that CsA causes little toxicity on HepG2.2.15 cells at low concentrations (<80 µg/mL), but has a direct toxic effect with a concentration higher than 100 µg/mL. Thus, we used low concentrations of CsA to study its effect on HBV replication using this in vitro model system.
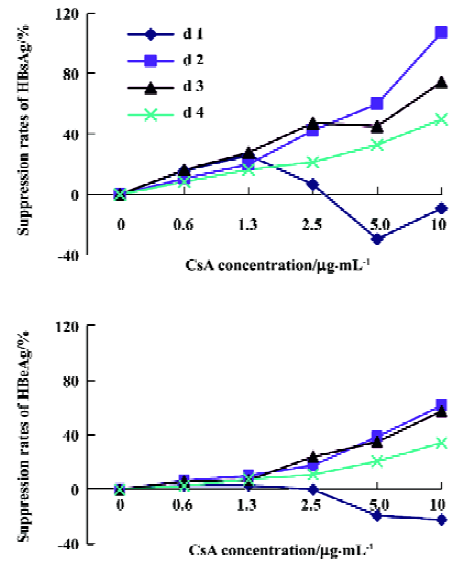
CsA inhibits the expression of HBsAg and HBeAg To investigate the effect of CsA on the production of HBeAg and HBeAb by HepG2.2.15 cells, the supernatant was collected after treatment with different concentrations of CsA at different times, and the titer of HBsAg and HBeAg was determined by ELISA. Our results showed that CsA could inhibit the expression of HBsAg and HBeAg in a dose-dependent manner; a further bivariate correlation analysis showed positive correlation between the suppression rates of viral antigens and CsA concentration. After the CsA treatment, the correlation index was 0.401, 0.816, 0.940, and 0.938, respectively, for HBsAg, and the P-value was 0.058, 0.000, 0.000, and 0.000, respectively; the correlation index was 0.405, 0.983, 0.963, and 0.979, respectively, for HBeAg, and the P-value was 0.069, 0.000, 0.000, and 0.000, respectively (Figure 2). These results indicate that CsA is able to dose-dependently inhibit HBsAg and HBeAg production in vitro.
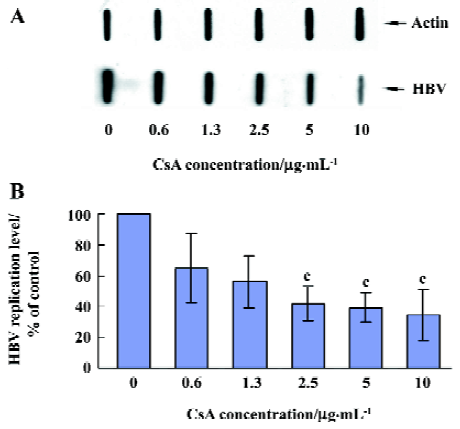
CsA inhibits HBV DNA replication We were also interested in whether CsA has a direct effect on HBV DNA replication in vitro. After treatment with CsA at different concentrations for 4 d, the HepG2.2.15 cells were harvested and intracellular DNA was extracted for the slot blot hybridization to evaluate the HBV DNA replication level. As shown in Figure 3, CsA significantly inhibited the HBV DNA replication. The replication levels in 2.5, 5.0, and 10.0 µg/mL CsA-treated groups were significantly low compared to the control groups (P=0.020, 0.014, and 0.048, respectively), and there was a negative correlation between the HBV DNA replication level and the different concentrations of CsA (correlation index -0.770, P=0.000).
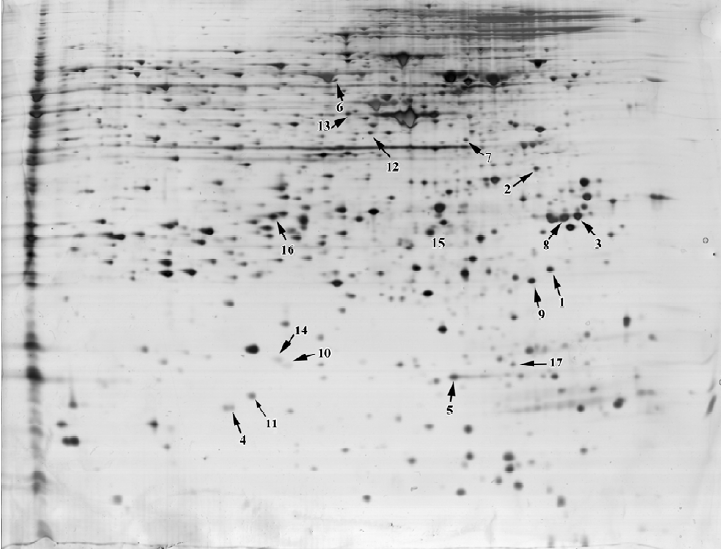
Differential analysis of 2-DE protein profiles in the control and CsA-treated HepG2.2.15 cells To further investigate the alteration of the protein expression in HepG2.2.15 after CsA treatment in vitro, protein lysates from the control and CsA-treated HepG2.2.15 cells were subjected to 2-DE. Following silver staining, the gels were digitized prior to computer-based matching and quantitative analysis with image analysis software. We found that the intensity of 17 protein spots were altered after CsA treatment, eleven of which were identified. Among them, 6 proteins were upregulated, 4 were downregulated, and 1 was shifted (Figure 4).
Identification of proteins by MALDI-TOF MS and database searching In order to identify key proteins that may play a critical role in HBV replication and also to explore some potential targets for novel anti-HBV agents, the 17 protein spots with altered intensity as a result of CsA treatment were excised from the gels, digested with trypsin, and subsequently analyzed by MALDI-TOF MS using the MS-Fit software to search the nrNCBI database. Eleven of the protein spots were identified. Among them, 6 were upregul-ated, 4 were downregulated, and 1 was shifted after treatment (Table 1). The identified proteins represented a heterogeneous group that included several important molecules relevant to gene transcription regulation, such as eIF, proteins involved in signal transduction such as the 14.3.3 protein (Figure 5), stathmin 1/oncoprotein 18, and ubiquitin-specific protease otubain 1. The functions of the remaining proteins are still not clear.
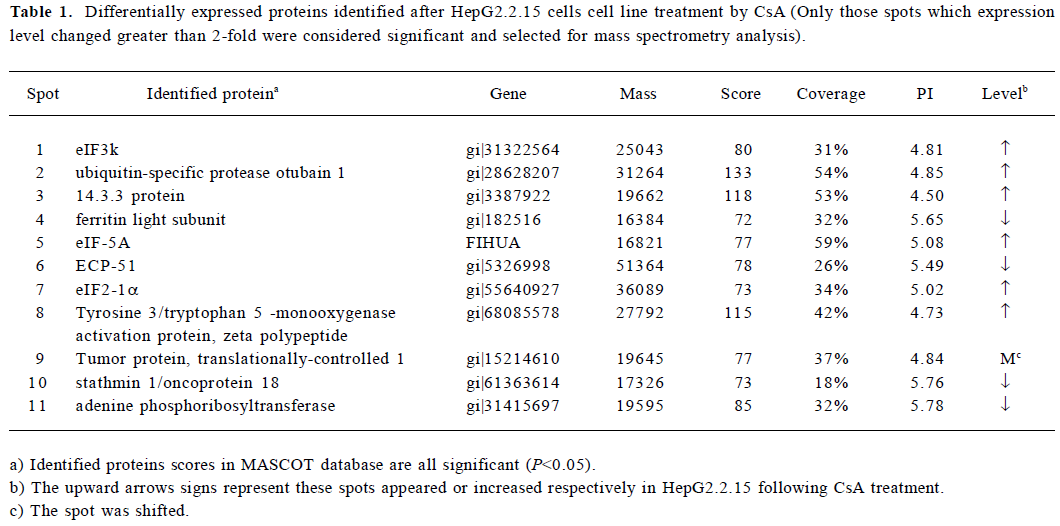
Full table
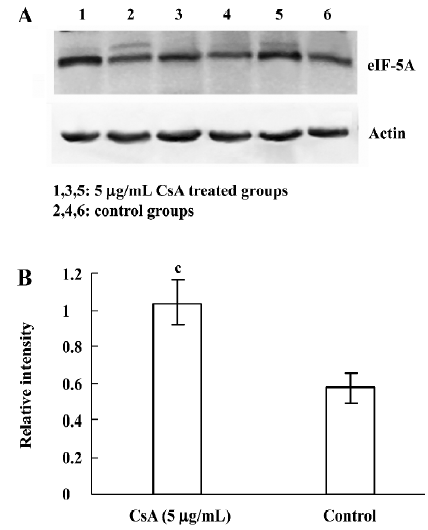
Detection of identified proteins by Western blot analysis From the identified candidates, eIF-5A was detected by Western blot analysis. The results are shown in Figure 6. The expression changes of eIF-5A were basically consistent with the 2-DE results. eIF-5A was upregulated in 5 µg/mL CsA treatment (P=0.008).
Discussion
In our study, an ELISA analysis was used to evaluate the expression of HBsAg and HBeAg in the supernatants of HepG2.2.15 cells treated by CsA, while a slot blot analysis of HBV DNA was performed to evaluate the HBV replication level. As mentioned earlier, the expression level of HBsAg, HBeAg, as well as HBV DNA replication dramatically decreased in the presence of CsA in a dose-dependent manner, suggesting that CsA was able to significantly inhibit HBV replication in this in vitro culture system.
HBV replication is a multi-step process requiring fine-tuning of numerous viral and cellular proteins. During replication, the viral HBx protein can mobilize the intra-mitochondrial calcium into the cytoplasm, activate intracellular calcium signaling, followed by the activation of the Src kinase and downstream unknown signal transduction messengers, thus promoting HBV DNA replication[3,4]. The specific blocker of MPTP, CsA, can impair the interaction of the HBx protein with the mitochondria[8], inhibit subsequent MPTP openings, and block the intracellular calcium signaling pathway[10,11]. Based on the fact that CsA is involved in the interaction between HBx and the mitochondria, a key point lies upstream of the HBV replicative signaling pathway. The different protein expression profiles between the CsA-treated and untreated groups may provide some clues to probe the mechanisms of the inhibitory action of CsA on HBV replication, and possibly identify some key factors involved in HBV replication and novel targets for anti-HBV therapy.Among these proteins with altered expression levels after CsA treatment, 11 protein spots were identified with high confidence by peptide mass fingerprinting. The remaining proteins failed to be identified mainly because the low protein abundance was not enough to produce a good signal to the noise spectrum, or the result scores of the database search was too low to achieve significant results. Among the identified proteins, we were particularly interested in protein kinase 14-3-3, signal transduction messenger stathmin 1/oncoprotein 18, ubiquitin-specific protease otubain 1, and eIF.
14-3-3 kinases are highly conserved, ubiquitously expressed[12], and multifunctional in controlling intracellular signaling pathways via binding to various ligands such as the Bad protein and p53 in apoptosis[13,14], Cdc 25 and telomerase in cell life cycle [15,16] . In virology studies, it has been identified that 14-3-3 facilitates the complex formation of the Vpr protein of HIV-1 with Cdc25 to regulate the host cell life cycle[17]. In addition, the HCV core protein can enhance Raf-1 kinase activity via interaction with 14-3-3 to regulate hepatocyte growth[18]. Analyses of the HBx protein sequence reveal that HBx contains a 14-3-3 binding do-main[19,20]. This binding is essential for the formation of a complex composed of Mitogen-activated protein kinase kinase 1(MEKK1), stress kinase 1 (SEK1), stress-activated protein kinases (SAPK), 14-3-3 proteins and HBx, which can subsequently upregulate SAPK activity[21]. CsA not only blocks the activation of the MEKK1-SAPK pathway[22], but also interferes in the intracellular calcium signaling pathway which is essential for the interaction between 14-3-3 proteins and their partners[23]. Since calcium signaling is involved not only in the HBx activation of HBV replication, but also in the mechanisms of the inhibition of CsA on HBV replication and the interaction of 14-3-3 kinases with their partners, we speculate that 14-3-3 may play a pivotal role in HBV replication and become a potential target for new anti-HBV intervention. Stathmin 1/oncoprotein 18 has dual meanings: “oncoprotein 18” means that it is highly expressed in numerous malignant tumors[24–27], and “stathmin 1” is derived from the Greek word “relay”, indicating its intermediate role in signal transduction. As an intracellular relay for signal transduction, stathmin 1/oncoprotein18 is the target for numerous cellular kinases, such as the mitogen-activated protein kinase family members including extracellular signal-regulated kinase (ERK) and p38 and the Ca++/calmodulin dependent kinase, all of which be regulated in response to intracellular calcium signaling. Both of p38 and the Ca++/calmodulin dependent kinase can also be regulated by CsA[22], and the latter can be regulated by 14-3-3 kinases[28]. Thus, we hypothesize that the stathmin 1/oncoprotein 18 may play an important role in the anti-HBV action of CsA via interaction with 14-3-3 and the calcium signaling pathway.The ubiquitin-specific protease otubain 1 was also over-expressed after CsA treatment. Otubain 1 belongs to the deubiquitylating enzyme (DUB) family[31]. Like protein phosphorylation, protein ubiquitylation is critical for diverse biological processes, including signal transduction[29], and the protein ubiquitylation process can be reversed by a group of proteases known as DUB[30]. Recent studies have indicated that otubain 1 and ubiquitin are both involved in the T-cell activation process[32,33], and that ubiquitin can slightly bind to CsA as minor immunophilin[34]. So we believe there is complicated interaction between CsA, otubain 1, and ubiquitin in T-cell priming stage, but whether similar interaction exists in HBV replication remains unknown and needs to be further studied.
eIF are essential for the formation of a ribosomal initiation complex during the process of translation initiation[35]. eIF2 has been reported to mediate the host cells’ antiviral response during viral infection[36]. eIF5 is a shuttle protein mediating unspliced and incompletely-spliced RNA from the nucleus to the cytoplasm during reverse transcription, a process essential for some viruses, including HBV[37–39]. In our study, as the members of the eIF protein family, eIF2, eIF3, and eIF5 were overexpressed in 2-D maps and identified by MALDI-TOF MS. Western blotting revealed the consistent result by detecting eIF-5A (Figure 6), suggesting that these factors may participate in the cellular antiviral response; however the molecular mechanism concerning their exact role in HBV replication and the relevance to anti-HBV activity of CsA remains to be elucidated.
The translationally-controlled tumor protein (TCTP) is a highly-conserved protein that is ubiquitously expressed in all eukaryotic organisms[40]. This protein plays an important role in cell growth, cell cycle progression, malignant trans-formation, and anti-apoptosis activity. TCTP synthesis can be rapidly regulated by calcium stress, growth signals, certain cytokines, and pro-apoptotic signals; this regulation was done at both the transcriptional and translational levels[41]. In addition, 3 isoforms of TCTP have been detected, which might be caused by posttranslational modifica-tions[42]. In our study, the location of TCTP was shifted after CsA treatment, We hypothesize that this displacement may be caused by TCTP isoform formation because CsA can interfere with the intracellular calcium signal by interacting with the mitochondria as described earlier.
In conclusion, we have found that CsA was able to significantly inhibit HBV replication in vitro. We also identified a group of proteins with altered expression profiles in HepG2.2.15 cells after CsA treatment. These proteins may provide new insights to the molecular events of HBV replication and the inhibitory effect of CsA on HBV. However, more work needs to be done in order to evaluate the detailed function of particular proteins in HBV replication, as well as the potential of these proteins as novel targets for anti-HBV therapy in the future.
Acknowledgement
We thank Dr Ran TAO (Transplant Immunology, Department of Pathology and Laboratory Medicine, Children’s Hospital of Philadelphia and University of Pennsylvania, Philadelphia, PA, USA) for critical reading of the manuscript and helpful discussion.
References
- Beasley RP, Lin CC, Hwang LY, Chien CS. Hepatocellular carcinoma and hepatitis B virus: a prospective study of 22707 men in Taiwan. Lancet 1981;21:1129-33.
- Ganem D, Varmus HE. The molecular biology of the hepatitis B viruses. Annu Rev Biochem 1987;56:651-93.
- Rahmani Z, Huh KW, Lasher R, Siddiqui A. Hepatitis B virus X protein colocalizes to mitochondria with a human voltage-dependent anion channel, HVDAC3, and alters its transmembrane potential. J Virol 2000;74:2840-6.
- Bouchard MJ, Wang LH, Schneider RJ. Calcium signaling by HBx protein in hepatitis B virus DNA replication. Science 2001;294:2376-8.
- Bouchard MJ, Puro RJ, Wang LH, Schneider RJ. Activation and inhibition of cellular calcium and tyrosine kinase signaling pathways identify targets of the HBx protein involved in hepatitis B virus replication. J Virol 2003;77:7713-9.
- Sells MA, Chen ML, Acs G. Production of hepatitis B virus particles in HepG2 cells transfected with cloned hepatitis B virus DNA. Proc Natl Acad Sci USA 1987;84:1005-9.
- Sells MA, Zelent AZ, Shvartsman M, Acs G. Replicative intermediates of hepatitis B virus in HepG2 cells that produce infectious virions. J Virol 1988;62:2836-44.
- Broekemeier KM, Dempsey ME, Pfeiffer DR. Cyclosporine A is a potent inhibitor of the inner membrane permeability transition in liver mitochondria. J Biol Chem 1989;264:7826-30.
- Yan JX, Wait R, Berkelman T, Harry RA, Westbrook JA, Wheeler CH, et al. A modified silver staining protocol for visualization of proteins compatible with matrix-assisted laser desorption/ionization and electrospray ionization-mass spectrometry. Electrophoresis 2000;21:3666-72.
- Halestrap AP, McStay GP, Clarke SJ. The permeability transition pore complex: another view. Biochimie 2002;84:153-66.
- Waldmeier PC, Feldtrauer JJ, Qian T, Lemasters JJ. Inhibition of the mitochondrial permeability transition by the nonimmuno-suppressive cyclosporine derivative NIM811. Mol Pharmacol 2002;62:22-9.
- Reuther GW, Pendergast AM. The roles of 14-3-3 proteins in signal transduction. Vitam Horm 1996;52:149-75.
- Zha J, Harada H, Yang E, Jockel J, Korsmeyer SJ. Serine phosphorylation of death agonist BAD in response to survival factor results in binding to 14-3-3 not BCL-X(L). Cell 1996;87:619-28.
- Waterman MJ, Stavridi ES, Waterman JL, Halazonetis TD. ATM-dependent activation of p53 involves dephosphorylation and association with 14-3-3 proteins. Nat Genet 1998;19:175-8.
- Lopez-Girona A, Furnari B, Mondesert O, Russell P. Nuclear localization of Cdc25 is regulated by DNA damage and a 14-3-3 protein. Nature 1999;397:172-5.
- Seimiya H, Sawada H, Muramatsu Y, Shimizu M, Ohko K, Yamane K, et al. Involvement of 14-3-3 proteins in nuclear localization of telomerase. EMBO J 2000;19:2652-61.
- Kino T, Gragerov A, Valentin A, Tsopanomihalou M, Ilyina-Gragerova G, Erwin-Cohen R, et al. Vpr protein of human immunodeficiency virus type-1 binds to 14-3-3 proteins and facilitates complex formation with Cdc25C: implications for cell cycle arrest. J Virol 2005;79:2780-7.
- Aoki H, Hayashi J, Moriyama M, Arakawa Y, Hino O. Hepatitis C virus core protein interacts with 14-3-3 protein and activates the kinase Raf-1. J Virol 2000;74:1736-41.
- Ku NO, Liao J, Omary MB. Phosphorylation of human keratin 18 serine 33 regulates binding to 14-3-3 proteins. EMBO J 1998;17:1892-906.
- Yaffe MB, Rittinger K, Volinia S, Caron PR, Aitken A, Leffers H, et al. The structural basis for 14-3-3: phosphopeptide binding specificity. Cell 1997;91:961-71.
- Diao J, Khine AA, Sarangi F, Hsu E, Iorio C, Tibbles LA, et al. X protein of hepatitis B virus inhibits Fas-mediated apoptosis and is associated with up-regulation of the SAPK/JNK pathway. J Biol Chem 2000;276:8328-40.
- Matsuda S, Koyasu S. Mechanisms of action of cyclosporine. Immunopharmacology 2000;47:119-25.
- Chow CW, Davis R. Integration of calcium and cyclic AMP signaling pathways by 14-3-3. Mol Cel Biol 2000;20:702-12.
- Hanash SM, Strahler JR, Kuick R, Chu EH, Nichols D. Identification of a polypeptide associated with the malignant phenotype in acute leukemia. J Biol Chem 1988;263:12813-5.
- Curmi PA, Nogues C, Lachkar S, Carelle N, Gonthier MP, Sobel A, et al. Overexpressioin of stathmin in breast carcinomas points out to highly proliferative tumours. Br J Cancer 2000;82:142-50.
- Price DK, Ball JR, Bahrani-Mostafavi Z, Vachris JC, Kaufman JS, Naumann RW, et al. The phosphoprotein Op18/stathmin is differentially expressed in ovarian cancer. Cancer Invest 2000;18:722-30.
- Li C, Tan YX, Zhou H, Ding SJ, Li SJ, Ma DJ, et al. Proteomic analysis of hepatitis B virus-associated hepatocellular carcinoma: identification of potential tumor markers. Proteomics 2005;5:1125-39.
- McKinsey TA, Zhang CL, Olson EN. Activation of the myocyte enhancer factor-2 transcription factor by calcium/calmodulin-dependent protein kinase-stimulated binding of 14-3-3 to histone deacetylase 5. Proc Natl Acad Sci USA 2000;97:14400-5.
- Ben-Neriah Y. Regulatory functions of ubiquitination in the immune system. Nat Immunol 2002;3:20-6.
- Wilkinson KD. Regulation of ubiquitin-dependent processes by deubiquitinating enzymes. FASEB J 1997;11:1245-56.
- Balakirev MY, Tcherniuk SO, Jaquinod M, Chroboczek J. Otubains: a new family of cysteine proteases in the ubiquitin pathway. EMBO J 2003;4:517-22.
- Soares L, Seroogy C, Skrenta H, Anandasabapathy N, Lovelace P, Chung CD, et al. Two isoforms of otubain 1 regulate T cell anergy via GRAIL. Nat Immunol 2004;5:45-54.
- Cenciarelli C, Hou D, Hsu KC, Rellahan BL, Wiest DL, Smith HT, et al. Activation-induced ubiquitination of the T cell antigen receptor. Science 1992;257:795-7.
- Davis DL, Soldin SJ. Identification of ubiquitin as an immuno-philin. Biochem Biophys Res Commun 2000;277:325-9.
- Asano K, Clayton J, Shalev A, Hinnebusch AG. A multifactor complex of eukaryotic initiation factors, eIF1, eIF2, eIF3, eIF5, and initiator tRNAMet is an important translation initiation intermediate in vivo. Genes Dev 2000;14:2534-46.
- Proud CG. eIF2 and the control of cell physiology. Semin Cell Dev Biol 2005;16:3-12.
- Bevec D, Jaksche H, Oft M, Wohl T, Himmelspach M, Pacher A, et al. Inhibition of HIV-1 replication in lymphocytes by mutants of the Rev cofactor eIF-5A. Science 1996;271:1858-60.
- Hauber I, Bevec D, Heukeshoven J, Kratzer F, Horn F, Choidas A, et al. Identification of cellular deoxyhypusine synthase as a novel target for antiretroviral therapy. J Clin Invest 2005;115:76-85.
- Robinson WS, Miller RH, Marion PL. Hepadnaviruses and retroviruses share genome homology and features of replication. Hepatology 1987;7:S64-73.
- Gachet Y, Tournier S, Lee M, Lazaris-Karatzas A, Poulton T, Bommer UA. The growth-related, translationally controlled protein P23 has properties of a tubulin binding proterin and associates transiently with microtubules during the cell cycle. J Cell Sci 1999;112:1257-71.
- Bommer UA, Thiele BJ. The translationally controlled tumor protein (TCTP). Int J Biochem Cell Biol 2004;36:379-85.
- Sanchez JC, Schaller D, Ravier F, Golaz O, Jaccoud S, Belet M, et al. Translationally controlled tumor protein: a protein identified in several nontumoral cells including erythrocytes. Electrophoresis 1997;18:150-5.