
3D-QSAR study of 20 (S)-camptothecin analogs
Introduction
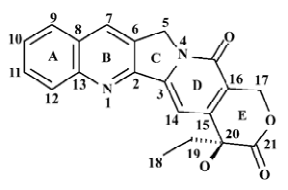
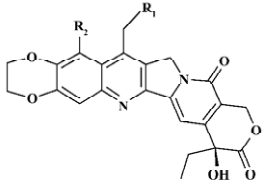
Camptothecin (CPT) is an alkaloid isolated from the Chinese tree Camptotheca acuminate (Figure 1) by Wall Me and co-workers in 1966[1]. The molecule has a pentacyclic ring structure embodying pyrrolo[3,4-b]-quinoline moiety (rings A, B and C), conjugated pyridone moiety (ring D) and a chiral centre within a 6 membered α-hydroxy lactone (ring E). Although showing impressive activity in a number of experimental tumors[2,3] including the human colon, lung and mammary tumor lines, its clinical development was halted in the early 1970s owing to negligible water solubility and unpredictable and formidable toxicities, such as myelo-suppression, diarrhoea and hemorrhagic cystitis[4].
The renewed interest in CPT relies mainly on the recognition of its novel and unique mechanism of action. It was not until 1985[5] that the nuclear enzyme topoisomerase I (TOP I) was identified as its molecular target reported by Liu and co-workers. The enzyme has been implicated in various DNA transactions such as replication, transcription and recombination. CPT and its analogs bind to a complex formed by DNA with the Top I enzyme, which inhibit tumor growth. Because of the unique mechanism of action, the research interests in CPT have become manifold and lead to the production of several hundreds of synthetic and semi-synthetic analogs to date. Now, 2 compounds in this class, topotecan (hycamptin) and irinotecan (camptosar), have been approved for clinical use as anticancer drugs in the United States by the Food and Drug Administration (FDA). Topotecan is presently indicated as a second-line therapy for advanced ovarian cancer and small-cell lung cancer. Irinotecan is approved for use in the treatment of advanced colorectal cancer, both as first-line therapy in combination with 5-FU and as salvage treatment in 5-FU refractory disease. There are more than 10 other CPT analogs in various stages of clinical evaluation[6], including 9-AC, 9-NC, GI-147211, exatecan mesylate, and karenitecin.
As a lot of CPT analogs have been synthesized and evaluated, several 3D QSAR studies of CPT were reported from laboratories[10,18,19] . Among them, Yoon and colleges developed the QSAR model with CPT-11 and other prodrugs with their hydrolysis percent of serum esterase activity to design a new, easily activated SN-38 prodrug[18]. In two other papers[10,19], the authors built the QSAR models with little CPT dataset and few substitutes. Furthermore, due to lack of crystal structure, they all align the compounds with the partial least squares (PLS) fit, and have no detailed interpretation of crystal structure. In this paper, in order to further understand the inhibition mechanism of CPT and to guide structural modification and rational drug design of CPT analog, a 3D QSAR study of CPT analogs with larger dataset using CoMFA was implemented. The final 3-D contour maps were compared with the available X-ray crystal structure (PDB entry 1K4T)[8] from the Protein Databank (PDB, http://www.rcsb.org).
Materials and methods
Computational methods All computations are supported by corresponding modeling suite in SYBYL6.8[7], operated on a SGI Octane-2 graphic workstation (Mountain View, CA, USA).
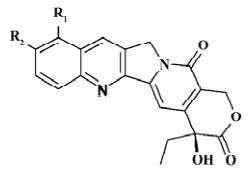
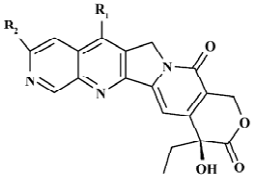
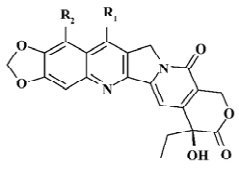
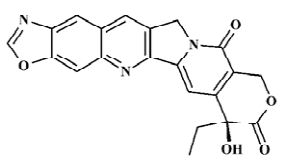
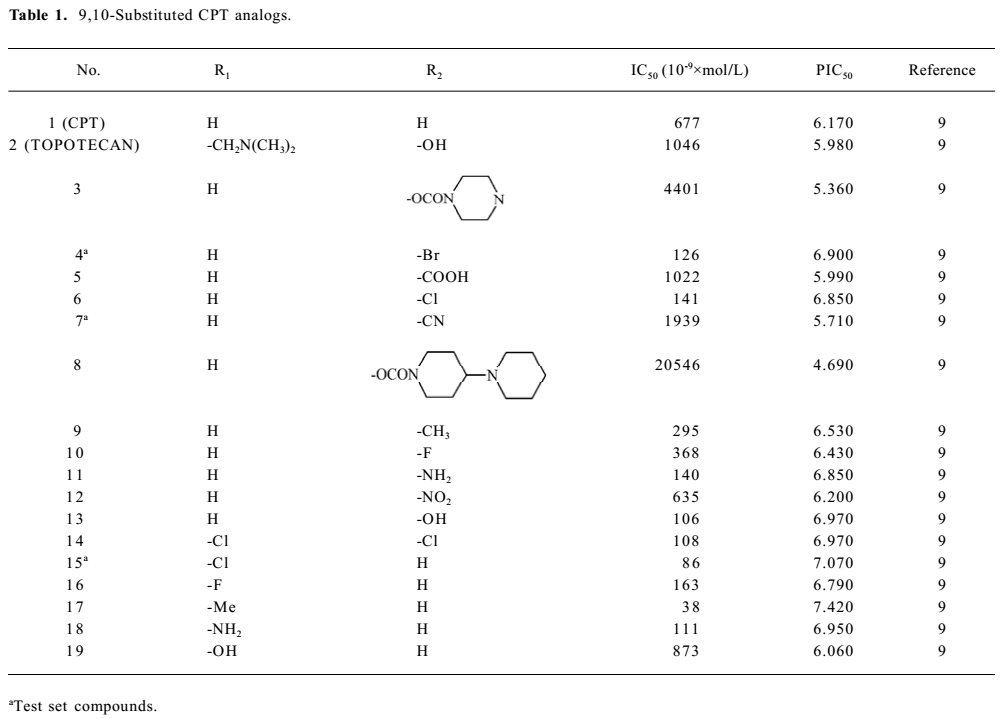
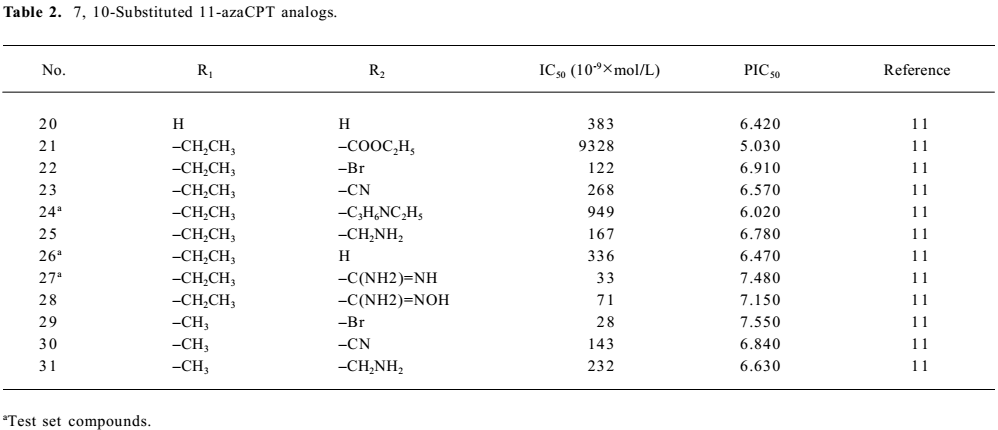
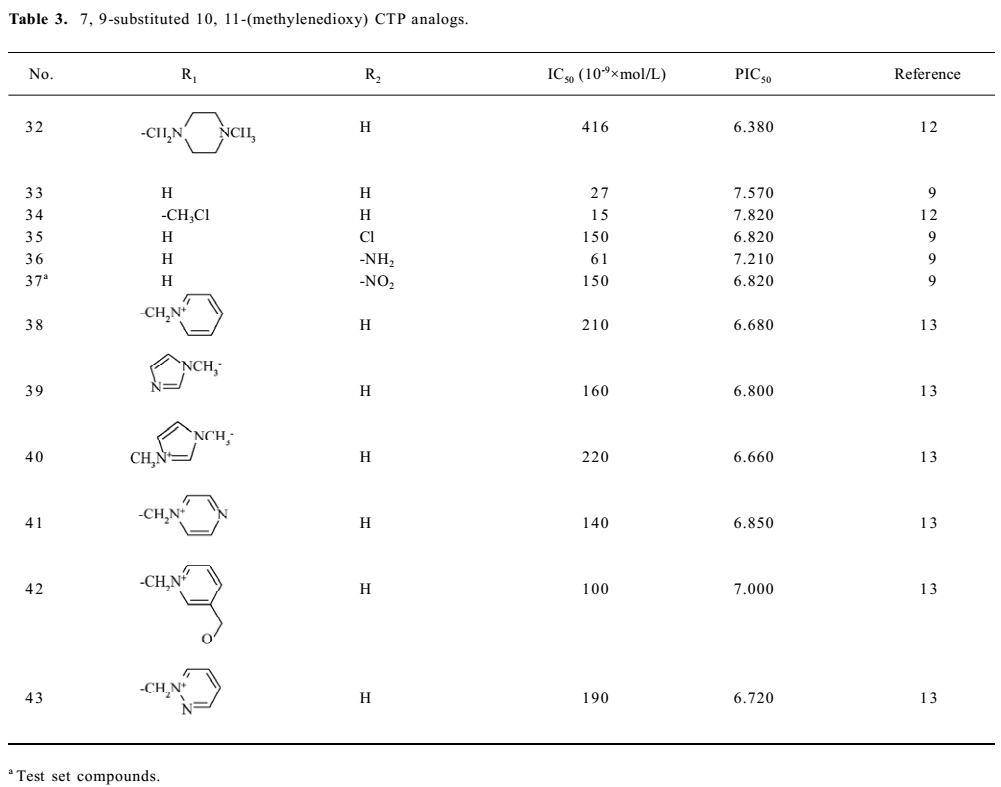
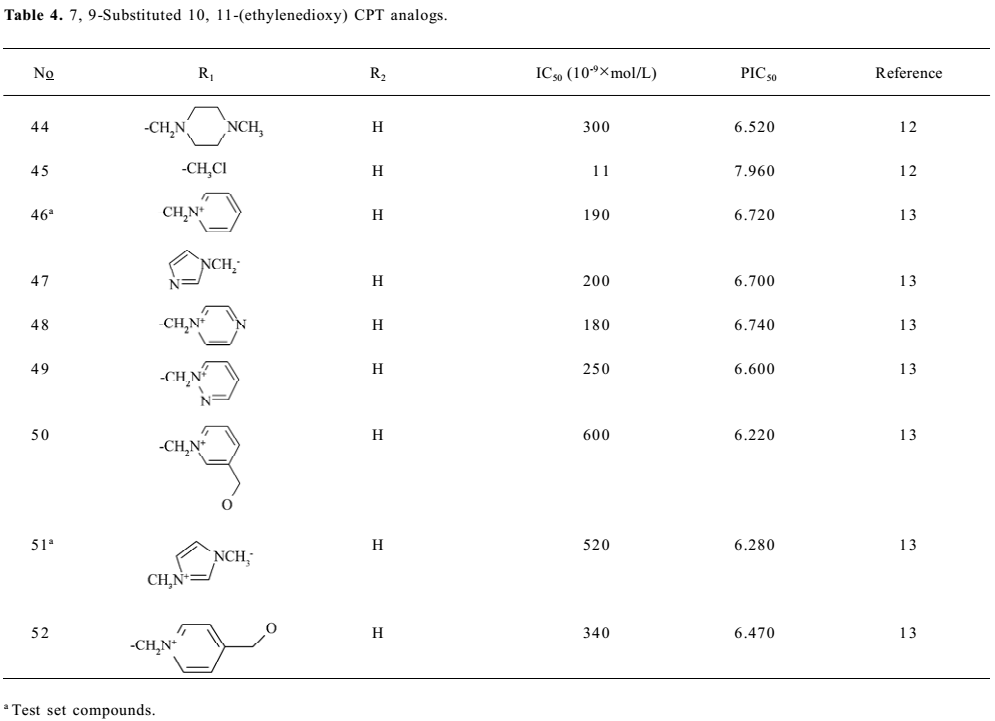
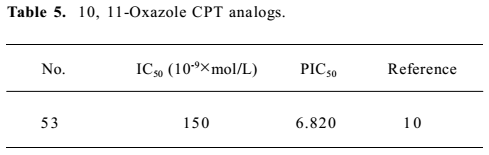
Structure preparation The 53 compounds for this study and their bioactive data are listed in Figures 2-6 and Tables 1-5. The potency data (IC50) was assessed by the minimum concentration (mol/L) that inhibited the cleavable complex formation by 50%.
Full table
Full table
Full table
Full table
Full table
Because the TOP I/DNA/topotecan ternary complex (1K4T)[8] with CPT analog (topotecan) was resolved, topotecan was selected as the starting structure; its starting geometry was extracted from the available X-ray crystal structure (PDB entry 1K4T)[8] from the PDB. After correcting the atom type and bond type by using SYBYL6.8, it was minimized with the TRIPOS force field after being charged with the Gasteiger-Hückel charge . Then the prepared topotecan was used as the template compound to construct other molecules by modifying and assembling fragments from the SYBYL standard library. Other molecules also constructed were charged by the Gasteiger-Hückel charge and further minimized by the minimize 2 module in SYBYL6.8. As for CPT analog, 20S-isomer is much more potent than 20R form and is approximately twice as potent as the 20RS form, so only 20S-isomer CPT analogs with bioactivity were selected. All structures remained 20S configurated after minimization.
Alignment rules The molecular alignment is another critical factor in the CoMFA calculation. Based on the known ternary complex, the docked structure was used for CoMFA study after the above-mentioned compounds were docked into the complex model using molecular simulation program Dock4.0 (Department of Pharmaceutical Chemistry, University of California, San Francisco, USA). The enzyme/DNA/topotecan complex, 1K4T[8], was used to generate the receptor site and the energetic grid for the following docking calculations for molecule alignment. The docking procedure was applied as follows: the sphere centers (a set of overlapping spheres) of the topotecan binding site at a radius of 8 Å were identified by the sphgen program; then a box was created to enclose the spheres to be used for docking. Afterward, the energetic grid was created by a grid program using an all-atom model and a distance-dependent dielectric function with a 10 Å cutoff; an anchor fragment orientation method was performed subsequently, and 50 conformations were produced per cycle. Finally, the dock energy score was used as the scoring function in the docking runs. Only the best scoring pose from each docking run was considered.
CoMFA[20] CoMFA interaction potential energy fields were evaluated on a region (lattice) extending 4 Å in the X, Y and Z axes beyond the volume defined by the union of all molecules with a grid spacing of 2 Å. Standard CoMFA steric and electrostatic fields were calculated using distance-dependent dielectric constant with energy truncation values of 30 kcal/mol. The minimum-sigma (column filtering) was set to 2.0 kcal/mol to improve the signal-to-noise ratio by omitting those lattice points whose energy variation was below this threshold. PLS was carried out for compounds in the training set, except 10 compounds randomly selected as the test set, cross-validated with leave-one-out.
Results and discussion
The CoMFA model was constructed with 43 compounds in the training set, which was validated by the remaining molecules in the test set.
PLS model The PLS technique[21–23] was employed to generate a linear relationship that correlates changes in the computed steric and electrostatic potential fields with changes in the corresponding experimental values of the bioactivity (PIC50) for the data set of ligands. Employing the CoMFA potential energy fields for each molecule as the independent variable and the corresponding PIC50 values as the dependent variable, PLS converts the steric and electrostatic field descriptors to so-called latent variables or principle components (PC) that consist of linear combinations of the original independent variables.
To assess the internal predictive ability of the CoMFA models, we employed a ‘leave-one-out’ cross-validation procedure. In this procedure, each compound is excluded one at a time, after which its bioactivity is predicted by the model constructed from the remaining compounds in the data set. Cross-validation determines the optimum number of PC, corresponding to the smallest error of prediction and the highest cross-validated q2 (or r2cv). PLS analysis was repeated without validation using the optimum number of PC to generate a final CoMFA model from which the conventional r2, a measure of the internal consistency of the model, was derived. The result using this procedure is described as follows.
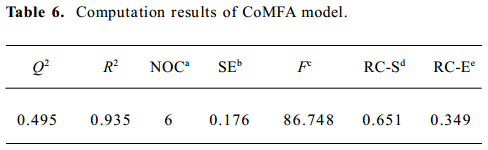
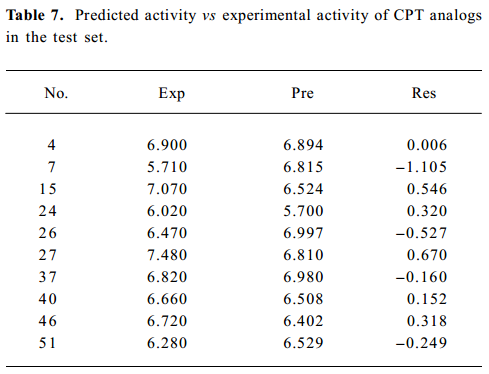
After cross-validated PLS analysis was carried out for the training set, the number of optimal PC at 6 was obtained with cross-validated q2 of 0.495 (Table 6). The non-cross-validated PLS analysis with the optimum PC revealed a conventional r2 value of 0.935, F=86.748, and an estimated standard error of 0.176. Furthermore, the obtained model showed high predictability. As illustrated in Table 7, the predicted values were very close to the observed values. Nine of 10 compounds in the test set were predicted well in terms of activity, except compound 7. The predicted r2 of 9 compounds was 0.58, which showed good correlation. So the 3D QSAR model is predictable, and results of the obtained model are summarized in Tables 6 and 7.
Full table
Full table
The QSAR model also gave the relative electrostatic contribution and relative steric contribution. In this model, the steric contribution was much higher than the electrostatic contribution in which the steric field descriptors explained 65.1% of the variance, while the electrostatic descriptors explained 34.9%. These are in accordance with the ‘drug-stacking’ hypothesis.
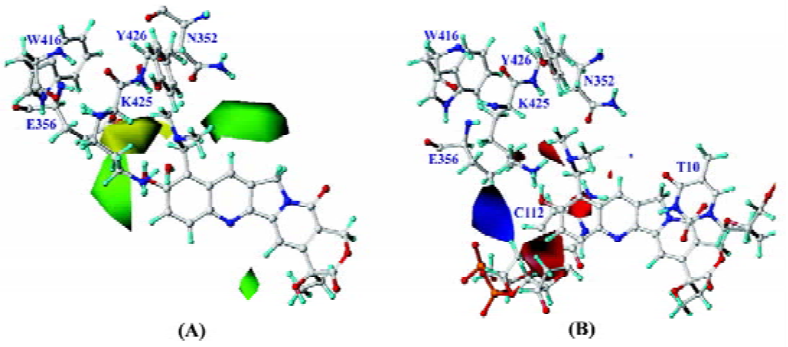
Visualization of 3-D contour maps To visualize the information content of the derived 3D QSAR models, CoMFA contour maps were generated by interpolating the products between the 3D QSAR coefficients and their associated standard deviations. The green contours represented the regions of high steric tolerance, while the yellow contours represented regions of unfavorable steric effects. The blue contours described regions where a positively charged group enhanced activity, while the red contours described regions where a negatively charged group enhanced activity. To aid in visualization, topotecan was displayed in the maps. 3-D contours were mostly found around 7, 9, 10, and 11 positions of CPT analogs, because most substituents of CPT analogs are focused on this position. However, there was a contour at the southeast region in Figure 7A, where there was no substituent near the 14-position. Because of docking CPT analogs into complexes according to the alignment rule, the compounds with methylenedioxy and enthylene-dioxy substituents with high activity rotated a little to right down. It seemed that there was a substitute in the vicinity of the 14-position. So it is an artifact in which more bulky substituents in the 14-position will improve activity. The steric CoMFA map (Figure 7 A) illustrates a favorable region of steric interaction at the 10 and 11 positions, but much more bulky substitutes will decrease activity[15]. The compounds with methylenedioxy and enthylenedioxy substituents (compounds 32–52) exhibit considerable increase of activity, while compounds 3, 8 and 21 decrease their activity. At the same time, there is another favorable steric region at the 7-position, indicating that more bulky substituents are needed in this position to improve the inhibitive activity, which is consistent with the fact that silyl-substituted compounds display more strong potency[14]. The prediction is confirmed by the molecular surface of the binding pocket which is big enough to accommodate more bulky substituents which will conflict with Lys425 if they are too large. More negative substituents will increase inhibitive activity at positions 9, 10, and 11, which is in agreement with previous observations[9,10,16]. It is also in agreement with the mapped enzyme/DNA/topotecan complex because positively-charged residue Lys425 is in the direction of positions 9 and 10. The hydrogen bond between 10-hydroxyl of topotecan and a water molecule[8] also contributed to the negative contour map. Furthermore, CPT analogues were stacked into base pairs, like C112 (Figure 7B) and A113 (not shown in Figure for clarity) and other base pairs (not shown) in this ternary complex, which might show slight positive charge. In addition, more positive substituents at position 7 would strengthen the binding of the inhibitors to top the I-DNA complex, so alkyl-substitutes at position 7 possess considerable activity, and silyl-substitutes show more inhibitive activity[14], which should be correlative with the hydroxyl of base T10. There is a green contour on the left because of the negative charged phosphodiester. The CoMFA contour maps are illustrated in Figure 7.
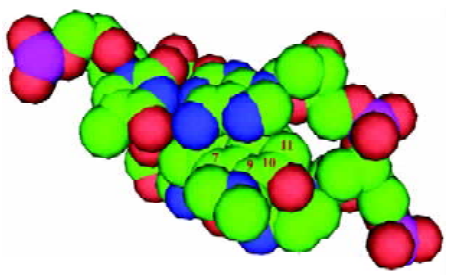
Furthermore, the steric interaction at positions 7, 9, 10, and 11 can be interpreted using the enzyme/DNA/topotecan ternary complex with CPT analogs (topotecan)[8] in Figure 8. The topotecan molecule is oriented with the E ring near the DNA break, and the concave portion of the drug molecule faces the DNA major groove[17]. The structural model demonstrates that 7, 9, 10, and 11 positions face the major groove of the DNA, and the substituents on these positions point toward the sugar backbone. So the model suggests that electron-rich groups of moderate or large size would be favored for these positions.
Conclusion
A study on the quantitative structure–activity relationship with CoMFA for a series of CPT analogs was performed successfully, and a good cross-validated correlation was obtained with q2 of 0.495. Then the PLS model non-cross-validated was built and permitted demonstrations of high predictability for the activities of the CPT analogs in the test set selected randomly. The CoMFA contour maps illustrated that more negative-charged large group at positions 9, 10, and 11 would increase activity, but excessively increasing the bulky group at position 10 would decrease activity; substituents that occupy position 7 with the bulky positively-charged group will enhance inhibitive activity.
References
- Wall ME, Wani MC, Cook CE, Palmer KH, McPhail AT, Sim GA. Plant antitumor agents I. The isolation and structure of camptothecin, a novel alkaloidal leukemia and tumor inhibitor from camptotheca acuminate. J Am Chem Soc 1966;88:3888-90.
- Tanizawa A, Fujimori A, Fujimori Y, Pommier Y. Comparison of topoisomerase I inhibition, DNA damage, and cytotoxicity of camptothecin derivatives presently in clinical trials. J Natl Cancer Inst 1994;86:836-42.
- Verweij J. Topoisomerase I inhibitors and other new cytotoxic drugs. Eur J Cancer 1995;31:828-30.
- Moertel CG, Schutt AJ, Reitemeier RJ, Hahn RG. Phase II study of camptothecin (NSC-100880) in the treatment of advanced gastrointestinal cancer. Cancer Chemother Rep 1972;56:95-101.
- Hsiang YH, Hertzberg R, Hecht S, Liu LF. Camptothecin induces protein-linked DNA breaks via mammalian DNA topoisomerase I. J Biol Chem 1985;260:14873-8.
- Cragg GM, Newman DJ. A tale of two tumor targets: topoiso-merase I and tubulin. The Wall and Wani contribution to cancer chemotherapy. J Nat Prod 2004;67:232-44.
- SYBYL. Version 6.8. St Louis (MO): Tripos Associates; 2000.
- Staker BL, Hjerrild K, Feese MD, Behnke CA, Burgin AB, Stewart LJ. The mechanism of topoisomerase I poisoning by a campto-thecin analog. Proc Nat Acad Sci USA 2002; 99: 15 387–92.
- Wall ME, Wani MC, Nicholas AW, Manikumar G, Tele C, Moore L, et al. Plant antitumor agents 30. Synthesis and structure activity of novel camptothecin analogs. J Med Chem 1993;36:2689-700.
- Carrigan SW, Fox PC, Wall ME, Wani MC, Bowena JP. Comparative molecular field analysis and molecular modeling studies of 20-(S)-camptothecin analogs as inhibitors of DNA topoisomerase I and anticancer/antitumor agents. J Comput Aided Mol Des 1997;11:71-8.
- Uehling DE, Nanthakumar SS, Croom D, Emerson DL, Leitner PP, Luzzio MJ, et al. Synthesis, topoisomerase I inhibitory activity, and in vivo evaluation of 1l-azacamptothecin analogs. J Med Chem 1995;38:1106-18.
- Luzzio MJ, Besterman JM, Emerson DL, Evans MG, Lackey K, Leitner PL, et al. Synthesis and camptothecin antitumor activity of novel water soluble derivatives of camptothecin as specific inhibitors of topoisomerase I. J Med Chem 1995;38:395-401.
- Lackey K, Sternbach DD, Croom DK, Emerson DL, Evans MG, Leitner PL, et al. Water soluble inhibitors of topoisomerase I: quaternary salt derivatives of camptothecin. J Med Chem 1996;39:713-9.
- Bom D, Curran DP, Kruszewski S, Zimmer SG, Strode JT, Kohlhagen G, et al. The novel silatecan 7-tert-butyldimethylsilyl-10-hydroxycamptothecin displays high lipophilicity, improved human blood stability, and potent anticancer activity. J Med Chem 2000;43:3970-80.
- Thomas CJ, Rahier NJ, Hecht SM. Camptothecin: current perspectives. Bioorg Med Chem 2004;12:1585-604.
- Kim DK, Ryu DH, Lee JY, Lee N, Kim YW, Kim JS, et al. Syn-thesis and biological evaluation of novel A-ring modified hexacyclic camptothecin analogues. J Med Chem 2001;44:1594-602.
- Fan Y, Weinstein JN, Kohn KW, Shi LM, Pommier Y. Molecular modeling studies of the DNA-topoisomerase I ternary cleavable complex with camptothecin. J Med Chem 1998;41:2216-26.
- Yoon KJP, Krull EJ, Morton CL, Bornmann WG, Lee RE, Potter PM, et al. Activation of a camptothecin prodrug by specific carboxylesterases as predicted by quantitative structure-activity relationship and molecular docking studies. Mol Cancer Ther 2003;2:1171-81.
- Zhu J, Zhu W, Ji H, Zhou Y, Zhu J, Lü J. Comparative moleculer field analysis (CoMFA) of camptothecin analogs. Chin J Med Chem 1999;9:277-84.
- Cramer RD, Patterson DE, Bunce JD. Comparative molecular field analysis (CoMFA) 1. Effect of shape on binding of steroids to carrier proteins. J Am Chem Soc 1988;110:5959-67.
- Wold S, Albano C, Dunn WJ, Edlund U, Esbensen K, Geladi P, . Multivariate data analysis in chemistry. In: Kowalski B, editors. CHEMOMETRICS: Mathematics and statistics in chemistry. Dordrecht, Netherlands: Reidel; 1984.
- Stahle L, Wold S. Multivariate data analysis and experimental design in biomedical research. Prog Med Chem 1988;25:292-338.
- Esbensen KH, Wold S, Geladi P. Relationships between higher-order data array configurations and problem formulations in multivariate data analysis. J Chemometrics 1988;3:33-48.