
Association between SNP and haplotypes in PPARGC1 and adiponectin genes and bone mineral density in Chinese nuclear families1
Introduction
Osteoporosis is characterized by a decrease in bone mass as well as a deterioration of the bone architecture resulting in an increased risk of fracture. Osteoporosis is multifactorial, and is dependent on environmental and genetic factors. Bone mineral density (BMD) achieved in early adulthood (peak bone mass) is a major predictor of osteoporotic fracture risk. Although environmental factors such as nutrition and physical activity influence the attainment of peak BMD, there is a strong evidence for a major genetic contribution to normal variation in peak BMD[1–3].
Greater body weight is associated with a reduced risk of osteoporotic vertebral and hip fractures, but the mechanism of this effect is not well understood. Weight is the major anthropomorphic determinant of BMD[4,5]. Body fat mass (BFM) has been proposed as a better predictor of BMD than body weight and lean mass[6]. High BFM is associated with high leptin levels[7]. In contrast to leptin, adiponectin is negatively correlated with body mass index (BMI), BFM, and fasting insulin concentrations and calculated insulin resistance[8,9]. Several genetic studies have observed evidence of association between adiponectin gene polymorphisms and features of the metabolism syndrome, such as obesity and insulin resistance[10,11]. However, clinical studies attempting to associate plasma adiponectin levels with bone mass have been inconclusive. Kontogianni et al[12] found that circulating adiponectin levels did not exert any effect on BMD in 80 perimenopausal healthy women. In an Estonia study, however, significant negative relationships were observed between plasma adiponectin and total BMD and lumbar spine BMD values in 38 perimenopausal women. Adiponectin had a significant negative association with total BMD and lumbar spine BMD independent of the influence that other measured body compositional, hormonal or physical performance factors may exert on BMD[13], therefore, more studies need to be done in this area.
Peroxisome proliferator-activated receptor-γ coactivator-1 (PPARGC1) is a co-activator of PPAR-γ and other nuclear hormone receptors, and plays an important role in energy homeostasis. Human PPARGC1 was mapped to chromosome 4p15.1[14]. This chromosomal region has been associated with abdominal subcutaneous fat in the Quebec Family Study[15]. Subsequently, Esterbauer et al[16] investigated associations of 2 polymorphisms (Gly482Ser and +2962A/G) identified in PPARGC1 transcripts with obesity indices in 591 middle-aged men and 467 middle-aged women of a cross-sectional Austrian population. The results showed that the haplotypes were significantly associated with BMI and total body fat in women, but not in men. Perhaps the association between bone mass and body weight will be demonstrated by way of investigating adiponectin and PPARGC1, however, so far, no published report has investigated the relationship between bone mass and single nucleotide polymorphisms (SNP) in adiponectin and PPARGC1 genes. In this study, we performed population- and family-based association studies of adiponectin and PPARGC1 to test whether SNP in adiponectin and PPARGC1 were associated with BMD variation in the spine and hip in our subjects of healthy Chinese Han men and women.
Materials and methods
Subject population The study was approved by the Ethnic Committee of the Shanghai Jiao Tong University Affiliated Sixth People’s Hospital (Shanghai, China). All of the subjects involved in the study were collected by the department of osteoporosis from a local population of Shanghai City located on the middle-east coast of China and signed informed consent documents before entering the project. We recruited 401 nuclear families composed of both parents and at least 1 healthy female child whose age was largely between 20–40 years, with a total of 1260 individuals. All the study subjects belonged to the Chinese Han ethnic group, and all the children were daughters. The average family size was 3.14, in which 348, 50, 2, and 1 families had 1, 2, 3, and 4 children, respectively. For each study subject, we also collected information on age, sex, medical history, family history, marital status, menses history, obstetrical history, physical activity, alcohol use, diet, smoking history, etc. The recruiting daughters were healthy. The exclusion criteria was adopted as previously reported[17,18].
BMD measurements BMD (g/cm2) of the anteroposterior lumber spine 1–4 (L1–4) and left proximal femur including total hip and femoral neck were measured by dual-energy X-ray absorptiometry (DXA) on a Hologic QDR 2000 (Hologic Inc, Bedford, MA, USA). The DXA scanner was on fan-beam mode. The machine was calibrated daily. The coefficient of variability (CV) for BMD and BS values was obtained from 5 repeated measurements on 7 individuals. CV values of the DXA measurements in the spine, total hip and femoral neck were: for BMD, 0.9%, 0.8%, and 1.93%, respectively[18,19]. Height and weight were measured using standardized equipment.
SNP genotyping DNA was isolated from peripheral blood leukocytes using conventional methods. The 3 SNP in the PPARGC1 gene (EMBL AF106698) were examined by the PCR-restriction fragment length polymorphism (RFLP) as described previously[20,21]. DNA fragments containing each SNP (163 bp for SNP Thr394Thr, 452 bp for SNP Gly482Ser and 343 bp for SNP Thr612Met) were amplified by PCR from genomic DNA. The sequences of the primers to detect Gly482Ser polymorphism in exon 8 were 5'-TGAGAGAGAC-TTTGGAGGCA-3' and 5'-GGAATATGGTGATCGGGAAC-3'. The sequences of the primers to detect Thr394Thr (ACG→ ACA) polymorphism in exon 8 were 5'-GCCAGTCAA-TTAATTCCAAA
The genotypes in adiponectin were determined at positions 45 and 276, relative to the translation start site (corres-ponding to position 71 and 302 of GenBank NM_004797) by PCR-RFLP. DNA fragments (456 bp) containing 2 SNP (T45G and G276T) were amplified by PCR from genomic DNA using primers 5'-CTGAGATGGACGGAGT-CCTTT-3' and 5'-CCAAATCACTTCAGGTTGCTT-3'. PCR was performed on 30 ng DNA in 20 µL containing Tris-HCl 10 mmol/L, pH 8.3, KCl 50 mmol/L, MgCl2 1.5 mmol/L, each dNTP 0.2 mmol/L, forward and reverse primers 0.4 µmol/L, Taq polymerase 0.065 U/µL (Promega, USA) for 30 cycles (60 s at 95 °C, 45 s at 58 °C, 45 s at 72 °C) in an MJ Research thermal cycler. PCR products were digested overnight at 37 °C with AvaI for T45G SNP and BsmI for G276T SNP, according to the manu-facturer’s instructions, and electrophoresed on 2.5% agarose gels. T45G genotypes were observed: the TT genotype produced a 456 bp fragment, the GG genotype produced 313 bp and 143 bp fragments, and the TG genotype produced 143 bp, 313 bp and 456 bp fragments. The G276T GG genotype produced a 456 bp fragment, the TT genotype produced 82 bp and 374 bp fragments, and the GT genotype produced 82 bp, 374 bp, and 456 bp fragments.
Haplotype assignment The SimWalk2 program estimated the most probable set of fully typed maternal and paternal haplotypes of the Gly482Ser, Thr612Met and Thr394Thr markers in the PPARGC1 gene, and the G276T and T45G markers in the adiponectin gene for each individual in the nuclear families[22]. The frequencies of genotypes and haplotypes were calculated with the unrelated parents of nuclear families. The significant level of linkage disequilibrium (LD) between the markers of the same gene was assessed based on the observed haplotype and allele frequencies using the HAPLOXT program[23]. LD was expressed as “D'” between all pairs of biallelic loci.
Statistical analysis Allele frequencies were estimated by gene counting. The Hardy-Weinberg equilibrium was tested by a χ2 goodness of fit statistic. In this study, the values of BMD in the spine and hip did not significantly deviate from normal distribution. In all statistical analyses, raw bone phenotypic values were adjusted by age and weight as covariates. Different samples were used for the population-based association test and the family-based test (quantitative trait locus transmission disequilibrium test, QTDT). Because our premenopausal women consisted of sibling data, 1 sister from each of the 401 families was randomly selected to generate an unrelated sample for testing the population-based association hypothesis. To test for the association between SNP genotypes and haplotypes and spine and hip BMD variations, ANOVA was performed for premenopausal women, postmenopausal women, and men separately, using SPSS version 11.5 (SPSS, Inc, Chicago, IL, USA). The proportion of BMD variations explained by each SNP was estimated by the ANOVA r2 value.
In premenopausal women, population-based methods such as ANOVA may produce false positive results in admixed or stratified populations. Therefore, we also performed a family-based association test using QTDT. The QTDT program, using the orthogonal model, was used to test for population stratification, linkage, and within-family association between SNP in the 2 genes and BMD phenotypes. The QTDT software package is available on the internet (http://www.sph.umich.edu/csg/abecasis/QTDT/). This method, as implemented in the QTDT software[24,25], extends the trio-based TDT to quantitative trait data and uses genotype data from available siblings and parents. Because in our nuclear families all of the children were daughters, and the effects of parents’ phenotypes were excluded in the QTDT, sex was not used to as a covariate to adjust the daughters’ bone phenotypes variations[26]. Of course, raw BMD values were adjusted by age and weight as covariates. Because false positive results might be generated in multiple tests as in the present study, to assess the reliability of the results, permutations (1000 simulations) were performed to generate the empirical P values[27]. P<0.05 was considered significant for all the analyses.
Results
Allele frequencies and LD analysis There were 401 nuclear families with 1260 individuals in the study, including 802 parents and 458 daughters. The basic characteristics of the study subjects are shown in Table 1. All parental genotypes were obtained, and the bone phenotypic values of 383 postmenopausal women and 389 men were obtained and excluded to the secondary causes of osteoporosis.
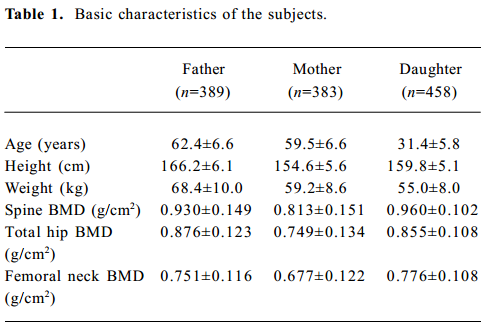
Full table
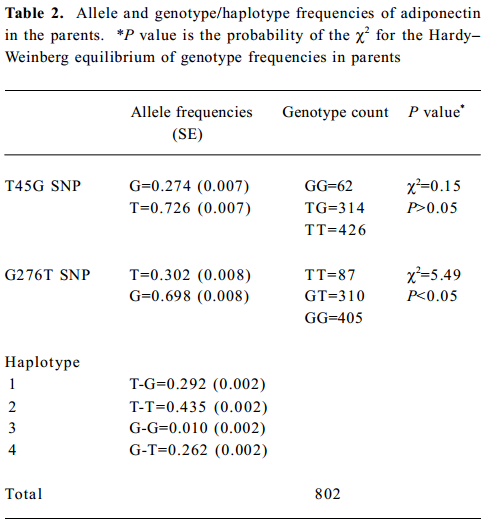
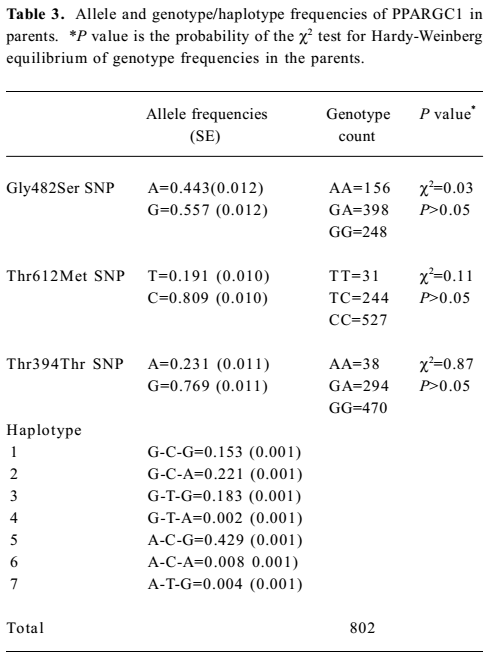
A total of 1260 subjects were genotyped in the 2 SNP of adiponectin and 3 SNP of PPARGC1. The genotype and allele frequencies of the 2 markers and haplotypes in adiponectin are presented in Table 2. T45G genotypes of adiponectin were in the Hardy-Weinberg equilibrium, while the G276T genotypes were not. The LD tests showed that D' was 0.87 between the 2 markers of adiponectin. The genotype and allele frequencies of the 3 markers and haplotypes in PPARGC1 are presented in Table 3. The genotypes of 3 SNP in PPARGC1 were all in the Hardy-Weinberg equilibrium. Substantial LD existed between all pairs of genotyped markers (0.912≤ D' ≤0.962).
Full table
Full table
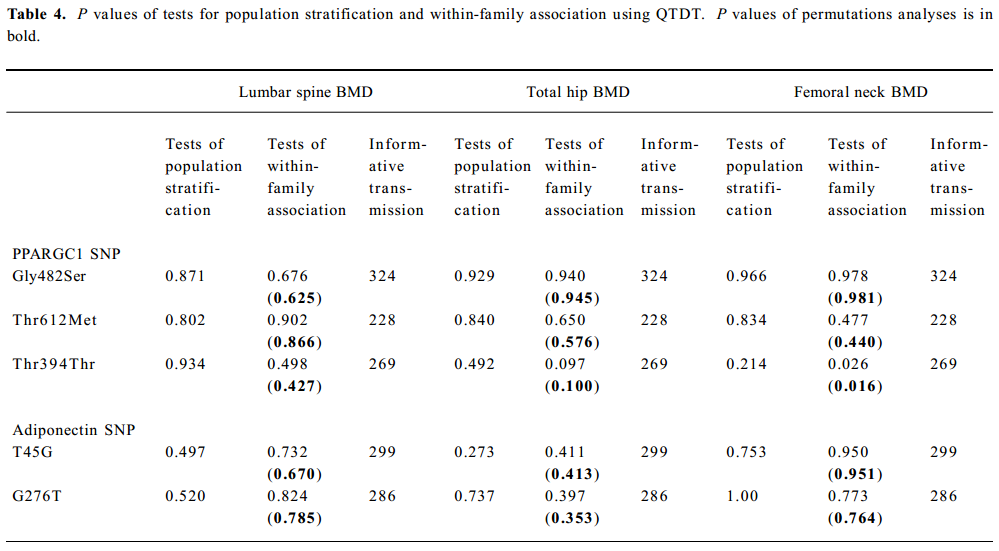
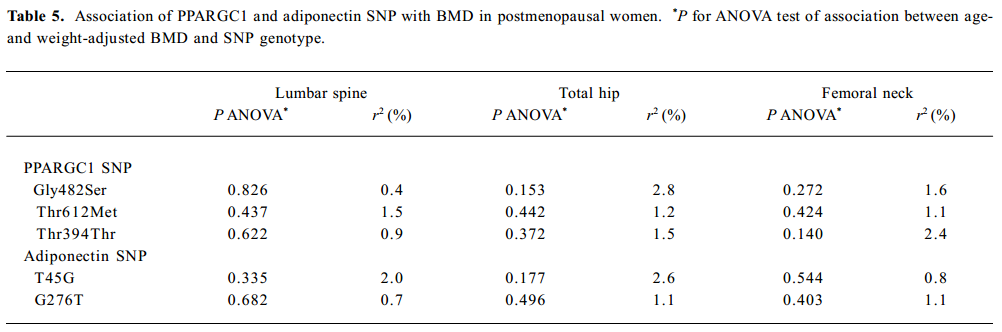
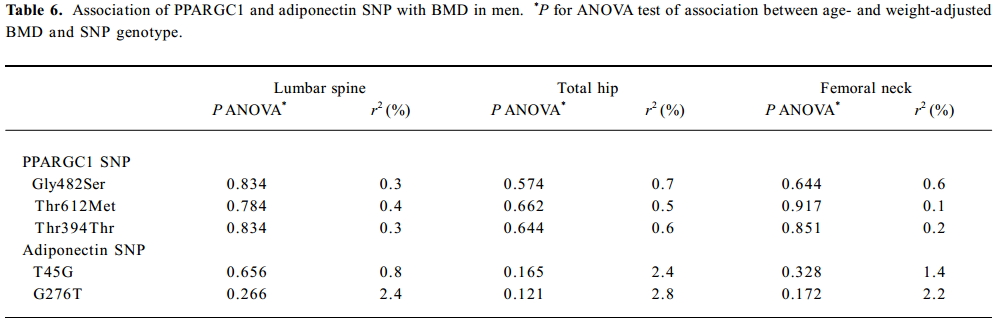
SNP association analyses with BMD Table 4 summarizes the results of the QTDT analysis. There were 324, 228, 269, 299, and 286 informative nuclear families for the TDT analysis in the Gly482Ser, Thr612Met, Thr394Thr, T45G, and G276T SNP, respectively. No population stratification was found for the each SNP in the PPARGC1 and adiponectin genes in the spine and hip BMD in premenopausal women. Significant within-family association was found between the Thr394Thr polymorphism in the PPGAGC1 gene and femoral neck BMD (P=0.026). Subsequent permutations were in agreement with this significant within-family association result (P=0.016). However, no significant within-family association was detected between each SNP in the adiponectin gene and BMD at any sites. Moreover, no significant results for linkage between every SNP of each gene and BMD in the spine and hip was observed, using tests of linkage and tests of linkage while modeling association (data not shown). Although within-family association between Thr394Thr SNP and femoral neck BMD is significant, this SNP only accounts for 0.70% of the variation in femoral neck BMD in 401 unrelated daughters randomly selecting from each of the 401 families as measured by the ANOVA r2 value. In addition, no significant association was detected between each SNP in the 2 genes and BMD in the spine or hip in postmenopausal women or men (Tables 5, 6).
Full table
Full table
Full table
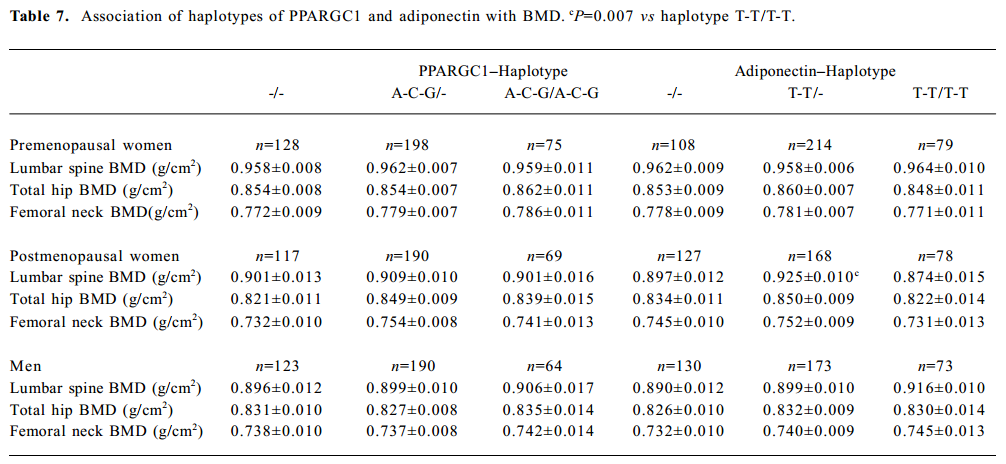
Haplotype association analyses with BMD We further observed the results of haplotype association analyses with BMD. Haplotypes were inferred from PPARGC1 SNP (Gly482Ser, Thr612Met, and Thr394Thr) and adiponectin SNP (T45G and G276T), respectively. On the basis of these polymorphisms, we found 4 and 7 different haplotypes in the adiponectin and PPARGC1 genes presented in our population, respectively. We identified 4 common haplo-types with >5% frequency in the PPARGC1 gene, and together these haplotypes accounted for 98.6% of the geno-typed chromosomes. The frequencies of haplotypes of 2 SNP in the adiponectin gene were T-T for 44.9%, T-G for 29.2%, G-T for 26.2%, and G-G for 1.0% (Tables 2, 3).
In the group of premenopausal women, postmenopausal women, and men, no significant differences were found in BMD in any sites in those with two copies of the most common haplotype 4 (A-C-G) of PPARGC1 compared with those with no or 1 copy of the haplotype. With adiponectin haplotypes, haplotype 2 (T-T) was associated with lumbar spine BMD in postmenopausal women (P=0.019), and subjects carrying 1 copy of haplotype 2 had higher lumbar spine BMD than those with 2 copies of haplotype 2 (P=0.007; Table 7).
Full table
Discussion
In this study, we investigated 2 of the most commonly studied SNP (G276T and T45G) in the adiponectin gene and 3 SNP (Thr394Thr, Gly482Ser, and Thr612Met) in the PPARGC1 gene, and examined the association between SNP and spine and hip BMD variations in our large cohort of healthy Chinese Han men and women. There was no evidence of association between BMD and adiponectin SNP in both sexes. However, significant within-family association was detected for the Thr394Thr polymorphism in the PPARGC1 gene with peak BMD in the femoral neck in premenopausal women. Furthermore, population stratification was not detected for the Thr394Thr polymorphism in the spine and hip BMD. The QTDT examined the transmission of alleles from parents to offspring. The within-family association test can eliminate the effect of admixed and stratified population. Although the QTDT is less powerful for the detection of association than the population-based association test[28], we used a large sample size of 401 Chinese nuclear families, and obtained 269 informative nuclear families for the TDT analysis at Thr394Thr SNP. Therefore, the evidence of tests of within-family association should be more valuable due be the robustness of the TDT approach. Furthermore, because false positive results might be generated in multiple tests as in the present study, we performed 1000 permutations to eliminate false positive results. Subsequent permutations analyses confirmed this significant within-family association result (P=0.016). However, this SNP was not associated with BMD in the spine and hip in postmenopausal women and men. As a result, our findings indicate that Thr394Thr SNP in PPARGC1 is of importance for the attainment of peak BMD, but not for age-dependant bone loss. Indeed, the attainment and maintenance of peak bone mass and the rate of bone loss at menopause or old period was influenced by different genetic factors[29]. Using population-based methods of analyses, we found that Thr394Thr SNP explained a very small proportion of the variation (0.7%) in femoral neck BMD in premenopausal women. Meanwhile, haplotypes constructed from the 3 SNP (Thr394Thr, Gly482Ser, and Thr612Met) in PPARGC1 showed no significant association with BMD in both sexes. Therefore, despite significant evidence of within-family association between Thr394Thr SNP and femoral neck BMD, SNP genotypes in the PPARGC1 is not a major contributor to the observed variability in BMD in Chinese women and men.
We found that genotype frequencies at both the Thr394Thr and Gly482Ser polymorphic sites were in agreement with the Hardy-Weinberg equilibrium, and the 2 polymorphisms showed a highly significant standardized pair-wise LD (D'=0.912). Genotype frequencies at both Thr394Thr and Gly482Ser polymorphisms in our population were similar with Hara et al, who demonstrated that the Thr394Thr and Gly482Ser polymorphisms were in strong, but not in complete LD (D’=0.86) in a Japanese study containing 537 type 1 diabetic patients and 417 nondiabetic subjects[20]. Previous studies found that the amino acid exchange at Gly482Ser was conservative and did not create or eliminate protein motifs known to be functional, and the Thr394Thr polymorphism in exon 8 was G-to-A substitution and did not result in amino acid exchange[30]. We observed a significantly positive association between weight and BMD in present Chinese women and men. Several studies showed significant relationships between the Thr394Thr and Gly482Ser polymorphisms and haplotypes with weight, BMI and obesity[15,16], however, we failed to find significant relationships between every SNP and haplotypes in the PPARGC1 gene and height, weight, and BMI in the within-family association test (through QTDT), or in the 401 unrelated children (through ANOVA, data not shown). Furthermore, for tests of within-family association, BMD values were adjusted for age and weight using QTDT. Recent studies have identified rodent quantitative trait locus associated with increased BMD in the mouse gene encoding 12/15-lipoxygenase[31], the enzyme that converts linolein acid and arachidonic acid into endogenous ligands for the PPARγ[32,33]. Several studies have shown that myoblastic cell lines can be converted to adipocytes through the expression of PPARγ, and ligand activation of PPARγ derives the differentiation of multiprotein mesenchymal progenitor cells towards adipocytes over osteoblasts[34]. Akune et al[35] further found the relationship between osteogenesis and adipogenesis using cells and animal deficient in PPARγ expression. The results showed that homozygous PPARγ-deficient ES cells failed to differentiate into adipocytes, but spontaneously differentiated into osteoblasts; PPARγ haploinsufficiency enhanced osteoblas-togenesis in vitro and increased bone mass in mice in vivo. In addition, an exonic SNP in the PPARγ gene is associated with total body BMD in Japanese postmenopausal women[36]. Therefore, PPARGC1 is a co-activator of PPAR-γ and other nuclear hormone receptors. Taken together with the results in this study, these findings support the involvement of Thr394Thr SNP in PPARGC1 gene in the attainment of peak BMD, perhaps through a PPARγ-dependent pathway.
Our results showed no significant association between 2 SNP in the adiponectin gene, spine and femoral neck BMD variations in Chinese women and men using the population-based analyses and the powerful QTDT. Meanwhile, as with SNP in the PPARGC1 gene, we failed to find significant associations between each SNP and haplotypes in the adipo-nectin gene, height, weight and BMI in the within-family association test (through QTDT) or in 401 unrelated daughters (through ANOVA). Our findings are agreement with Takahashi et al, who found no such relationship with the same SNP in a Japanese study[37]. We found that the most common haplotype 2 (T-T) in the adiponectin gene was associated with lumbar spine BMD in postmenopausal women, and containing one copy of T-T haplotype in adiponectin, had higher lumbar spine BMD compared with 2 copies of the T-T haplotype. However, the biology of this association between haplotype 2 (T-T) and BMD in the spine in postmenopausal Chinese women has been unclear. The T45G polymorphism is a silent T to G substitution in exon 2, and G276T polymorphism is a G to T substitution in intron 2. Menzaghi et al[10] observed a significant association between circulating adiponectin levels and T45G and G276T polymorphisms in 413 nondiabetic individuals. Although plasma adiponectin concentrations are reported to be negatively associated with obesity and diabetes[12,38], the relationship between circulating adiponectin levels and bone mass have been contrary[12,13]. A recent study has demonstrated that adiponectin increases bone mass by suppressing osteo-clastogenesis and possibly activating osteogenesis[39]. These findings were also confirmed by Luo et al[40] who observed that adiponectin induced human osteoblast proliferation and differentiation, and the proliferation response was mediated by the adiponectin receptor (AdipoR)/c-jun N-terminal kinase pathway, while the differentiation response is mediated via the AdipoR/p38 pathway. These findings suggest that osteoblasts are the direct targets of adiponectin. Nevertheless, our present study demonstrated that genetic variations in the adiponectin gene did not influence peak BMD variation in Chinese women. Therefore, future more functional SNP in this gene need to be investigated.
Because all nuclear families in this study consisted of only 2 generations, and 53 nuclear families containing 62 sib pairs are informative for the linkage analyses, no linkage for SNP in the adiponectin and PPARGC1 genes with BMD in the spine and hip was detected.
To our knowledge, this is the first study to investigate the possible influence of SNP and haplotypes in the adiponectin and PPARGC1 genes of BMD in the spine and hip. Although previous studies have demonstrated that SNP and haplotypes in the adiponectin and PPARGC1 genes were associated with obesity and metabolism syndrome, these studied SNP in the adiponectin and PPARGC1 genes are not major risk factors for low peak BMD and osteoporosis in the present study. Our study has several limitations due to the few SNP studies published, and no functional study of polymorphism. Therefore, our results should be interpreted cautiously, and future functional SNP in the promoter region or code for amino acid sequence change are needed for better understanding of the role of the 2 genes in the bone mass in the Chinese population. Of course, our study also has several advantages: subjects were selected from a relatively large sample size of nuclear families, and we performed the tests of population-based association and family-based association, and applied haplotype analysis. In addition, considering the false positive results due to multiple tests, we performed 1000 permutations analyses.
In conclusion, our results showed that Thr394Thr SNP in the PPARGC1 gene were associated with peak BMD in Chinese women, but this SNP explains a very small proportion of the variation in femoral neck BMD. Confirmation of our results is needed in other populations and with more functional markers within and flanking the PPARGC1 or adiponectin gene region.
References
- Rubin LA, Hawker GA, Peltekova VD, Fielding LJ, Ridout R, Cole DE. Determinants of peak bone mass: clinical and genetic analyses in a young female Canadian cohort. J Bone Miner Res 1999;14:633-43.
- Brown LB, Streeten EA, Shapiro JR, McBride D, Shuldiner AR, Peyser PA, et al. Genetic and environmental influences on bone mineral density in pre- and post-menopausal women. Osteoporos Int 2005;16:1849-56.
- Peacock M, Koller DL, Hui S, Johnston CC, Foroud T, Econs MJ. Peak bone mineral density at the hip is linked to chromosomes 14q and 15q. Osteoporos Int 2004;15:489-96.
- Glauber HS, Vollmer WM, Nevitt MC, Ensrud KE, Orwoll ES. Bone weight versus body fat distribution, adiposity, and frame size as predictors of bone density. J Clin Endocrinol Metab 1995;80:1118-23.
- Zhang ZL, Qin YJ, Huang QR, Hu YQ, Li M, He JW, et al. Bone mineral density of the spine and femur in healthy Chinese men. Asia J Androl 2006;8:419-27.
- Schott AM, Cormier C, Hans D, Favier F, Hausherr E, Dargenet-Molina P, et al. How hip and whole-body bone mineral density predict hip fracture in elderly women: The EPIDOS Prospective Study. Osteoporos Int 1998;8:247-54.
- Thomas T, Burguera B, Melton LJ III, Atkinson EJ, O’Fallon WM, Riggs BL, et al. Relationship of serum leptin levels with body composition and sex steroid and insulin levels in men and women. Metabolism 2000;49:1278-84.
- Staiger H, Haring HU. Adipocytokines: fat-derived humoral mediators of metabolic homeostasis. Exp Clin Endocrinol Diabetes 2005;113:67-79.
- Lenchik L, Register TC, Hsu FC, Lohman K, Nicklas BJ, Freedman BI, et al. Adiponectin as a novel determinant of bone mineral density and visceral fat. Bone 2003;33:646-51.
- Menzaghi C, Ercolino T, Di Pada R, Berg AH, Warram JH, Scherer PE, et al. A haplotype at the adiponectin locus is associated with obesity and other features of the insulin resistance syndrome. Diabetes 2002;51:2306-12.
- Esposito K, Pontillo A, Di Palo C, Giugliano G, Masella M, Marfella R, et al. Effect of weight loss and lifestyle changes on vascular inflammatory markers in obese women: a randomized trial. JAMA 2003;289:1799-804.
- Kontogianni MD, Dafni UG, Routsias JG, Skopouli FN. Blood leptin and adiponectin as possible mediators of the relation between fat mass and BMD in perimenopausal women. J Bone Miner Res 2004;19:546-51.
- Jurimae J, Rembel K, Jurimae T, Rehand M. Adiponectin is associated with bone mineral density in perimenopausal women. Horm Metab Res 2005;37:297-302.
- Esterbauer H, Oberkofler H, Krempler F, Patsch W. Human peroxisome proliferator activated receptor gamma coactivator (PPARGC1) gene: cDNA sequence, genomic organization, chromosomal localization, and tissue expression. Genomics 1999;62:98-102.
- Perusse L, Rice T, Chagnon YC, Despres JP, Lemieux S, Roy S, et al. A genomewide scan for abdominal fat assessed by computed tomograghy in the Quebec Family Study. Diabetes 2001;50:614-21.
- Esterbauer H, Oberkofler H, Linnemayr V, Iglseder B, Hedegger M, Wolfsgruber P, et al. Peroxisome proliferator-activated receptor-γ coactivator-1 gene locus associations with obesity indices in middle-ages women. Diabetes 2002;51:1281-6.
- Liu XH, Liu YJ, Jiang DK, Li YM, Li MX, Qin YJ, et al. No evidence for linkage and/or association of human alpha2-HS glycoprotein gene with bone mineral density variation in Chinese nuclear families. Calcif Tissue Int 2003;73:244-50.
- Qin YJ, Zhang ZL, Huang QR, He JM, Hu YQ, Zhao Q, et al. Association of vitamin D receptor and estrogen receptor-alpha gene polymorphism with peak bone mass and bone size in Chinese women. Acta Pharmacol Sin 2004;25:462-8.
- Zhang ZL, Qin YJ, He JW, Huang QR, Li M, Hu YQ, et al. Association of polymorphisms in low-density lipoprotein receptor-related protein 5 gene with bone mineral density in postmenopausal Chinese women. Acta Pharmacol Sin 2005;26:1111-6.
- Hara K, Tobe K, Okada T, Kadowaki H, Akanuma Y, Ito C, et al. A genetic variation in the PGC-1 gene could confer insulin resistance and susceptibility to type II diabetes. Diabetologia 2002;45:740-3.
- Ek J, Andersen G, Urhammer SA, Gaede PH, Drivsholm T, Borch-Johnsen K, et al. Mutation analysis of peroxisome proliferator-activated receptor-gamma coactivator-1 (PGC-1) and relationships of identified amino acid polymorphisms to type II diabetes mellitus. Diabetologia 2001;44:2220-6.
- Sobel E, Lange K. Descent graphs in pedigree analysis: Applications to haplotyping, location scores, and markersharing statistics. Am J Hum Genet 1996;58:1323-37.
- Abecasis GR, Cookson WO. Gold-graphical overview of linkage disequilibrium. Bioinformatics 2000;16:182-3.
- Abecasis GR, Cardon LR, Cookson WO. A general test of association for quantitative traits in nuclear families. Am J Hum Genet 2000;66:279-92.
- Koller DL, Ichikawa S, Johnson ML, Lai D, Xuei X, Edenberg HJ, et al. Contribution of the LRP5 gene to normal variation in peak BMD in women. J Bone Miner Res 2005;20:75-80.
- Qin YJ, Shen H, Huang QR, Zhao LJ, Zhou Q, Li MX, et al. Estrogen receptor α gene polymorphisms and peak bone density in Chinese nuclear families. J Bone Miner Res 2003;18:1028-35.
- Deng FY, Liu MY, Li MX, Lei SF, Qin YJ, Zhou Q, et al. Test of linkage and association of the COL1A2 gene with bone phenotypes’ variation in Chinese nuclear families. Bone 2003;33:614-19.
- Ichikawa S, Koller DL, Johnson ML, Lai D, Xuei X, Edenberg HJ, et al. Human ALOX12, but not ALOX15, is associated with BMD in white men and women. J Bone Miner Res 2006;21:556-64.
- Thijssen JH. Gene polymorphisms involved in the regulation of bone quality. Gynecol Endocrinol 2006;22:131-9.
- Esterbauer H, Oberkofler H, Linnemayr V, Iglseder B, Hedegger M, Wolfsgruber P, et al. Peroxisome proliferator-activated receptor-gamma coactivator-1 gene locus: associations with obesity indices in middle-aged women. Diabetes 2002;51:1281-6.
- Klein RF, Allard J, Avnur Z, Nikolcheva T, Rotstein D, Carlos AS, et al. Regulation of bone mass in mice by the lipoxygenase gene Alox15. Science 2004;303:229-32.
- Huang JT, Welch JS, Ricote M, Binder CJ, Willson TM, Kelly C, et al. Interleukin-4-dependent production of PPAR-gamma ligands in macrophages by 12/15-lipoxygenase. Nature 1999;400:378-82.
- Nosjean O, Boutin JA. Natural ligands of PPARgamma: are prostaglandin J(2) derivatives really playing the part? Cell Signal 2002;14:573-83.
- Pei L, Tontonoz P. Fat’s loss is bone’s gain. J Clin Invest 2004;113:805-6.
- Akune T, Ohba S, Kamekura S, Yamaguchi M, Chung UI, Kubota N, et al. PPARgamma insufficiency enhances osteogenesis through osteoblast formation from bone marrow progenitors. J Clin Invest 2004;113:846-55.
- Ogawa S, Urano T, Hosoi T, Miyao M, Hoshino S, Fujita M, et al. Association of bone mineral density with a polymorphism of the peroxisom proliferator-activated receptor gamma gene: PPARγ expression in osteoblasts. Biochem Biophys Res Commun 1999;260:122-6.
- Takahashi M, Arita Y, Yamagata K, Matsukawa Y, Okutomi K, Horie M, et al. Genomic structure and mutations in adipose-specific gene, adiponectin. Int J Obes Relat Metab Disord 2000;24:861-8.
- Yatagai T, Nagasaka S, Taniguchi A, Fukushima M, Nakamura T, Kuroe A, et al. Hypoadiponectinemia is associated with visceral fat accumulation and insulin resistance in Japanese men with type 2 diabetes mellitus. Metabolism 2003;52:1274-8.
- Oshima K, Nampei A, Matsuda M, Iwaki M, Fukuhara A, Hashimoto J, et al. Adiponectin increases bone mass by suppressing osteoclast and activating osteoblast. Biochem Biophys Res Commun 2005;331:520-6.
- Luo XH, Guo LJ, Yuan LQ, Xie H, Zhou HD, Wu XP, et al. Adiponectin stimulates human osteoblasts proliferation and differentiation via the MAPK signaling pathway. Exp Cell Res 2005;309:99-109.