
Angiotensin II receptor blocker provides pancreatic β-cell protection independent of blood pressure lowering in diabetic db/db mice1
Introduction
Recently, accumulating evidence has suggested that in the diabetes state, oxidative stress increases in pancreatic β-cells which have the lowest intrinsic antioxidant capacity compared with other tissues[1,2]. At the same time, more and more large-scale studies have shown that angiotensin II receptor blocker (ARB) evoke a significant risk reduction of newly diagnosed diabetes when compared with β-blocker calcium channel blocker or placebo, as demonstrated in the LIFE (Losartan Intervention for Endpoint Reduction in Hypertension) study, where losartan vs β-blocker, resulting in a 25% reduction in the incidence of developing diabetes[3]; the VALUE (Valsartan Antihypertensive Long-term Use Evaluation) study, where valsartan vs amlodipine, resulting in a 23% reduction of incidence[4]; and the CHARM (Candesartan in Heart Failure — Assessment of Mortality and Morbidity) trial, where candesartan vs placebo, resulting in a 22% reduction of incidence[5]. These trials have demonstrated that blockade of the renin-angiotensin system (RAS) protects against the development of diabetes in “at-risk” patients with hypertension, but the confirmative mechanism of ARB in preventing diabetes remains equivocal; it may lie on mitigation of islet fibrosis, oxidative stress and β-cell apoptosis, or increase of islet blood flow.
There have been some studies which have proven the existence of a local RAS in the islets[6,7]. Several RAS components including AT1 and AT2 receptors, ACE, and angiotensinogen were identified in mouse pancreatic islets. Furthermore, the AT1 receptors were specifically localized to the islet β-cells demonstrated by real-time RT-PCR, Western blotting and double immunofluorescence staining[8]. Short-term infusion of Ang II impairs first-phase insulin release, possibly through changes in intra-islet blood flow; chronic exposure to Ang II increases oxidative stress in β-cells, activates fibrogenesis, and promotes apoptosis. Each of these processes has also been implicated in the progressive loss of β-cell function observed in type 2 diabetes.
The aim of the present study is to investigate whether and how chronic ARB treatment can attenuate the deleterious influence of hyperactive local RAS in the diabetes state and reverse hyperglycemia using the well-characterized model of non-insulin-dependent diabetes, the genetically obese leptin receptor-deficient (db/db) mice. We also aimed to explore whether these benefits are dose-dependent and blood pressure-independent.
Materials and methods
Animals Forty-four male genetically diabetic, specific pathogen-free female C57BL/KsJ-db/db mice weighing 35–40 g, and of 8 weeks of age, were purchased from CLEA Japan Inc (Tokyo, Japan). These mice were randomized to the ARB candesartan cilexetil 1 mg/kg, candesartan cilexetil 10 mg/kg, manidipine 10 mg/kg and placebo vehicle (5% arabic gum) via gavage for 6 weeks. Eleven C57BL/KsJ-db/m mice treated with placebo acted as nondiabetic controls. The animals were housed in specific pathogen-free barrier facilities at 23 °C with a light-dark cycle of 12:12 h and free access to food and water. Ethics approval was granted by the Animal Experimental Committee of the Medical Department of Juntendo University (Tokyo, Japan). The animals were handled according to the Principles of Laboratory Animal Care (NIH Publication N
Measurement of physiological and biochemical parameters Body weight and random blood glucose were measured every week. Systolic blood pressure (SBP) and heart rate were measured at 2 h and 5 h after gavage at the starting point and terminal, and the mean SBP was calculated.
Intraperitoneal glucose tolerance test (IPGTT) After 6 weeks’ treatment, an intraperitoneal glucose injection was given after a 15 h overnight food deprivation at a dose of 0.5 g/kg body weight. Blood samples were taken at time 0 (before the glucose injection) and at 30, 60, and 120 min after the glucose injection by tail cut. Glucose levels were measured in whole blood with a compact glucose analyzer (One Touch Ultra Glucose Meter, LifeScan Inc, Milpitas, California, USA). Plasma insulin concentration were measured by a commercial insulin ELISA kit (Morinaga, Yokohama, Japan).
Immunohistochemistry Immunochemical detection of insulin, p22phox protein, gp91phox protein, 8-hydroxy-2'-deoxyguanosine (8-OHdG), 4-hydroxynonenal (4-HNE) modified protein and CD31 were performed using the avidin-biotin complex method. After the animals were deeply anesthetized, the pancreases were removed and postfixed in 4% paraformaldehyde for 4–6 h and embedded in paraffin and sectioned into 5 μm slices. Formalin-fixed tissue sections were deparaffinized with xylene and rehydrated with graded ethanols. Endogenous peroxidase activity was blocked with 0.3% hydrogen peroxide; 10% normal goat serum or 10% normal rabbit serum was applied for blocking nonspecific binding for 10 min at room temperature. Then the sections were incubated overnight for 14 h at 4 °C with primary antibodies diluted in PBS containing 1% bovine serum albumin (BSA). Primary antibodies included guinea pig antihuman insulin antibody (1:2000, LINCO Inc, St Charles, MO, USA), polyclonal goat anti-human p22phox antibody, polyclonal goat anti-human gp91phox antibody (1:100, Santa Cruz Biotechnology, Santa Cruz, CA, USA), mouse anti-human 8-OHdG monoclonal antibody (10 μg/mL; Japan Institute for the Control of Aging, Fukuroi, Japan), mouse anti-human 4-HNE monoclonal antibody (25 μg/mL, Japan Institute for the Control of Aging, Japan), and purified rat anti human CD31 antibody (1:200, BD Biosciences, Tokyo, Japan). After washing with Phosphate Buffered Saline Tween (PBST) 3 times, the sections were incubated with biotinylated secondary antibody for 30 min at room temperature. Secondary antibodies included biotinylated goat anti-guinea pig IgG antibody (1:1000, Chemicon, Temecula, CA, USA), biotinyl-ated rabbit anti-goat IgS antibody (1:200, Dako,Tokyo, Japan), biotinylated goat anti-mouse IgS antibody (1:200, Dako, Japan) and biotinylated goat anti-rat IgG antibody (1:200, Cosmo Bio Co, Tokyo, Japan). Staining was completed using 3,3'-diaminobenzidine (Sigma, USA) as the chromogen. Sections were lightly counterstained with Mayer’s hematoxylin (Wako Co, Tokyo, Japan), dehydrated and mounted. Some sections were used for Azan staining.
Morphometric analysis All sections were analyzed for staining using light microscopy (E800, Nikon, Tokyo, Japan) connected to an XYZ controller and a digital camera (Sony, Tokyo, Japan). Digitized images were then captured as digital images using Axiovision 4.3 software (Carl Zeiss Vision, Hallbergmoos, Germany). At least 15 islets per mouse pancreas and 3 mice per group were randomly chosen, and therefore, at least 45 islets per group were analyzed.
Cells positive for 8-OHdG staining were quantified by the presence of a dark brown nuclear stain. Observations were made from a minimum of 45 islets, and when quantified, were expressed as a percentage of the total number of islet cells.
The intensity of immunoreactions of 4-HNE, p22phox, p47phox and gp91phox within the islets were graded semiquan-titatively as follows: negative (score 0); weakly positive (lightly stained, but clearly differentiated from negative background, score 1); moderately positive (strongly stained area=2 places, score 2); and strongly positive (strongly stained area=3 places, score 3). Scores from a minimum of 45 islets were averaged for the evaluation of tissues from each subject. The names of photoes for the morphometric analysis were made single-blinded to the observers and agreement between the two observers was greater than 90%.
The β-cell mass analysis was determined on an insulin-stained section and was estimated by the following formula: islet β-cell mass (mg)=the area of β-cells/the area of the whole pancreatic area×pancreas weight (15 sections in each group). The area of insulin-stained pancreatic islets was automatically measured using image analysis software (Image-Pro Plus 5.0.1, Planetron, Tokyo, Japan). Insulin staining density was measured by image analysis software (Scion Image B 4.0.3 for Windows, Scion Corp, Frederick, Maryland, USA) with 30 islets in each group. CD31 staining intensity was calculated by the following formula: CD31 staining intensity (%)=the area of CD31 staining/the area of islet (30 islets in each group).
Electron microscopy The pancreas were removed after heart perfusion and fixed in a solution of 2.5% glutaraldehyde. The pancreas were cut into pieces of approximately 1 mm3.The pieces were fixed in 2.5% glutaraldehyde buffered to pH 7.4 with phosphate buffer for 2 h, and treated with osmium tetroxide for 2 h at 4 °C. The tissues were dehydrated with graded concentration ethanol, and then embedded in Epok 812. Thin section were cut with a Leica Ultracut UCT (Leica Mikrosysteme Gmbh, Wetzlar, Germany) with a diamond knife and stained with uranyl acetate followed by lead citrate. Electron micrographs were taken with a JEOL JEM-1200EX Electron Microscope (JEOL, Tokyo, Japan) operated at 80 kV. The relative volume of mitochondria was calculated by counting the area of mitochondria on random micrographs at ×20 000 magnification using Image-Pro Plus software (4 micrographs were used in each group).
Statistical analysis All values are given as mean±SEM. All statistical analyses were performed with SPSS for Windows 11.0 statistical software package (Chicago, Illinois, USA). One-way ANOVA was applied for multiple comparisons of data, while Student’s t-test was used for pair-wise comparisons. For all comparisons, a P value of less than 0.05 was considered statistically significant.
Results
Physiological and biochemical parameter At baseline, body weight, SBP, heart rate and blood glucose concentrations were similar in the db/db control group, ARB 1 mg/kg group, ARB 10 mg/kg group and manidipine group. After 6 weeks’ treatment, there was no significant change in body weight in all the groups, and the db/db control group showed a significant SBP increase (P=0.002), while the extent of blood pressure lowering was almost the same in the ARB 10 mg/kg group and manidipine group (P=0.604). At the starting point of 8 weeks’ of age, the blood glucose concentration exceeded 26 mmol/L in all db/db mice, which meant that diabetes had already reached a relatively severe state (Table 1).
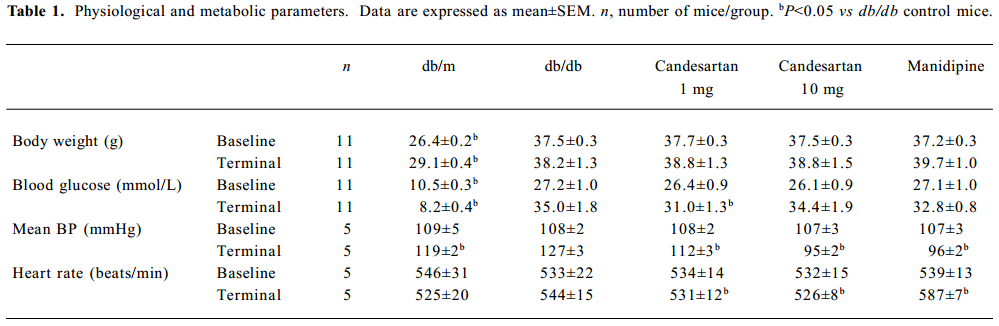
Full table
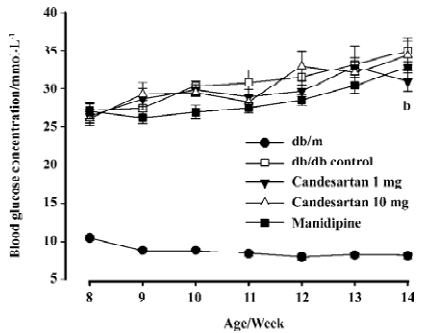
Glycemia deteriorated continuously in the db/db control mice during the study; it went above 30 mmol/L at the end of second week and was almost 4.3 times as that of db/m littermates of the same age at the terminate. Blood glucose concentrations of the candesartan 1 mg/kg treated group began to indicate slight amelioration after 2 week’s treatment, and the benefit appeared more legible at the terminal of study: glucose concentration of the candesartan 1 mg/kg treated group was significantly lower than that of the db/db control mice (P<0.05) after 6 weeks’ treatment (Figure 1). There was no statistical significance observed in the candesartan 10 mg/kg and manidipine-treated groups when compared with the db/db control group.
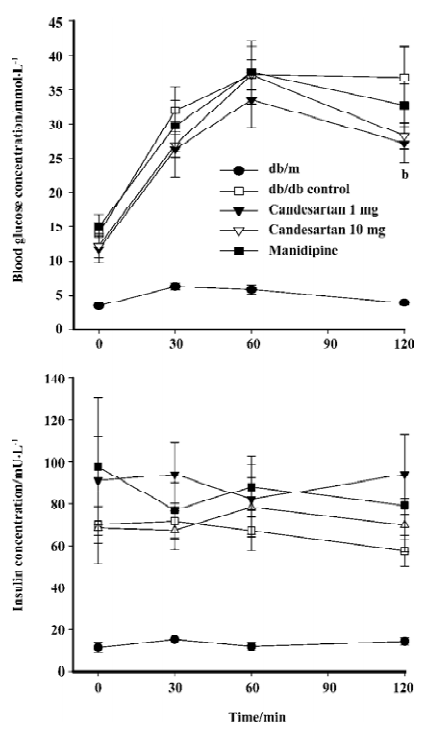
IPGTT The blood glucose concentration at 120 min after glucose load was significantly reduced by candesartan 1 mg/kg treatment when compared with that of the db/db control mice. Simultaneously-measured insulin concentration did not decrease, but rather tended to increase, although the difference was not significant. These results suggested that the improvement of glucose tolerance by candesartan was at least in part due to the improvement of β-cell function. The candesartan 10 mg/kg and manidipine-treated group did not show any statistically significant improvement on glucose tolerance (P=0.062, Figure 2).
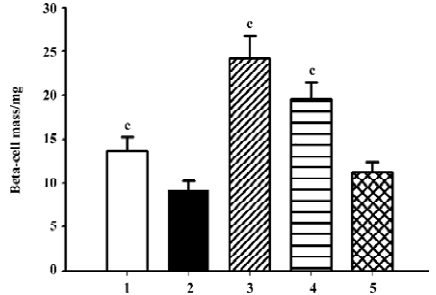
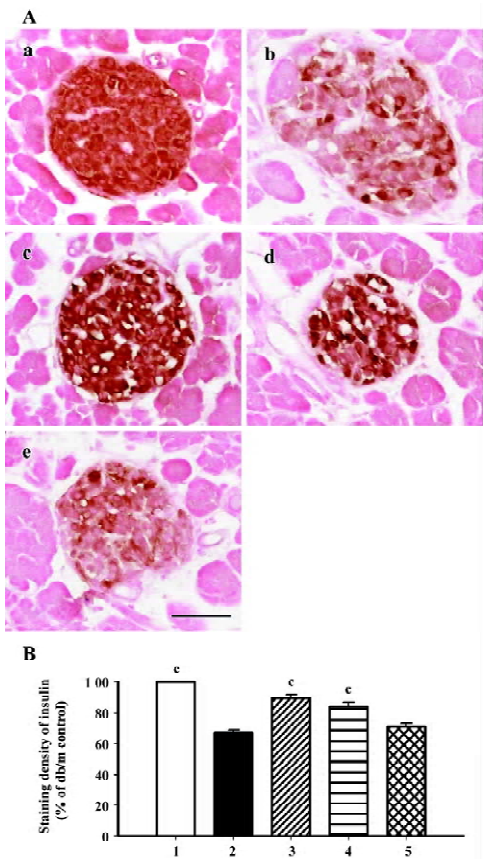
β-cell mass and insulin staining Diabetes is associated with characteristic and progressive changes in the structure of pancreatic islets. Such changes include loss of definition of the islet boundary, and a decrease of β-cell mass. β-cell mass was quite low in the db/db control group, and it was rescued greatly after 6 weeks’ treatment by both candesartan 1 mg/kg and 10 mg/kg (P<0.01 vs db/db control, Figure 3). In the db/m mice, insulin staining was strong and symmetrical, while it was sparse and asymmetric in the db/db mice treated with placebo (Figure 4A). Treatment with candesartan also notably improved staining density of insulin in the islets of db/db when compared with placebo (P<0.01), although it was still weaker than that of the db/m mice. Manidipine treatment did not show any effect on either β-cell mass or insulin intensity in the islets (Figure 4).
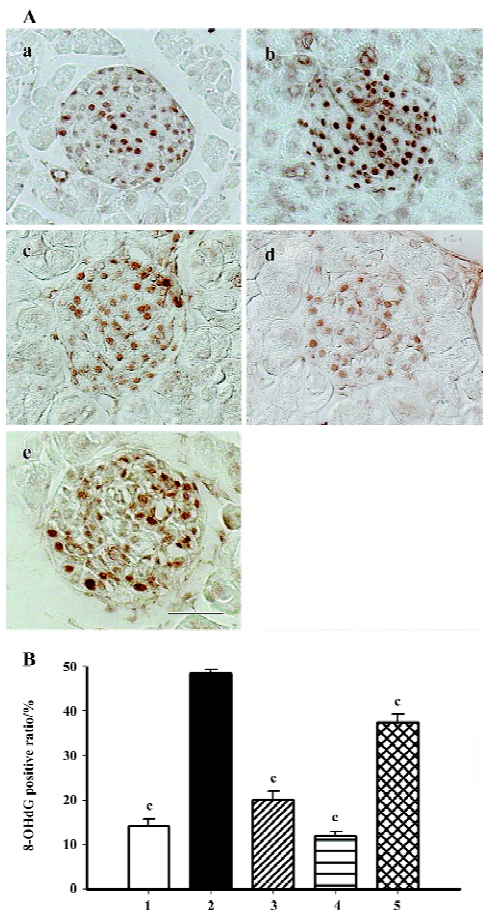
Immunohistochemistry of oxidative stress related markers 8-OHdG is used as the most sensitive marker of oxidative stress-related DNA injury. Positive staining was found exclusively in the nuclei of β-cells (Figure 5A). The percentage of dark brown nuclei in the db/db control group reached 48%, and when candesartan was used, the positive ratio markedly declined to 20% and 12%, which was similar to that of the db/m mice (14%). Manidipine treatment also provided moderate relief of oxidative stress-related DNA injury (Figure 5B).
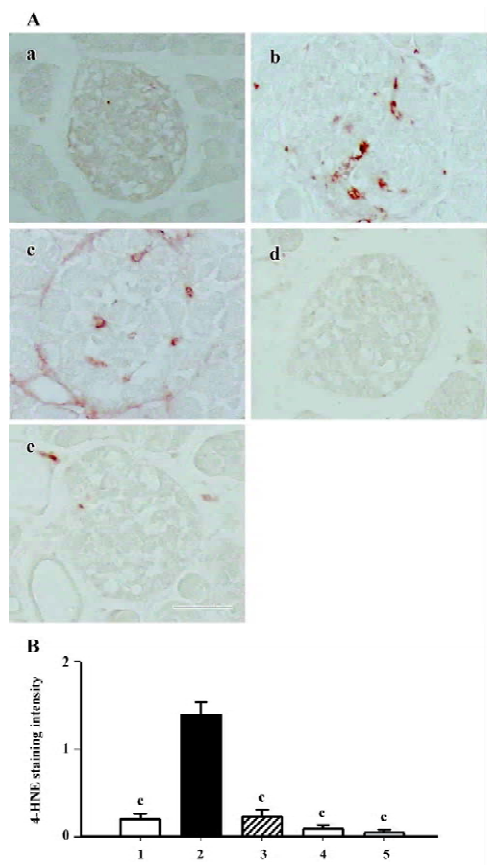
The 4-HNE modified protein is a marker of lipid peroxida-tion products. According to the results of this study, the positively stained area was dispersed among cytoplasm in the islets of the db/db control group. Interestingly, the 4-HNE modified protein greatly diminished when treated with either candesartan or manidipine (Figure 6).
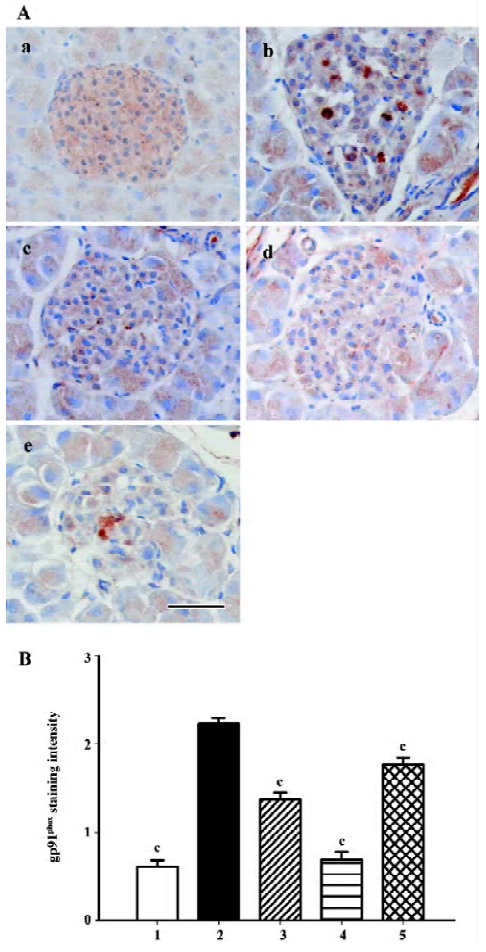
Gp91phox and p22phox are membrane-binding subunits of NADPH oxidase complex and they are thought to be important for the NADPH oxidase to work. The positive staining area appeared to be in the cytoplasm of the islet cells (Figures 7A, 8A). When semiquantitative analysis was taken into account, the islets of the db/db control group exhibited strongest gp91phox and p22phox staining. Candesartan 1 mg/kg treatment decreased the intensity of staining to almost a similar extent of the db/m mice, and candesartan 10 mg/kg treatment further ameliorated it. Manidipine treatment showed a less notable, but significant reduction of expression of gp91phox and p22phox (Figures 7, 8).
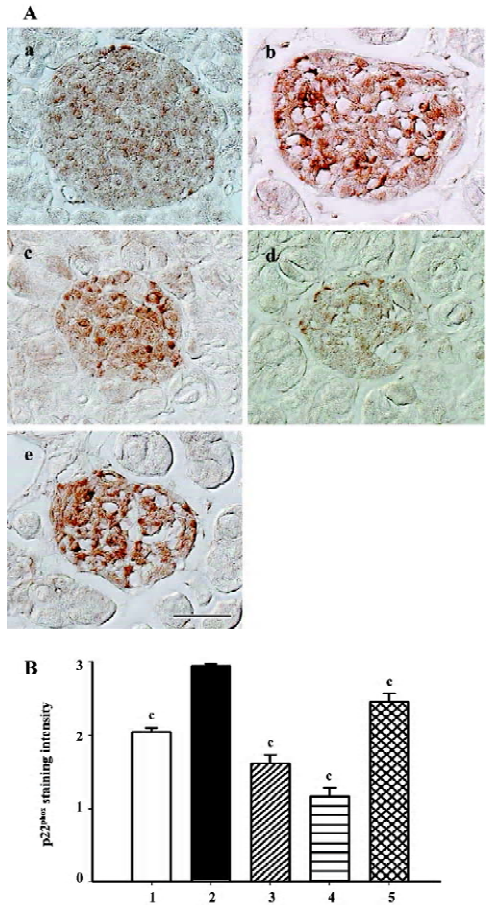
All these oxidative stress-related markers decreased with candesartan treatment and this benefit was shown to be in a dose-dependent manner.
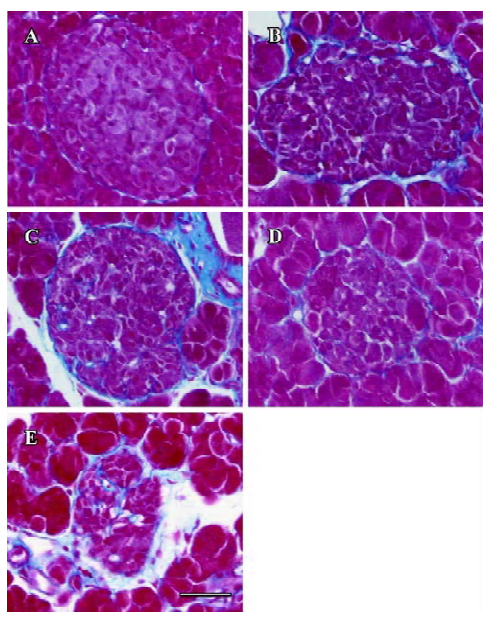
Fibrosis Azan staining showed that in the islet of the db/m mice, neither intra-islet nor around the islet was blue-stained collagen found. In the db/db control mice, blue-stained stripes were diffusely observed both intra-islet and around the islet, which meant severe fibrosis. The candesartan-treated db/db mice manifested obvious alleviation of fibrosis, especially intra-islet. Manidipine treatment hardly attenuated islet fibrosis (Figure 9).
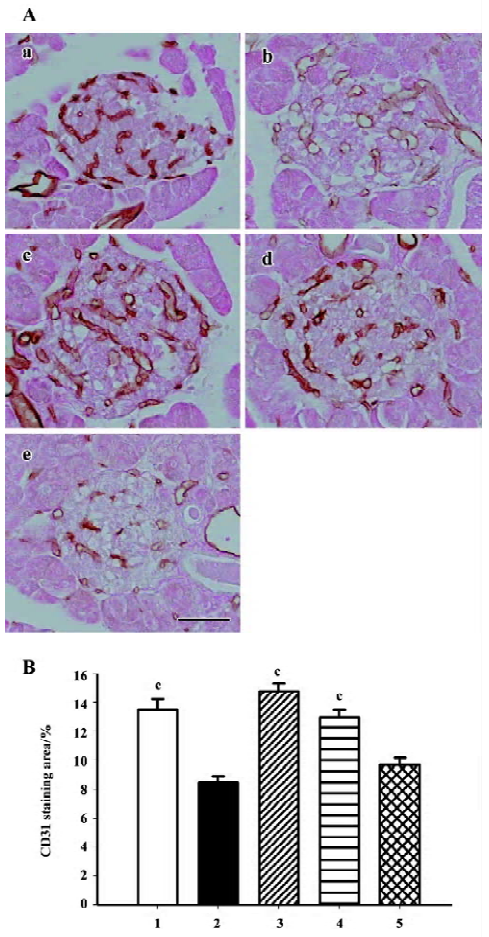
Intra-islet blood supply Endothelial cell marker CD31 (PECAM-1) staining was used to evaluate density of blood vessels within the islets. The islets of the db/m mice held abundant blood vessels while the lack of blood supply was discovered in the islets of the db/db mice. Candesartan treatment restored the amount of vasculature to a relative high level, similar to that of the db/m mice, while no improvement was found with manidipine treatment (Figure 10).
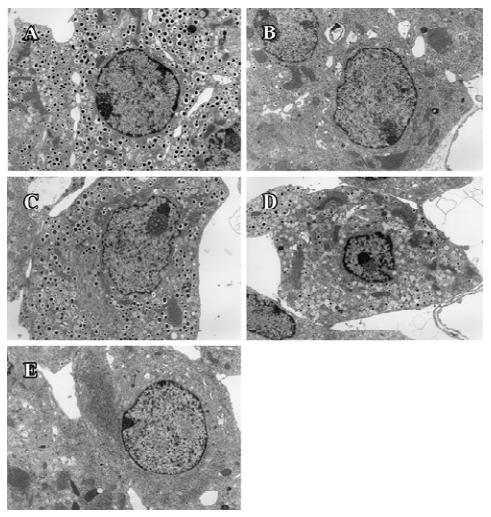
Ultrastructure of pancreatic β-cells Previous studies have also described ultrastructural changes within β-cells that are associated with diabetes. These changes include proliferation and hypertrophy of mitochondria, hypertrophy of Golgi complexes, extensive endoplasmic reticulum and severe reduction of the number of insulin secretory granules. We observed similar derangements in the β-cells of the db/db control mice. Aggregates of lysosomes were also observed, a common feature of cells in the early stages of necrosis. β-cells from the candesartan-treated animals exhibited improved granulation and less remarkable endoplasmic reticulum and Golgi bodies (Figures 11, 12A). Furthermore, candesartan treatment significantly relieved the swelling of mitochondria (P<0.01) to nearly the same as that of the db/m group (Figure 12B). Not only did the volume decrease, but the percentage of normal-shaped mitochondria greatly increased in the candesartan-treated animals. The ultrastructure abnormity of the manidipine treated β-cell was similar to that of the db/db control.
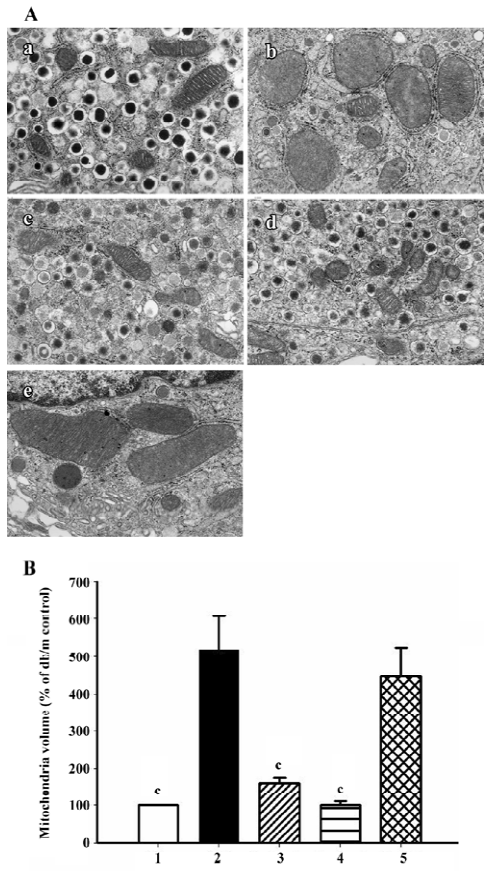
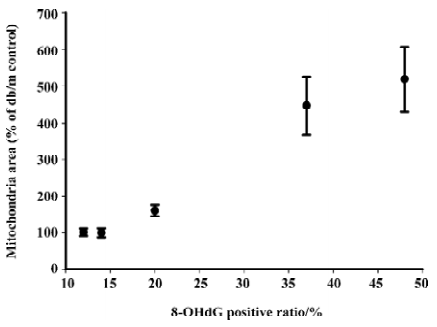
Correlation analysis was performed and found that mitochondria volume was strongly positively correlated to oxidative stress markers including 8-OHdG (r2=0.989, P<0.01; Figure 13), p22phox (r2=0.925, P <0.05) and gp91phox (r2=0.943, P<0.05) staining intensity.
Discussion
We found that candesartan treatment effectively protected pancreatic β-cell function failure independent of blood pressure lowering, and revealed the potential mechanism of the protective action of ARB by analyzing the status of oxidative stress, fibrosis, blood supply and the ultrastructure of the islets. The activity of the local RAS was an important determinant of structure and function in a range of organs, including the heart, kidneys and adrenals. Apart from its potent vasoconstrictor actions, some studies revealed that Ang II had several novel functions: stimulation and inhibition of cell proliferation, induction of apoptosis, generation of reactive oxygen species, regulation of hormone secretion, and pro-inflammatory and pro-fibrogenic actions. Recently, an intrinsic RAS was demonstrated in the pancreatic islets which have the lowest intrinsic antioxidant capacity. Such a local islet RAS, if activated, may drive islet fibrosis and reduce islet blood flow, oxygen tension, and insulin biosynthesis. Kampf et al demonstrated that endogenous levels of Ang II exerted detrimental effects on islet blood perfusion in transplanted mouse islets[9]. Moreover, the activation of an islet RAS may accelerate the synthesis of reactive oxygen species, aggravate oxidative stress-induced β-cell dysfunction and apoptosis, and thus contribute to the islet failure seen in type 2 diabetes[10]. Accordingly, blockade of the RAS could contribute to the development of novel therapeutic strategies in the prevention and treatment of patients with diabetes.
Despite the appearance of severe glycemia, even at 8 weeks of age, candesartan successfully improved glucose tolerance in diabetic db/db mice, although this protection was not quite enough to reverse the state of diabetes to normal. In any case, it assuredly provided some cooperative evidence for the protection of ARB on diabetes observed in large-scale epidemiological trials. We summarized a model showing the proposed roles of Ang II in pathogenesis of β-cell dysfunction and will discuss it in detail (Figure 14).
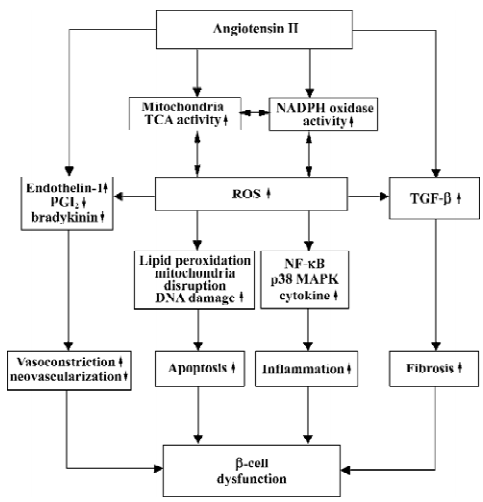
NADPH oxidase was originally discovered in neutrophils where it plays a vital role in nonspecific host defense by respiratory burst. In nonphagocytes under physiological conditions, NADPH oxidase was maintained at low levels by feedback of its production of reactive oxygen species (ROS), whereas the feed-forward mechanism may work to generate high levels of oxidative stress in a variety of diseases including atherosclerosis and inflammation. A recent study demonstrated that β-cells expressed p22phox and gp91phox, the membranous components of the NADPH oxidase[2]. In β-cells, glucose promotes the production of ROS by protein kinase C (PKC)-dependent activation of NADPH oxidase. It means that high glucose concentration in β-cells aggravates the generation of ROS and leads to damage of β-cells. Like glucose, Ang II also can increase the activity of NADPH oxidase in islets by either PKC-dependent mode or direct activation. The downstream effects of the activity of NADPH oxidase include increased ROS generation and following NF-κB and p38-MAPK activation, which lead to a vicious cycle resulting in inflammation, insulin resistance and β-cell dysfunction[11]. In our study, the existence of gp91phox and p22phox were confirmed in β-cells by immunohistochemical staining. NADPH oxidase expression was much stronger in the db/db control mice than in the db/m mice, and candesartan treatment reduced it significantly in a dose-dependent manner. This evidence supports our view that candesartan decreases the activity of NADPH oxidase by the inhibition of local RAS in islets.
Other oxidative stress markers such as 8-OHdG and the 4-HNE modified protein are also used widely in the evaluation of oxidative stress. In nuclear and mitochondrial DNA, 8-OHdG, an oxidized nucleoside of DNA, is the most frequently detected and studied DNA lesion. A recent study reported that elevated 8-OHdG correlated with hyperglycemia, and the severity of diabetic nephropathy[12]. In present study, candesartan treatment was proven to be very effective in reducing 8-OHdG levels which increased in the islets of the db/db mice. The same results were observed in 4-HNE staining. 4-HNE was proven to be a highly toxic lipid peroxi-dation product and second toxic messenger of free radicals. This multifunctional molecule, which derives from the most represented class of polyunsaturated fatty acids in the membranes, is potentially able to undergo a number of reactions with proteins, phospholipids and nucleic acids, and these modifications induce strong inhibitions of several enzymatic activities, calcium overload and apoptosis[13]. Thus, candesartan treatment comprehensively attenuated oxidative stress and the harm caused by ROS and lipid peroxidation. With RAS inhibition, the great amelioration of oxidative stress resulted in a protective effect on β-cells, which manifested as an increase of islet mass.
In the present study, we provide evidence that cande-sartan improves angiogenesis in the islets of diabetic mice. The reason for the lack of neovascularization in the db/db mice may be that Ang II not only increases vasoconstrictive factors such as endothelin-1, but also decreases vasodilative and pro-angiogenic factors as PGI2 and bradykinin. Ang II deprives bradykinin of postischemic neovascularization in local islet at low oxygen tension state caused by vasocons-triction. Therefore, candesartan rescued islet vasculature by activating the local bradykinin pro-angiogenic pathway. This opinion has also been proven in several studies where skeletal muscle and hind limb ischemia were observed[14,15]. The inhibition of local RAS in islets also brings about mitigation of islet fibrosis. Ang II upregulates expression of TGF-β and aggravates extracellular matrix accumulation intra-islet and around the islet. Islet fibrosis process parallels the duration of diabetes, and leads to severe β-cell dysfunc-tion. Candesartan treatment effectively avoided severe islet fibrosis by the inhibition of local RAS in the islets.
Mitochondria plays an important role in the development of type 2 diabetes. We observed remarkable increased mitochondria volume in the islets of db/db diabetic mice, which was in agreement with early studies[16–18]. It is speculated in an early study that the enlargement of mitochondria in β-cells is induced by demands to synthesize and secrete insulin, conformed to proliferative Golgi apparatus and rough endoplasmic reticulum, and depletion of secretory granules, but a recent theory seems to be more credible: mitochondria is one of the main sources of reactive oxygen species. It has been estimated that up to 2% of the total mitochondrial oxygen consumption results in ROS generation[19]. Mitochondria are also the cellular component most extensively affected by increased concentrations of ROS. The inner mitochondrial membrane is believed to be particularly susceptible to oxidative damage even under physiological conditions, for it is a major site where ROS, and a high content of polyunsaturated fatty acids, accumulate and react with each other, thus yielding a large amount of stronger lipid peroxidation products which incur alterations in the structure integrity of mitochondrial membranes, causing irreversible swelling and disruption. A previous study demonstrated that oxidative stress induced in vitro by ADP-Fe2+ in mitochondria strongly initiated a significant increase of lipid peroxidation (measured by O2 consumption and thiobarbituric acid reactive species formation) and concurrent increase of mitochondria volume[20]. Another study proves that antioxidative agents such as Ginkgo biloba extract (EGb 761) succeeds in protecting mitochondria in cells of liver and heart from enlarging using diabetic model animals[20,21]. Ang II increases NADPH oxidase activity and decreases NO levels, and both lead to aggravation of oxidative stress. Furthermore, the decline of NO levels directly upregulates the activity of mitochondria by removing the inhibition of cytochrome oxidase and aconitase in the TCA cycle, thus resulting in more ROS production and severe mitochondria damage. We described for the first time that the AT1-receptor blocker candesartan effectively prevented the mitochondria of β-cells from swelling and disruption in a dose-dependent manner, and maintained almost the normal size as those of the db/m mice. Moreover, the percentage of normal-shaped mitochondria also increased when compared with the untreated mice. The mechanism may lie on direct relief of mitochondrial hyper-action and reduction of the activity of NADPH oxidase and their downstream ROS products such as 4-HNE.
The discrepancy of effects on attenuating oxidative stress and on glucose tolerance as well as β-cell mass may be due to the overdose of candesartan when 10 mg/kg was used. Candesartan 10 mg/kg is hardly clinically achievable and may cause no harm to β-cell function. Results of CD31 staining demonstrated a decreased islet vasculature when candesartan dosage was added to 10 mg/kg. Also, some studies reported that candesartan could reduce vascular endothelial growth factor (VEGF) expression and subsequent angiogenesis in different organs[14,22,23], and this inhibition may partly counteract endothelium protection benefited from the alleviation of oxidative stress. Yet more studies are needed to reveal the accurate effects of candesartan on islets.
In conclusion, after diabetes was initiated, chronic candesartan treatment could not reverse the state of diabetes, which is consistent with several studies using other kinds of ARB[24,25], but 6 weeks’ candesartan treatment effectively improved glucose tolerance, remarkably decreased oxidative stress in β-cells, and prevented damage from the excess of NADPH oxidase and lipid peroxidation products, thus leading to the preservation of islet mass; we first found that ARB effectively prevented ultrastructure damage in β-cells of diabetes. All these benefits appear to be independent of blood pressure reduction, and the antioxidation effect seemed to be in a dose-dependent manner. The characteristics of candesartan may make itself a novel therapeutic means for protecting against progressive β-cell failure in diabetes.
Acknowledgements
We are grateful to Mrs Naoko DAIMARU, Yukiko TOYOFUKU and Eriko MAGOSHI for their skillful technical assistance.
References
- Sakuraba H, Mizukami H, Yagihashi N, Wada R, Hanyu C, Yagihashi S. Reduced beta-cell mass and expression of oxidative stress-related DNA damage in the islet of Japanese type II diabetic patients. Diabetologia 2002;45:85-96.
- Oliveira HR, Verlengia R, Carvalho CR, Britto LR, Curi R, Carpinelli AR. Pancreatic beta-cells express phagocyte-like Nad(P)H oxidase. Diabetes 2003;52:1457-63.
- Lindholm LH, Ibsen H, Borch-Johnsen K, Olsen MH, Wachtell K, Dahlof B, et al. Risk of new-onset diabetes in the losartan intervention for endpoint reduction in hypertension study. J Hypertens 2002;20:1879-86.
- Kjeldsen SE, Julius S, Brunner H, Hansson L, Henis M, Ekman S, et al. Characteristics of 15, 314 hypertensive patients at high coronary risk. The value trial. The Valsartan antihypertensive long-term use evaluation. Blood Press 2001;10:83-91.
- Yusuf S, Ostergren JB, Gerstein HC, Pfeffer MA, Swedberg K, Granger CB, et al. Effects of candesartan on the development of a new diagnosis of diabetes mellitus in patients with heart failure. Circulation 2005;112:48-53.
- Leung PS, Chappell MC. A local pancreatic renin-angiotensin system: endocrine and exocrine roles. Int J Biochem Cell Biol 2003;35:838-46.
- Leung PS, Carlsson PO. Tissue renin-angiotensin system: its expression, localization, regulation and potential role in the pancreas. J Mol Endocrinol 2001;26:155-64.
- Lau T, Carlsson PO, Leung PS. Evidence for a local angiotensin-generating system and dose-dependent inhibition of glucose-stimulated insulin release by angiotensin II in isolated pancreatic islets. Diabetologia 2004;47:240-8.
- Kampf C, Lau T, Olsson R, Leung PS, Carlsson PO. Angiotensin II type 1 receptor inhibition markedly improves the blood perfusion, oxygen tension and first phase of glucose-stimulated insulin secretion in revascularised syngeneic mouse islet grafts. Diabetologia 2005;48:1159-67.
- Leung PS, Carlsson PO. Pancreatic islet renin angiotensin system: its novel roles in islet function and in diabetes mellitus. Pancreas 2005;30:293-8.
- Evans JL, Goldfine ID, Maddux BA, Grodsky GM. Are oxidative stress-activated signaling pathways mediators of insulin resistance and beta-cell dysfunction? Diabetes 2003;52:1-8.
- Wu LL, Chiou CC, Chang PY, Wu JT. Urinary 8-Ohdg: a marker of oxidative stress to DNA and a risk factor for cancer, atherosclerosis and diabetics. Clin Chim Acta 2004;339:1-9.
- Dianzani MU. 4-Hydroxynonenal from pathology to physiology. Mol Aspects Med 2003;24:263-72.
- Ebrahimian TG, Tamarat R, Clergue M, Duriez M, Levy BI, Silvestre JS. Dual effect of angiotensin-converting enzyme inhibition on angiogenesis in type 1 diabetic mice. Arterioscler Thromb Vasc Biol 2005;25:65-70.
- Emanueli C, Minasi A, Zacheo A, Chao J, Chao L, Salis MB, et al. Local delivery of human tissue kallikrein gene accelerates spontaneous angiogenesis in mouse model of hindlimb ischemia. Circulation 2001;103:125-32.
- Boquist L, Hellman B, Lernmark A, Taljedal IB. Influence of the mutation “diabetes” on insulin release and islet morphology in mice of different genetic backgrounds. J Cell Biol 1974;62:77-89.
- Like AA, Chick WL. Studies in the diabetic mutant mouse. II. Electron microscopy of pancreatic islets. Diabetologia 1970;6:216-42.
- Diani AR, Sawada G, Wyse B, Murray FT, Khan M. Pioglitazone preserves pancreatic islet structure and insulin secretory function in three murine models of type 2 diabetes. Am J Physiol Endocrinol Metab 2004;286:E116-22.
- Fernandez-Checa JC, Garcia-Ruiz C, Colell A, Morales A, Mari M, Miranda M, et al. Oxidative stress: role of mitochondria and protection by glutathione. Biofactors 1998;8:7-11.
- Santos DL, Palmeira CM, Seica R, Dias J, Mesquita J, Moreno AJ, et al. Diabetes and mitochondrial oxidative stress: a study using heart mitochondria from the diabetic Goto-Kakizaki rat. Mol Cell Biochem 2003;246:163-70.
- Welt K, Weiss J, Martin R, Dettmer D, Hermsdorf T, Asayama K, et al. Ultrastructural, immunohistochemical and biochemical investigations of the rat liver exposed to experimental diabetes and acute hypoxia with and without application of ginkgo extract. Exp Toxicol Pathol 2004;55:331-45.
- Fujita M, Hayashi I, Yamashina S, Fukamizu A, Itoman M, Majima M. Angiotensin type 1a receptor signaling-dependent induction of vascular endothelial growth factor in stroma is relevant to tumor-associated angiogenesis and tumor growth. Carcinogenesis 2005;26:271-9.
- Kosugi M, Miyajima A, Kikuchi E, Horiguchi Y, Murai M. Angiotensin II type 1 receptor antagonist candesartan as an angiogenic inhibitor in a xenograft model of bladder cancer. Clin Cancer Res 2006;12:2888-93.
- Tikellis C, Wookey PJ, Candido R, Andrikopoulos S, Thomas MC, Cooper ME. Improved islet morphology after blockade of the renin-angiotensin system in the Zdf rat. Diabetes 2004;53:989-97.
- Nakayama M, Inoguchi T, Sonta T, Maeda Y, Sasaki S, Sawada F, et al. Increased expression of Nad(P)H oxidase in islets of animal models of type 2 diabetes and its improvement by an At1 receptor antagonist. Biochem Biophys Res Commun 2005;332:927-33.