
Multiple actions of lysophosphatidylcholine in human Jurkat T cells1
Introduction
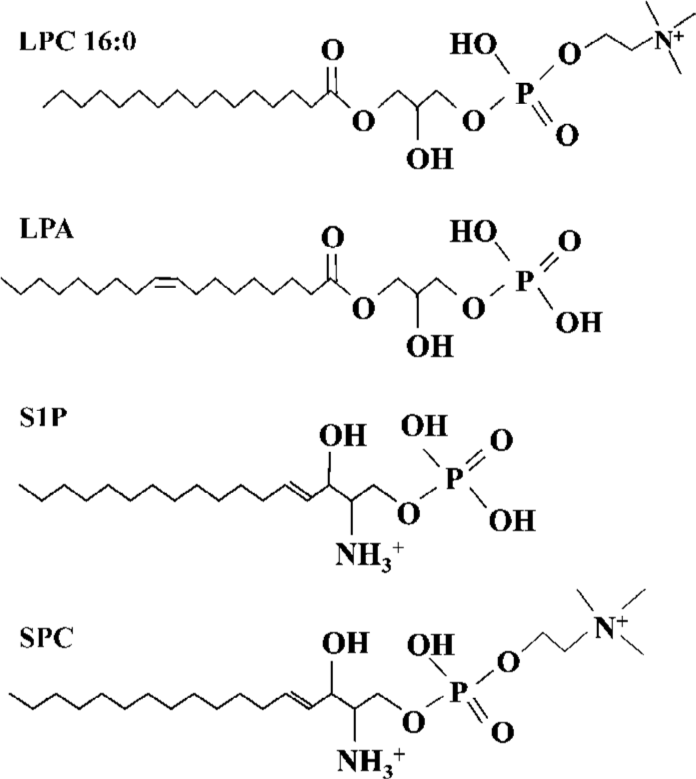
Lysophospholipids regulate a variety of biological processes including cell proliferation, tumor cell invasiveness and inflammation[1,2]. lysophosphatidylcholine (LPC) (Figure 1)[3,4], produced by the action of phospholipase A2 (PLA2) on phosphatidylcholine, promotes inflammatory effects, including the increased expression of endothelial cell adhesion molecules and growth factors, monocyte chemotaxis[5], and macrophage activation[6]. As a component of oxidized low-density lipoprotein (LDL), LPC plays an etiological role in atherosclerosis[7], and is implicated in the pathogenesis of the autoimmune disease, systemic lupus erythematosus (SLE)[8]. LPC was initially discovered as a ligand for G protein-coupled receptors, G2A and GPR4, and could stimulate PTX-sensitive intracellular Ca2+ transients and extracellular signal-related kinase (ERK) phosphorylation in transfected cells[9,10]. Expression of G2A also caused a decrease of MMP in HeLa cells[11].
Reactive oxygen species (ROS) exert numerous effects on cell functions, including induction of growth and regulation of kinase activity[12–14]. Oxidative stress plays a prominent role in the functioning of the immune system at both physiological and pathological levels, and is also known to be associated with reduced or abnormal immune function with aging[15], AIDS[16], diabetes[17], smoking-related pathologies[18], and some autoimmune and inflammatory diseases[19].
Jurkat T-cell line is made up of homogeneous T lymphocytes and possess membrane markers that characterize normal T lymphocytes[20]. In the present study, LPC was found to induce ROS generation in human lymphocytic Jurkat T cells, and its mechanism was investigated. In particular, LPC-stimulated depolarization of MMP and [Ca2+]i increase were investigated in relationship with ROS generation.
Materials and methods
Materials 1-Hexanoyl (C6:0) LPC, 1-octanoyl (C8:0) LPC, 1-decanoyl (C10:0) LPC, 1-lauroyl (C12:0) LPC, 1-myristoyl (C14:0) LPC, 1-palmitoyl (C16:0) LPC, 1-stearoyl (C18:0) LPC, 1-oleoyl (C18:1) LPC, 1-nonadecanoyl (C19:0) LPC, 1-arachi-doyl (C20:0) LPC, 1-lignoceroyl (C24:0) LPC, lysophospha-tidic acid (LPA), lysophosphatidylserine (LPS), lysophospha-tidylethanolamine (LPE), sphingosylphos-phorylcholine (SPC), sphingosine 1-phosphate(S1P), and lysophospha-tidylglycerol (LPG) were purchased from Avanti Polar Lipids (Alabaster, AL, USA). Fura 2/acetoxymethyl ester was from Calbiochem (Darmstadt, Germany). 2',7' dichlorofluorescin diacetate(DCFDA), antimycin A, N-acetyl cystein (NAC), indomethacin, diphenyleneiodonium (DPI), cis-N-(2-phenyl-cyclopentyl)-azacyclotridec-1-en-2-amine (MDL 12330A), pertussis toxin (PTX), ethylene glycol-bis(2-aminoethyl-ether)-N,N,N',N'-tetraacetic acid (EGTA), α-tocopherol and cyclosporine A were from Sigma-Aldrich (St Louis, MO, USA). 5,5',6,6' bensimidazolyl tetrachloro 1,1',3,3'-tetraethyl-carbocyanine iodide (JC-1) was from Biotium (Hayward, CA, USA). 2-[1-(3-(Amidinothio)propyl)-1H-indol-3-yl]-3-(1-methylindol-3-yl)maleimide· methanesulfonate (Ro 31-8220), bisindolymaleimide 1/2-[1-(3-dimethyl aminopropyl)indol-3-yl]maleimide (GF 109203X), and U73122 were from Biomol (Plymouth Meeting, PA, USA). Chelerythrine, rottlerin, staurosporin, trans-4-[(1R)-1-Aminoethyl]-N-4-pyridinyl-cyclohexane carboxamide (Y27632), carbonyl cyanide p-trifluoromethoxyphenylhydrazone (FCCP), and A23187 were from Tocris Cookson (Avonmouth, Bristol, UK).
Cell culture Jurkat T cells were maintained in RPMI 1640 media containing 10% (v/v) fetal bovine serum, 100 U/mL penicillin, 50 µg/mL streptomycin, 2 mmol/L glutamine, and 1 mmol/L sodium pyruvate at 37 ºC in a humidified 5% CO2 incubator.
Measurement of ROS The cells were sedimented, resuspended in Hepes-buffered medium consisting of 20 mmol/L Hepes (pH 7.4), 103 mmol/L NaCl, 4.8 mmol/L KCl, 1.2 mmol/L KH2PO4, 1.2 mmol/L MgSO4, 0.5 mmol/L CaCl2, 25 mmol/L NaHCO3 and 15 mmol/L glucose, and then incubated for 20 min with 10 µmol/L DCFDA. Fluorescence was measured in DCFDA-loaded cells. Fluorescence emission at 520 nm wavelength from 488 nm excitation wavelength was measured every 0.1 s by F4500 fluorescence spectrophotometer(Hitachi, Tokyo, Japan). Individual histogram was made by the percent of control level, and ROS was measured more than twice.
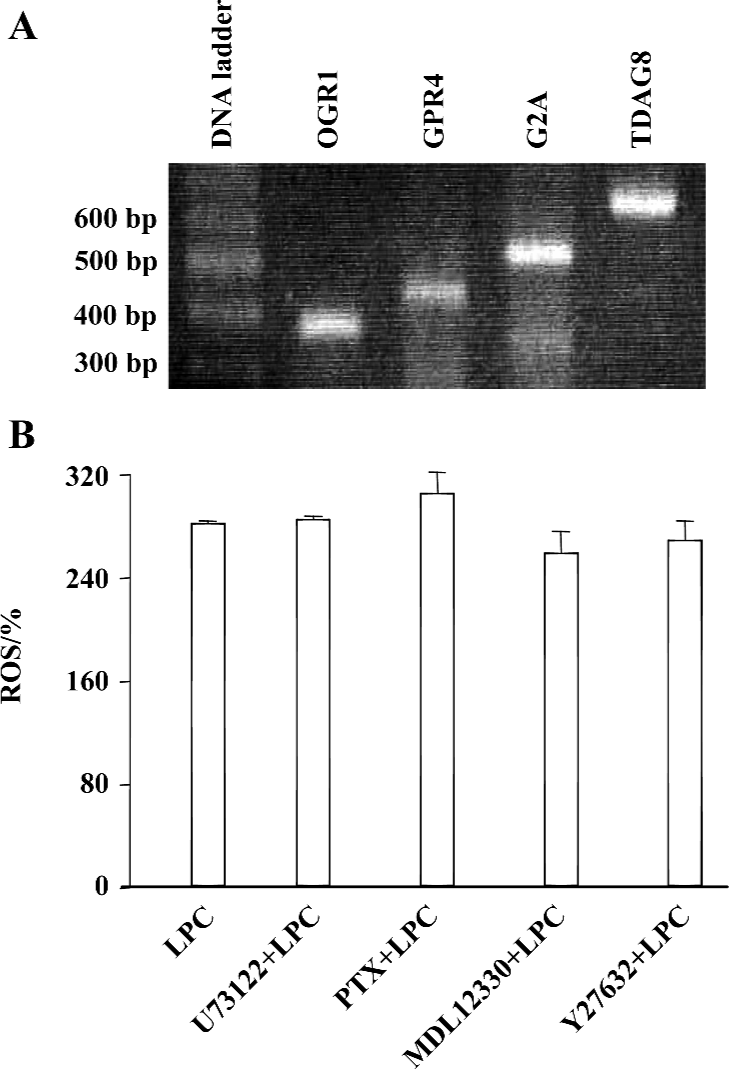
Reverse Transcriptase-PCR To confirm the expression of GPCR in Jurkat T cells by RT-PCR, first-strand cDNA was synthesized with total RNA isolated by the ImProm-II Reverse Transcription System (Promega, Madison, WI, USA). Synthesized cDNA product was used for PCR with the primers for OGR1, GPR4, G2A, and TDAG8 by Go-Taq DNA polymerase (Promega, Madison, WI, USA). Specific primers for human OGR1 (sense 5'-TTC CTG CCC TAC CAC GTG TTG C-3', antisense 5'-TGG CGA GTT AGG GGT CTG GAA G-3'), human GPR4 (sense 5'-ACC TCT ATC GGG TGT TCG TG-3', antisense 5'-TTC CTC TTG GAG GTG AGT GG-3'), human G2A (sense 5'-CCG CCT ACA TCT TCT TCT GC-3', antisense 5'-ACA GGC ACA GAA ACA CCA CA-3'), or TDAG8 (sense 5'-TGC AAA GGG AGT GCT TTT CT-3', antisense 5'-CAC CTC CCA GTG CAG AAT TT-3') were used to amplify 341, 400, 500, and 600 bps of fragments of OGR1, GPR4, G2A, and TDAG8, respectively. The PCR reaction was performed by 30 cycles of denaturation at 95 oC for 30 s, annealing at 55 oC for 1 min, and elongation at 72 oC for 2 min[21].
Measurement of mitochondrial membrane potential (ΜΜP) Mitochondrial membrane potential was measured using JC-1. JC-1 is a cationic mitochondrial vital dye that is lipophilic and becomes concentrated in the mitochondria in proportion to the membrane potential; the more dye that accumulates in mitochondria, the greater MMP and ATP generating capacity. The dye exists as a monomer at low concentrations (emission, 530 nm, green fluorescence), but forms J aggregates at higher concentrations (emission, 590 nm, red fluorescence). Cells were labeled for 20 min with 1 µmol/L JC-1 at 37°C, washed and resuspended in the Hepes-buffered medium. Fluorescence was monitored at two different wavelengths, and the ratio of the reading at 590 nm to the reading at 530 nm (590:530 ratio) was considered as the relative MMP value.
Measurement of [Ca2+]i The cells were sedimented, resuspended in the Hepes-buffered medium, and then incubated for 40 min with 5 µmol/L Fura 2/acetoxymethyl ester. Fura 2-loaded cells were washed twice with the Hepes-buffered media and resuspended in the same media. Fluorescence emission at 510 nm wavelength from two excitation wavelengths (340 nm and 380 nm) were measured every 0.1 s (F4500, Hitachi). The ratio of fluorescence intensities from the two wavelengths was monitored as an estimate of [Ca2+]i.
Statistical analysis Student’s t-test was conducted to analyze significant differences between measured ROS levels.
Results
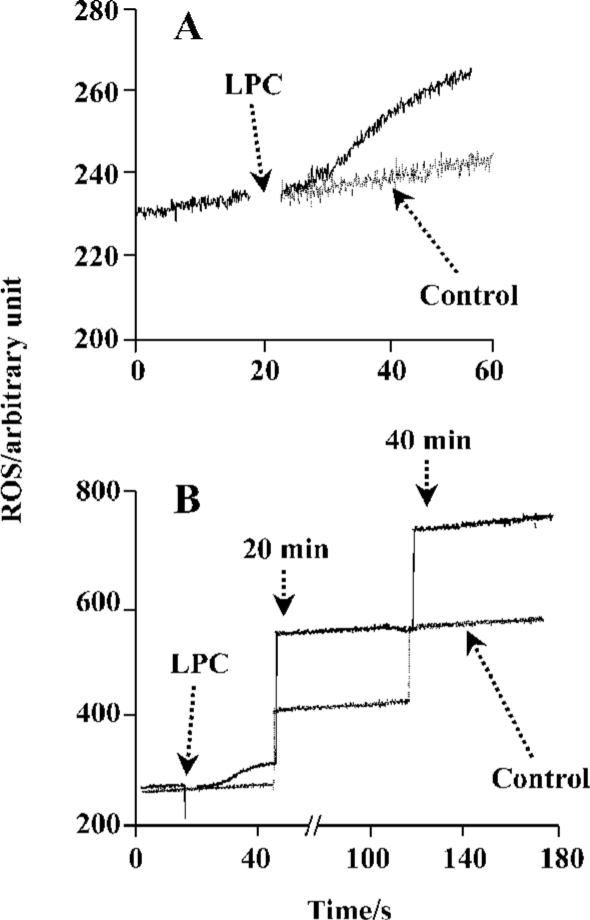
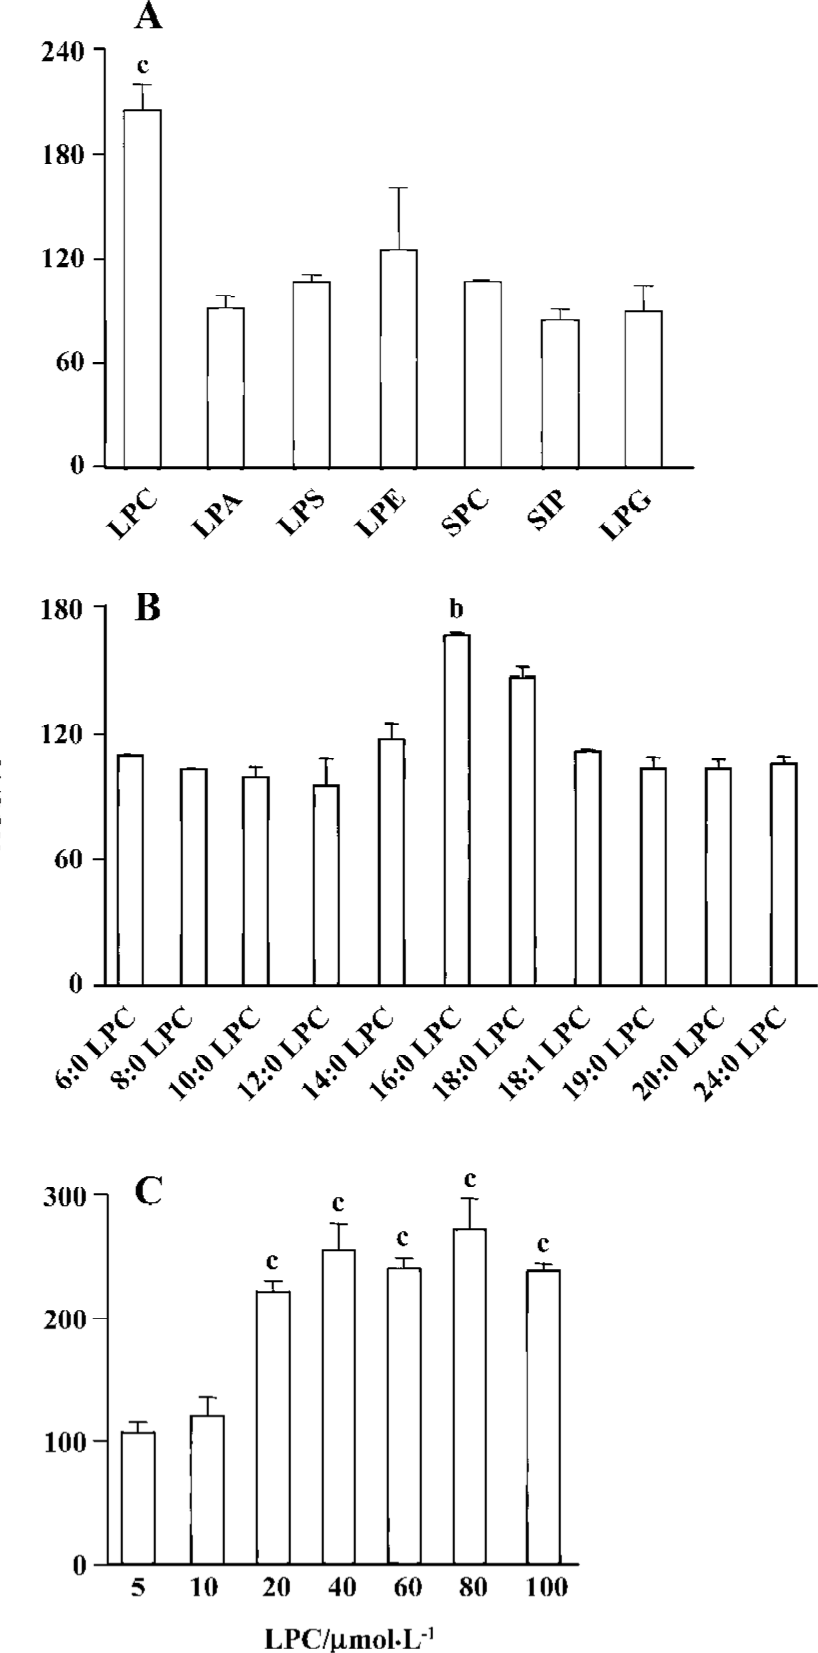
LPC stimulated ROS generation in Jurkat T cells 20 µmol/L 16:0 LPC rapidly and significantly increased ROS level in Jurkat T cells compared with vehicle-treated control. LPC-induced ROS generation continued up to 40 min (Figure 2). 16:0 LPC generated the highest level of ROS increase, compared with other structurally related lysolipids, including LPA, LPS, LPE, SPC, S1P, and LPG (Figure 3A). The optimum chain length of LPC for ROS generation was found to be 16 (Figure 3B), and LPC-induced ROS production was observable with 20 µmol/L or higher concentrations (Figure 3C).
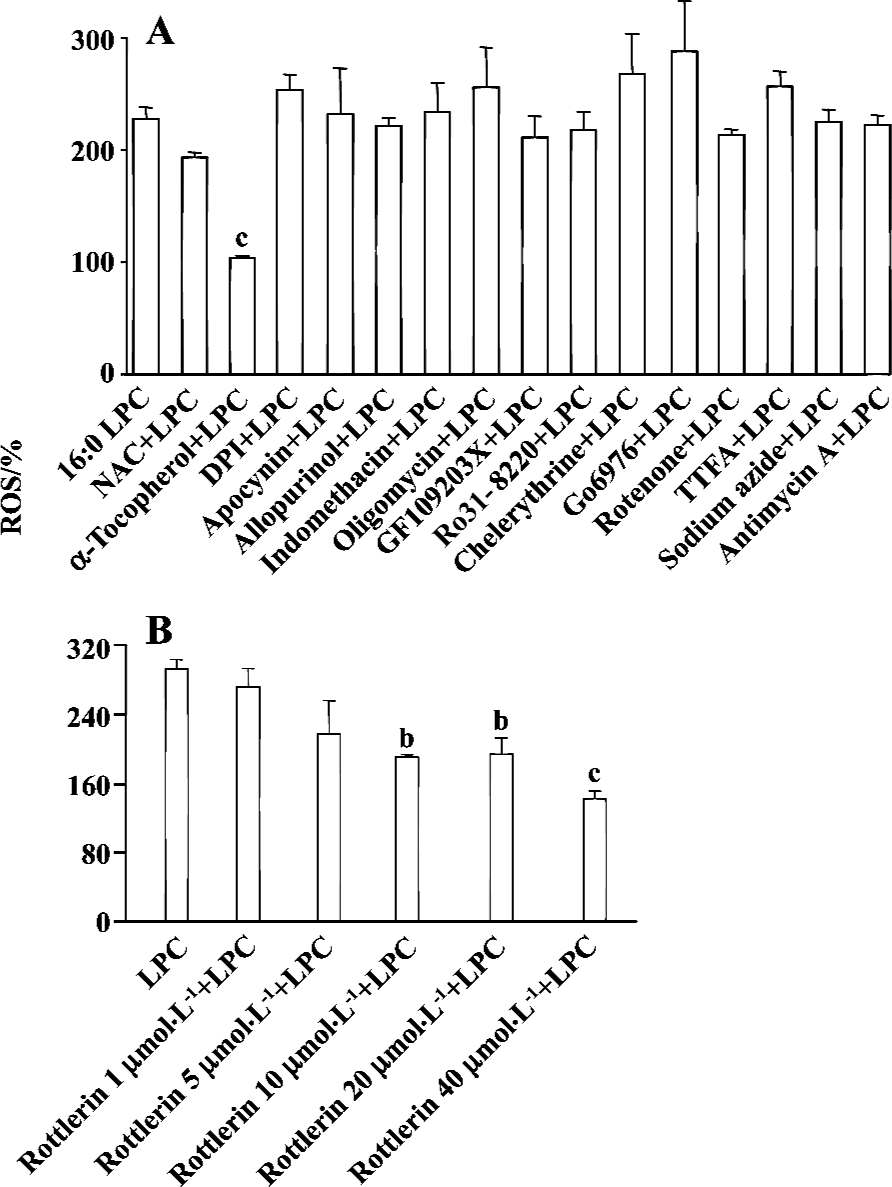
PKCδ dependency of LPC-induced ROS production In order to elucidate which enzymes and signaling molecules were involved in LPC-induced ROS generation, antioxidants (NAC and α-tocopherol), NAD(P)H oxidase inhibitors (DPI and apocynine), xanthine oxidase inhibitor (allopurinol), cyclooxygenase inhibitor (indomethacin), mitochondrial ATP synthase inhibitor (oligomycin) and PKC inhibitors (chelerythrine, GF 109203X, Ro 31-8220, and Go 6976), and mitochondrial complex inhibitors (I: rotenone, II: thenoyl-trifluoroacetone (TTFA), III: sodium azide and IV: antimycin A) were tested together with 16:0 LPC on ROS measurement. Antioxidant α-tocopherol and PKCδ inhibitor rottlerin were found to be inhibitory on 16:0 LPC-induced ROS generation, and the inhibitory effect of rottlerin was concentration-dependent (Figure 4). Because mRNA expression of G2A family GPCR, of which G2A and GPR4 were initially reported as GPCR for LPC, were detected in Jurkat T cells (Figure 5A), inhibitors of PLC, Gi/o proteins, adenylyl cyclase and rho-dependent kinase, were also tested (Figure 5B). However, U73122 (a specific inhibitor of PLC), PTX (a specific inhibitor of Gi/o proteins), MDL 12330A (a specific inhibitor of adenylyl cyclase), and Y27632 (a specific inhibitor of rho-dependent kinase) did not exert any inhibitory effect on LPC-induced ROS generation (Figure 5B). Therefore, GPCR expressed in Jurkat T cells may not appear to be involved in LPC-induced ROS production.
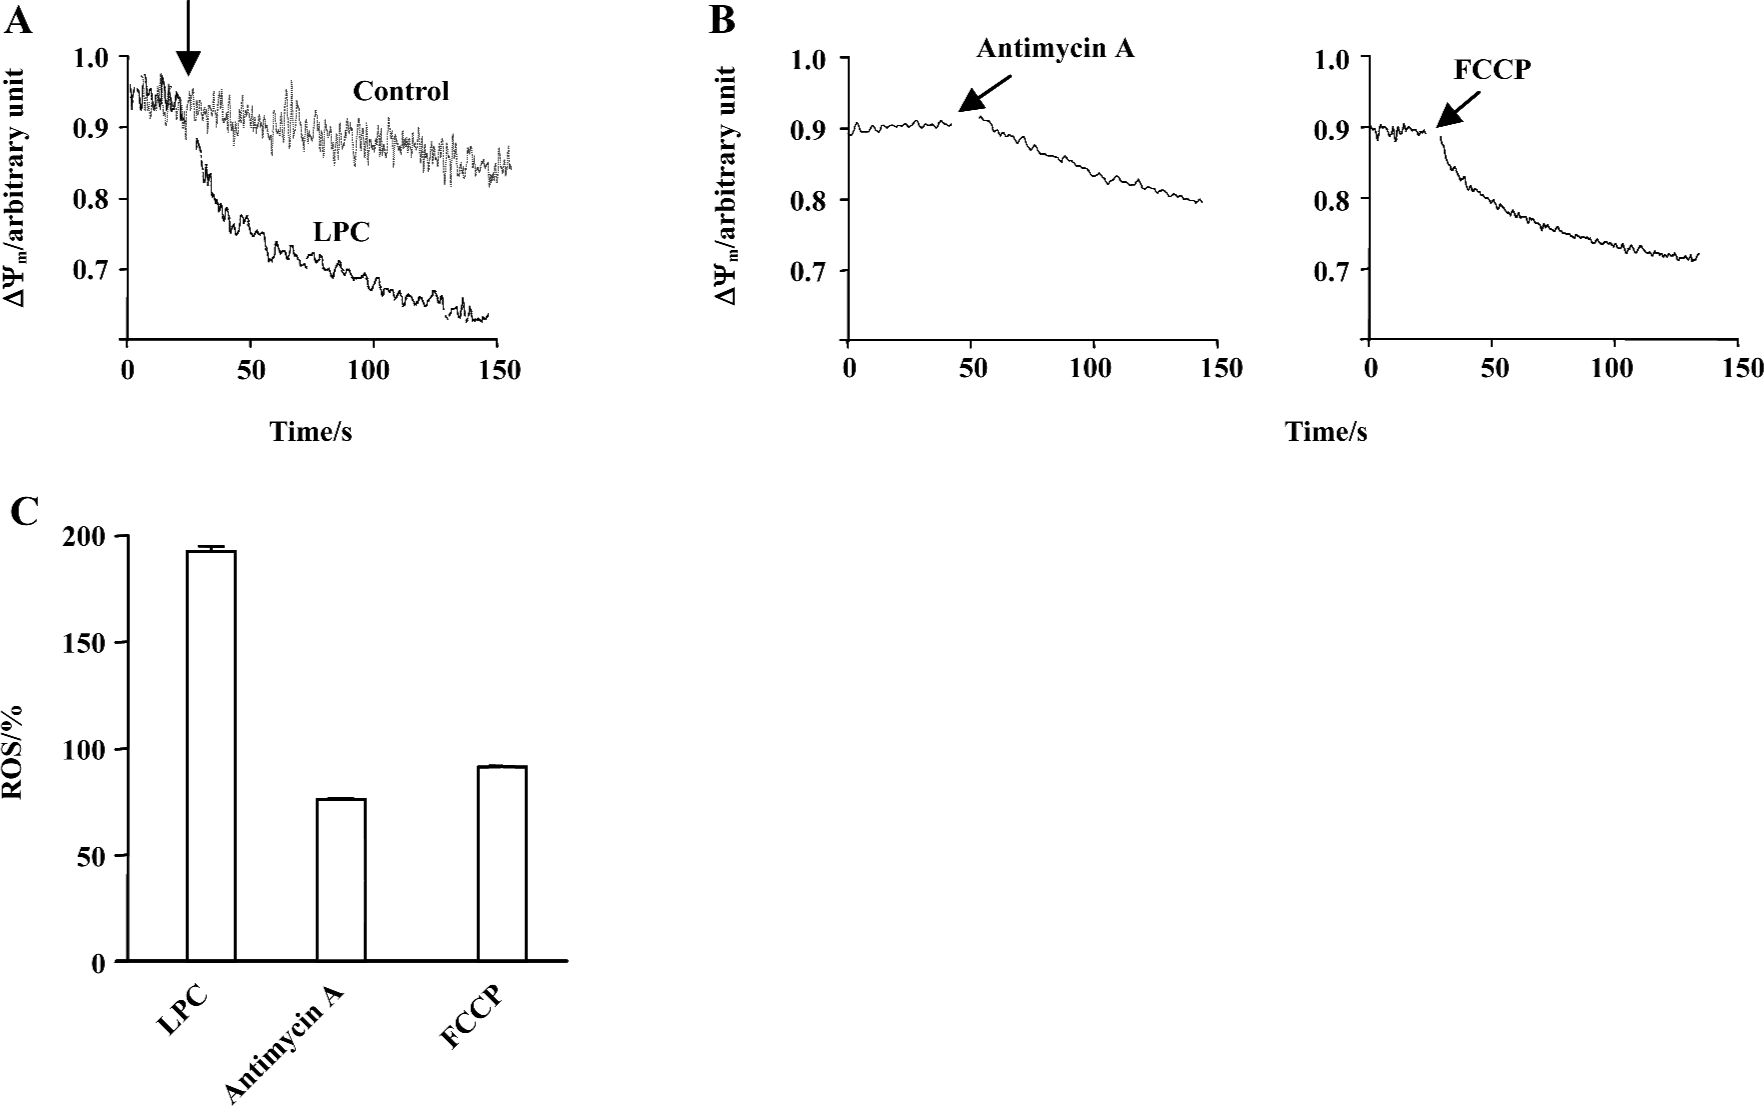
LPC-induced depolarization of mitochondrial membrane potential Recently, changes of MMP were found to result from the inhibition of mitochondrial complex and this inhibition caused ROS generation[22]. Furthermore, the expression of G2A caused a decrease of MMP and LPC-stimulated T lymphocytes showed a reduction of MMP[11]. Therefore, MMP was measured along with LPC in Jurkat T cells: 20 µmol/L LPC significantly decreased JC-1 fluorescence compared with control, indicating depolarization of MMP (Figure 6A). Respiratory chain complexes are located in the mitochondria and maintain MMP through protons generated during electron transfer. Therefore, it is expected that any interference with electron transport would influence MMP. As seen in Figure 6C, mitochondrial complex IV inhibitor, antimycin A and H+ ionopore FCCP, caused significant depolarization of MMP (Figure 6B). However, antimycin A and FCCP did not increase ROS level (Figure 6C). In order to further elucidate whether LPC-induced ROS production caused depolarization of MMP, antioxidant α-tocopherol was used and found to have no inhibitory effect on LPC-induced depolarization of MMP (data not shown).
One of the changes associated with dissipation of MMP in some cell systems is the opening of the mitochondrial megachannel or permeability transition pore (PTP)[23]. Therefore, cells were preincubated with cyclosporin A, a blocker of the PTP[24], before exposure to LPC to see whether cyclosporine A-sensitive channels were operative during LPC-induced dissipation of MMP. Cyclosporin A induced the slow decrease of MMP by itself, however, it did not prevent MMP reduction by LPC (data not shown).
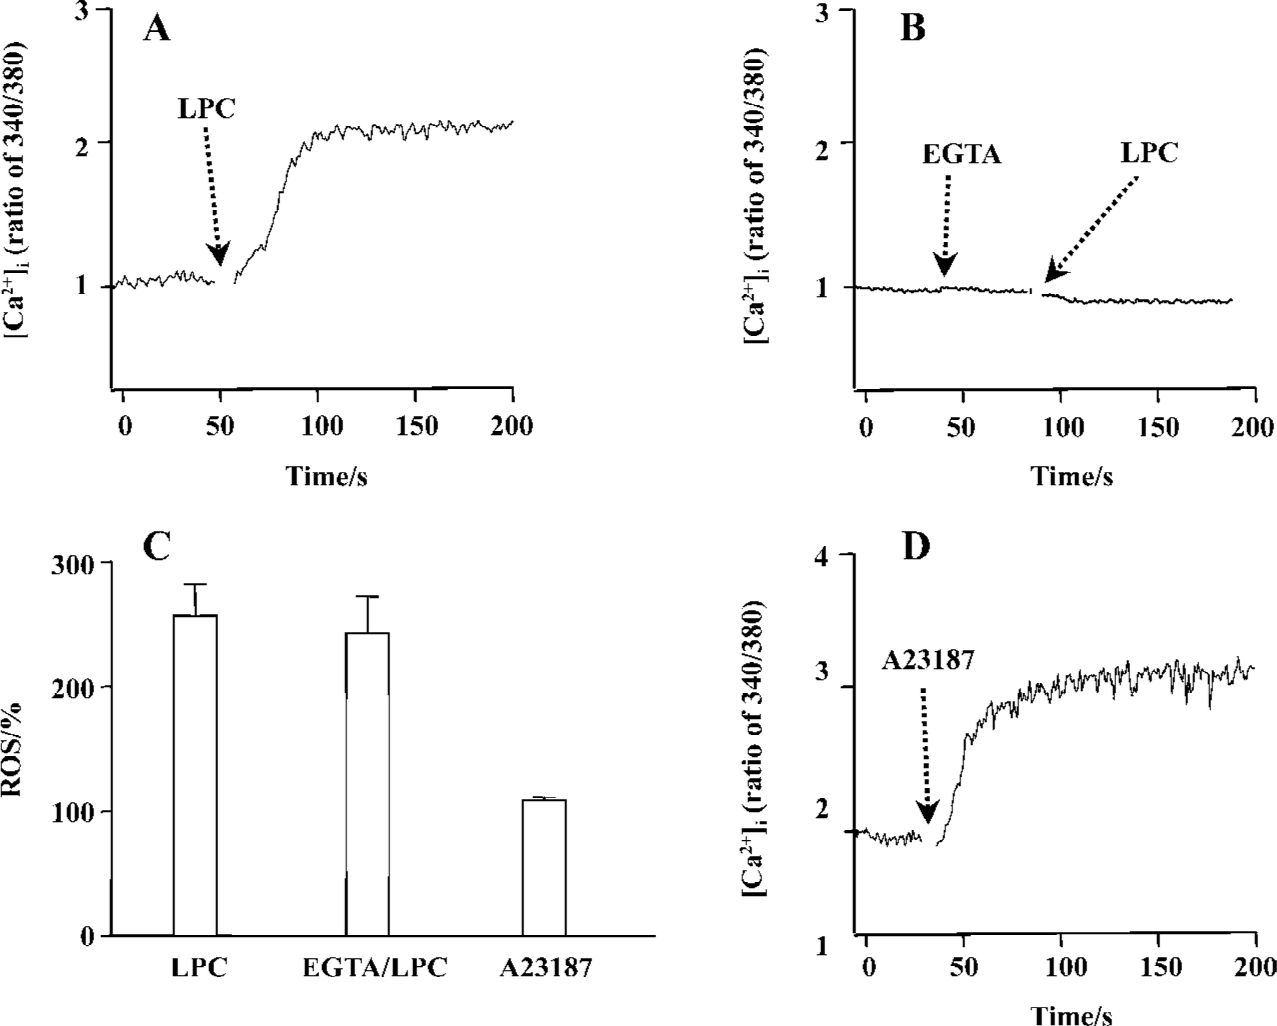
LPC-induced [Ca2+]i increase and ROS generation Recent data show that LPC elevate the [Ca2+]i in Jurkat T cells[25]. Thus, the effect of LPC on [Ca2+]i and its involvement with ROS were studied. As shown in Figure 7A, the same concentration of LPC as tested on ROS measurement sharply increased [Ca2+]i and this increase was eliminated by an extracellular calcium chelator (EGTA) (Figure 7B), implying that LPC-induced [Ca2+]i increase resulted from calcium influx across the plasma membrane. To determine whether LPC-induced [Ca2+]i increase caused ROS production, the cells were pretreated with extracellular Ca2+ chelator EGTA; however, EGTA pretreatment did not prevent LPC-induced ROS production (Figure 7C). And Ca2+ ionophore A23187, which increased [Ca2+]i (Figure 7D), also could not generate ROS (Figure 7C). We also examined whether this LPC-induced intracellular ionic change such as Ca2+ influx could influence MMP, however, EGTA could not abrogate LPC-induced decrease of MMP (data not shown).
Discussion
LPC is one of the major phospholipid components that is increased during the oxidation of LDL. LPC-induced ERK1/2 activation is mediated by ROS that are generated through the NAD(P)H oxidase in PKC-dependent or -independent pathway in vascular smooth muscle cells (VSMC)[26]. In human umbilical vein endothelial cells (HUVEC), oxLDL and LPC induce proliferation through activation of NAD(P)H oxidase that generates O2– [27].
Cellular sources of ROS production include xanthine/xanthine oxidase, NAD(P)H oxidase, lipoxygenase, cyclooxygenase, and mitochondrial electron transport components. In VSMC and endothelial cells, NAD(P)H oxidases represent the most important source of O2– [28,29]. NAD(P)H oxidase catalyzes the NADPH-dependent reduction of oxygen to O2–, which in turn leads to the production of secondary derivatives such as OH· and H2O2. Mitochondria are also one of the most important sites of ROS production under physiological conditions[30,31]. In this study, to elucidate the source of LPC-induced ROS generation, inhibitors of NAD(P)H oxidase, xanthine oxidase, cyclooxygenase, mitochondrial ATP synthase and mitochondrial complex were tested; however, their inhibitory effects were not observed.
ROS was produced by 16:0 LPC and 18:0 LPC, compared with other synthetic LPC. The optimum length of LPC acyl chain for ROS generation was 16 and even oleoyl LPC (18:1), that has an unsaturation on the acyl chain, couldn’t produce ROS, suggesting that structural bending by the double bond of unsaturated acyl chain of 18:1 LPC might prevent ROS generation. SPC is the counterpart structure of LPC in sphingolipids (SPC structure in Figure 1). However, SPC couldn’t produce ROS in Jurkat T cells and this might be due to the positive charge of amine group on the C2 position of SPC. The choline moiety of LPC seemed to be essential in ROS generation as other lysolipids with modified choline group, such as LPA, LPE and LPS, couldn’t produce ROS.
In VSMC, LPC induced ERK1/2 activation through ROS in PKC-dependent or -independent pathway and subsequent growth promotion[26]. It has also been reported recently that SPC treatment generated ROS in MS1 endothelial cells and the SPC-induced ROS production was inhibited by pretreatment of the cells with PKCδ specific inhibitor rottlerin[32]. In this study, rottlerin inhibited LPC-induced ROS generation in Jurkat T cells in a concentration-dependent manner, suggesting that LPC generates ROS through a PKCδ-dependent pathway.
G2A, named for its ability to cause accumulation of cells in G2/M phase of the cell cycle, is a GPCR with tumor suppressor-like properties[33]. Expression of G2A is transcriptionally upregulated by stress-inducing and cell-damaging agents, and the ectopic expression of G2A leads to growth inhibition. GPR4 is a member of the G2A subfamily, and stimulation of GPR4-overexpressing cells with its high affinity ligand, SPC, enhances DNA synthesis[10]. Furthermore, LPC could stimulate [Ca2+]i increase in Jurkat T cells[25]. In the present study, we observed that LPC induced [Ca2+]i increase; however, this event seemed to not be caused through GPCR, because inhibitors of PLC (U73122), Gi/o protein (PTX), adenylyl cyclase (MDL 12330A) and Rho-dependent kinase (Y27632) could not prevent LPC-induced [Ca2+]i increase (data not shown), as observed in LPC-induced ROS generation. Furthermore, [Ca2+]i increase through GPCR has usually been shown to release Ca2+ from intracellular calcium stores and subsequent Ca2+ influx; however, LPC-induced [Ca2+]i increase observed in this study was totally inhibited by extracellular Ca2+ chelator EGTA, suggesting that Ca2+ influx across the plasma membrane was the only Ca2+ source. Legradi et al reported that LPC-induced Ca2+ increase was dependent on PTX-sensitive G proteins in Jurkat T cells[25], but in our experiment it was not abrogated by PTX treatment. Two differences between their experiment and ours are Ca2+ increase patterns and used LPC concentrations. LPC-induced Ca2+ increase was observed approximately 1 min after the addition of LPC in the report of Legradi et al[25]. However, in our experiment the increase was observed within several seconds. Legradi et al used 90 µmol/L, which is higher than the 20 µmol/L used in our experiment[25]. Several different methods were also found, for example, different fluorescent dyes (Fluo-3 and FuraRed vs Fura-2), different sera (calf vs bovine), and assay media (RPMI 1640 vs Hepes-buffered solution). Currently, we are not able to explain why the results are not compatible. However, our data in ROS production experiment and with other inhibitors support our observation, which is GPCR-independent Ca2+ increase. The lag time of 1 min in their observation is unusual, because Ca2+ increase by GPCR activation is normally observed within several seconds.
A23187, a Ca2+ ionopore, quickly increased [Ca2+]i, but couldn’t increase ROS. Furthermore, pretreatment with EGTA couldn’t abrogate LPC-induced ROS generation, therefore, LPC-induced [Ca2+]i increase seemed to be not a cause of LPC-induced ROS generation. Expression of G2A caused a decrease of MMP and T lymphocytes that were stimulated with nanomolar concentrations of LPC (0.01 or 0.5 µmol/L) showing depolarization of MMP[11]. Jurkat T cells have the intrinsic G2A receptor expression and showed dramatic depolarization of MMP. Mitochondrial respiratory chain is also one of the most important sites of ROS production under physiological conditions, and mitochondrial complex inhibition caused dissipation of MMP and generated ROS[22]. In this study, antimycin A, complex IV inhibitor, and FCCP, a H+ ionopore, caused depolarization of MMP, but both failed to generate ROS. Therefore, mitochondrial dysfunction does not seem to be related to ROS generation in Jurkat T cells. Furthermore, because α-tocopherol couldn’t prevent LPC-induced MMP depolarization, LPC-induced reduction of mitochondrial membrane potential seems to not be involved in LPC-induced ROS generation. By using cyclosporin A, PTP inhibitor, we found that PTP is also not involved in LPC-induced MMP depolarization.
In summary, LPC-induced cellular responses in Jurkat T cells were found to include ROS generation, [Ca2+]i increase, and depolarization of mitochondrial membrane potential. 16:0 LPC induced the maximal responses among structurally related lysophospholipids and LPC with different lengths of acyl chain. LPC-induced ROS generation was dependent on PKCδ, that independent of GPCR, although four members of G2A family GPCR were expressed in Jurkat T cells. This study suggests novel action mechanisms of LPC that are not mediated through GPCR and are independent from each other.
References
- Spiegel S, Milstien S. Sphingolipid metabolites: members of a new class of lipid second messengers. J Membr Biol 1995;146:225-37.
- Moolenaar WH. Bioactive lysophospholipids and their G protein-coupled receptors. Exp Cell Res 1999;253:230-8.
- Kume N, Cybulsky MI, Gimbrone MA Jr. Lysophosphatidyl-choline, a component of atherogenic lipoproteins, induces mononuclear leukocyte adhesion molecules in cultured human and rabbit arterial endothelial cells. J Clin Invest 1992;90:1138-44.
- Kume N, Gimbrone MA Jr. Lysophosphatidylcholine transcriptionally induces growth factor gene expression in cultured human endothelial cells. J Clin Invest 1994;93:907-11.
- Jing Q, Xin SM, Zhang WB, Wang P, Qin YW, Pei G. Lysophos-phatidylcholine activates p38 and p42/44 mitogen-activated protein kinases in monocytic THP-1 cells, but only p38 activation is involved in its stimulated chemotaxis. Circ Res 2000;87:52-9.
- Yamamoto N, Homma S, Millman I. Identification of the serum factor required for in vitro activation of macrophages. Role of vitamin D3-binding protein (group specific component, Gc) in lysophospholipid activation of mouse peritoneal macrophages. J Immunol 1991;147:273-80.
- Lusis AJ. Atherosclerosis. Nature 2000;407:233-41.
- Koh JS, Wang Z, Levine JS. Cytokine dysregulation induced by apoptotic cells is a shared characteristic of murine lupus. J Immunol 2000;165:4190-201.
- Kabarowski JH, Zhu K, Le LQ, Witte ON, Xu Y. Lysophosphati-dylcholine as a ligand for the immunoregulatory receptor G2A. Science 2001;293:702-5.
- Zhu K, Baudhuin LM, Hong G, Williams FS, Cristina KL, Kabarowski JH, et al. Sphingosylphosphorylcholine and lysophosphatidylcholine are ligands for the G protein-coupled receptor GPR4. J Biol Chem 2001;276:41325-35.
- Lin P, Ye RD. The lysophospholipid receptor G2A activates a specific combination of G proteins and promotes apoptosis. J Biol Chem 2003;278:14379-86.
- Schreck R, Rieber P, Baeuerle PA. Reactive oxygen intermediates as apparently widely used messengers in the activation of the NF-kappa B transcription factor and HIV-1. Embo J 1991;10:2247-58.
- Larsson R, Cerutti P. Oxidants induce phosphorylation of ribosomal protein S6. J Biol Chem 1988;263:17452-8.
- Finkel T. Redox-dependent signal transduction. FEBS Lett 2000;476:52-4.
- Lieber MR. Warner-Lambert/Parke-Davis Award Lecture. Pathological and physiological double-strand breaks: roles in cancer, aging, and the immune system. Am J Pathol 1998;153:1323-32.
- Dobmeyer TS, Findhammer S, Dobmeyer JM, Klein SA, Raffel B, Hoelzer D, et al. Ex vivo induction of apoptosis in lymphocytes is mediated by oxidative stress: role for lymphocyte loss in HIV infection. Free Radic Biol Med 1997;22:775-85.
- Dandona P, Thusu K, Cook S, Snyder B, Makowski J, Armstrong D, et al. Oxidative damage to DNA in diabetes mellitus. Lancet 1996;347:444-5.
- McAllister-Sistilli CG, Caggiula AR, Knopf S, Rose CA, Miller AL, Donny EC. The effects of nicotine on the immune system. Psychoneuroendocrinology 1998;23:175-87.
- Frenkel K, Khasak D, Karkoszka J, Shupack J, Stiller M. Enhanced antibody titers to an oxidized DNA base in inflammatory and neoplastic diseases. Exp Dermatol 1992;1:242-7.
- Konikova E, Babusikova O, Kusenda J, Glasova M. Detection of cytoplasmic and surface membrane markers in cells of some human hematopoietic cell lines. Neoplasma 1992;39:337-42.
- Yun MR, Okajima F, Im DS. The action mode of lysophos-phatidylcholine in human monocytes. J Pharmacol Sci 2004;94:45-50.
- Mehta A, Shaha C. Apoptotic death in Leishmania donovani promastigotes in response to respiratory chain inhibition: complex II inhibition results in increased pentamidine cytotoxicity. J Biol Chem 2004;279:11798-813.
- Skulachev VP. Why are mitochondria involved in apoptosis? Permeability transition pores and apoptosis as selective mechanisms to eliminate superoxide-producing mitochondria and cell. FEBS Lett 1996;397:7-10.
- Mignotte B, Vayssiere JL. Mitochondria and apoptosis. Eur J Biochem 1998;252:1-15.
- Legradi A, Chitu V, Szukacsov V, Fajka-Boja R, Szekely Szucs K, Monostori E. Lysophosphatidylcholine is a regulator of tyrosine kinase activity and intracellular Ca(2+) level in Jurkat T cell line. Immunol Lett 2004;91:17-21.
- Yamakawa T, Tanaka S, Yamakawa Y, Kamei J, Numaguchi K, Motley ED, et al. Lysophosphatidylcholine activates extracellular signal-regulated kinases 1/2 through reactive oxygen species in rat vascular smooth muscle cells. Arterioscler Thromb Vasc Biol 2002;22:752-8.
- Heinloth A, Heermeier K, Raff U, Wanner C, Galle J. Stimulation of NADPH oxidase by oxidized low-density lipoprotein induces proliferation of human vascular endothelial cells. J Am Soc Nephrol 2000;11:1819-25.
- Pagano PJ, Ito Y, Tornheim K, Gallop PM, Tauber AI, Cohen RA. An NADPH oxidase superoxide-generating system in the rabbit aorta. Am J Physiol 1995;268:H2274-80.
- Griendling KK, Sorescu D, Ushio-Fukai M. NAD(P)H oxidase: role in cardiovascular biology and disease. Circ Res 2000;86:494-501.
- Kroemer G, Petit P, Zamzami N, Vayssiere JL, Mignotte B. The biochemistry of programmed cell death. Faseb J 1995;9:1277-87.
- Martinou JC. Apoptosis. Key to the mitochondrial gate. Nature 1999;399:411-2.
- Jeon ES, Kang YJ, Song HY, Im DS, Kim HS, Ryu SH, et al. Sphingosylphosphorylcholine generates reactive oxygen species through calcium-, protein kinase Cdelta- and phospholipase D-dependent pathways. Cell Signal 2005;17:777-87.
- Weng Z, Fluckiger AC, Nisitani S, Wahl MI, Le LQ, Hunter CA, et al. A DNA damage and stress inducible G protein-coupled receptor blocks cells in G2/M. Proc Natl Acad Sci USA 1998;95:12334-9.