
Induction of liver cytochrome P450 1A2 expression by flutamide in rats1
Introduction
Flutamide, 3'-trifluoromethyl-4'-nitro-2-methylpropinoyl-anilide, is a nonsteroidal antiandrogen[1,2] devoid of other hormonal activity and is recognized worldwide as the most beneficial drug for the treatment of patients with advanced prostate cancer[3–5] when used in combination with various luteinizing hormone-releasing factor agonists. This antian-drogen is also used in combination with oral contraceptives for the treatment of hirsutism[6] and benign prostatic hyperplasia[7,8].
However, flutamide therapy is associated with hepatitis in a few subjects. The incidence of liver toxicity (as defined by an increase in serum transaminase activity of fourfold greater than upper normal limits) was found to be 0.36% in 1091 consecutively treated prostate cancer patients[9–11]. Flutamide-induced hepatitis was decreased using piperonyl butoxide [cytochrome P450 (CYP450) inhibitor] and increased using β-naphthoflavone (CYP450 1A inducer)[12].
Previous results show that CYP1A2 is involved in flutamide bioactivation[12,13]. CYP1A2 is a cytochrome P-450 enzyme constitutively expressed in the liver, which catalyzes the metabolism of many drugs, such as caffeine, phenacetin, and propranolol[14]. The enzyme also participates in the metabolic activation of chemical mutagens in cooked food such as 2-amino-3-methylimidazo[4,5-f]quinoline and 2-amino-3,8-dimethylimidazo[4,5-f]quinoxaline and 2-amino-1-methyl-6-phenylimidazo[4,5-b]pyridine[15]. Previous studies have reported flutamide bioactivation using the P450 enzyme system generated a nitro anion free radical after treatment[16]. These radicals can bind covalently to proteins and lipids, or remove hydrogen atoms from polyunsaturated fatty acids in lipids, thereby initiating lipid peroxidation and liver cell injury[17]. Therefore, CYP1A2 increase might be a risk factor for flutamide-associated hepatotoxicity or carcinogenicity. In the present study, we investigate the modulation of CYP1A2 expression in adult male rats given flutamide for 2 weeks.
Materials and methods
Chemicals Flutamide was provided by the Shanghai Hongqi Pharmaceutics Factory. Trizol reagent was obtained from Life Technologies and reverse transcription-polymerase chain reaction kits were obtained from Sangon Biological Technique. Caffeine and its metabolite, and β-hydroxyethyl-theophyline (HT) were obtained from Sigma Chemical Company. Rabbit anti-rat CYP1A2 monoclonal antibody was obtained from Santa Cruz Biotechnology (kindly provided by Dr XC MA).
Animals and treatment Adult male Sprague-Dawley rats weighing between 200 g and 250 g (Experimental Animal Center of Fudan University, grade II, certification N
RNA extraction and cDNA synthesis Total RNA was obtained from frozen rat livers (0.5 g–1 g) using Trizol reagent. The RNA concentration was determined spectroscopically at 260 nm, and 5 µg of total RNA was taken for reverse transcription. Random primer (300 ng) was added and primer annealing was performed using incubation for 10 min at 65 °C and 10-min progressive cooling on ice. Deoxynucleotides (dNTP) (4 mmol/L each), 5 µL of 10×reaction buffer, 50 U of block ribonuclease inhibitor, and 200 U of SuperScript II RNase reverse transcriptase were added to a final volume of 50 µL, and samples were incubated at 42 °C for 30 min. The reaction was stopped by heating to 90 °C for 5 min. Control samples contained distilled water instead of RNA. The synthesized cDNA was stored at -20 °C until use.
Polymerase chain reaction Reverse transcription sample of 2.5 mL was added to the corresponding polymerase chain reaction mixture containing 0.5 µmol/L sense and antisense primer, 2 mmol/L MgCL2, 10 mmol/L Tris-HCl (pH 9), 50 mmol/L KCl, 0.1% Triton X-100, and 80 µmol/L dNTP. After heating at 95 °C for 5 min and cooling to the primer-annealing temperature for 5 min (60 °C), 2 U of Taq DNA polymerase was added. The following primers were used: CYP1A2 forward (+127 to +147), 5'-GGACCCTGGGGCTTGCCCTTC-3'; reverse (+484 to +504), 5'-AGCCTCTTTGCTCACGTGCTC-3'; β-actin forward (+59 to +69), 5'-CCCAAGTCGCCTCC-GTCCCGC-3'; reverse (+894 to +914), 5´-CCCTCCAGGAGCCCCATGAGC-3'. The specificity of CYP1A2 primers was confirmed through alignment with the CYP subfamily DNAs. Amplification conditions for all primer pairs were used as follows: 94 °C 30 s, 60 °C 30 s, and 72 °C 30 s for 30 cycles. β-actin segment was amplified separately and used as an external standard, because interaction of primer pairs caused a decrease in signal intensity. A total 12 µL of each preparation was subjected to agarose gel electrophoresis in the presence of ethidium bromide. The gel was photographed using Polaroid 665 film and the intensity of each band was quantified using the software provided with the ABI 7700 system. Each assay was performed in triplicate. Results were expressed as a ratio of the optical intensity of the CYP1A2 to that of the β-actin. This approach allows for the semiquantitation of the expression of the CYP1A2 gene.
Immunoblot analysis Liver microsomes were prepared as described by Kamataki and Kitagawa[18]. The protein concentration was determined using Bradford’s method[19], using a protein assay with bovine serum albumin as a standard. Three micrograms of microsomal protein were resolved separately by electrophoresis on 10% SDS-polyacrylamide gel and then transferred onto a nitrocellulose membrane. The membrane was incubated with a rabbit anti-rat CYP1A2 monoclonal antibody, and further incubated with goat anti-rabbit secondary antibody conjugated with horseradish peroxidase, followed by detection with 3,3'-diaminobenzidine and hydrogen peroxide. The membrane was scanned with an image scanner, and the signal intensity was quantified using the software provided with the ABI 7700 system. In the present study, the levels of CYP1A2 proteins were in the linear range for densitometric readings.
CYP1A2 activity Caffeine was used as a probe for CYP1A2 activity and plasma caffeine (137X) and its metabolite (17X) were assayed using high performance liquid chromatography[20]. After the last dose of flutamide and overnight fast, each rat received 20 mg/kg (ip) of caffeine. Blood samples (2 mL) were drawn after caffeine administration. Plasma was separated and frozen at -20°C for later analysis. The mixtures of plasma containing 17X and 137X was extracted with chloroform/isopropanol (9:1). The residue remaining after evaporation was dissolved in 0.1 mL elution and 20 µL was injected into the chromatographic system. HT was chosen as an internal standard (IS). All components were separated isocratically on a reversed-phase column using 0.05% acetic acid:acetonitrile:methanol (82:8:10) as a mobile phase at a flow rate of 1 mL/min. Ultraviolet detection wavelength was 282 nm. The retention times for 17X, 137X, and IS were 4.50 min, 5.03 min, and 8.13 min, respec-tively. The CYP1A2 activity was expressed as a ratio of the concentration of 17X to that of 137X observed 6 h after giving caffeine.
Statistical analysis The statistical significance of the difference between the means of the two groups was assessed using the independent t test (
Results
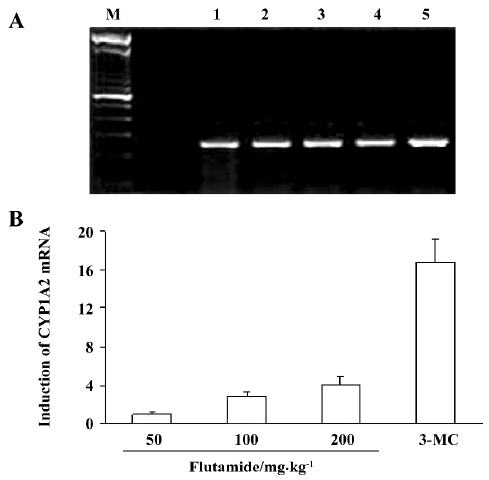
CYP1A2 mRNA levels The levels of CYP1A2 mRNA were normalized using a comparison with β-actin, constitutively expressed in the rat liver. The increase in CYP1A2 mRNA was expressed as a percentage of the control. After flutamide treatment (50 mg/kg) of rats for 14 d, liver CYP1A2 mRNA levels were similar to control levels, but CYP1A2 mRNA levels were increased 1.86 and 3.11-fold relative to controls in rats in flutamide 100 mg/kg and 200 mg/kg group, respectively. CYP1A2 mRNA levels were increased 15.6-fold by 3-MC treatment (Figure 1).
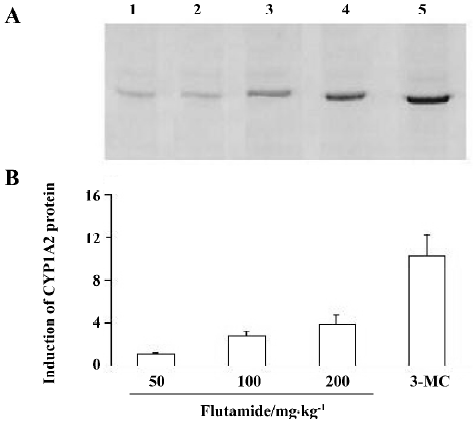
CYP1A2 protein Similar results were obtained for the analysis of the P450 protein. After 50 mg/kg flutamide treatment, CYP1A2 protein in rat liver microsomes was similar to that in the control group. However, CYP1A2 protein levels increased 1.78 and 2.89-fold respectively, after 100mg/kg and 200 mg/kg flutamide treatment as compared to those in controls. In contrast, 3-MC treatment increased the CYP1A2 protein content 13.8-fold (Figure 2).
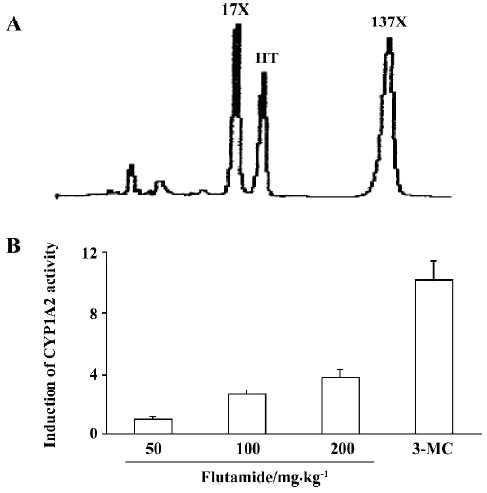
CYP1A2 enzyme activity Caffeine is hydroxylated to form paraxanthine (17X) using CYP1A2. Concentration ratio of caffeine metabolite paraxanthine to caffeine (17X/137X) was used to express the activity of CYP1A2. After giving caffeine for 6 h, CYP1A2 activity in rats treated with flutamide (50 mg/kg) was similar to that in the control group. In rats given 100 mg/kg and 200 mg/kg of flutamide, CYP1A2 enzyme activity increased 1.65 and 2.83-fold, respectively, as compared to that in the control group. 3-MC increased CYP1A2 activity 8.50-fold more than those in the control group (Figure 3).
Discussion
In the present study, CYP1A2 mRNA, protein, and enzyme activity were induced by flutamide treatment in rats. It is reasonable to speculate that flutamide is a CYP1A2 inducer in rats. This P450 induction is dose-dependent as it increases with increasing amounts of flutamide in the liver. The magnitude of CYP1A2 induction assessed using three different parameters, that is, mRNA, protein, and enzyme activity, was found to be comparable. The differences between the mRNA and protein induction and between protein and enzyme activity in rats were less than 2-fold; therefore, it is highly probable that the CYP1A2 induction occurs mainly at a pretranslational level, and we speculate that flutamide-mediated CYP1A2 induction is a result of increased rate of transcription.
CYP1A2 is one of the major constitutively expressed P-450 in the liver tissue. It catalyzes steroid hydroxylations, such as 17β-estradiol 2-hydroxylation[21,22]. Of considerable interest is the ability of P4501A2 to catalyze the N-hydroxylation of carcinogenic aryl amines and heterocyclic amines[23–25]. The oxidized products can modify DNA, either directly or following conjugation with acryl or sulfate groups[26,27]. The heterocyclic amines are of considerable interest in that they are found in charbroiled food and cigarette smoke. There is some epidemiological evidence that elevated levels of CYP1A2 can be a predisposing factor to colon cancer, although the risk is marginal unless high levels of N-acetyl-transferase are present along with high charbroiled meat consumption.
Flutamide can be metabolized by CYP1A2 to form the reactive metabolites. Nitro radical and one-electron reduction products have toxic effects on the liver cells[16]. Induction of CYP1A2 can increase the formation of toxic metabo-lites, and increase the incidence of liver toxicity. This might explain why flutamide had no significant liver toxicity after low doses (50 mg/kg), although it caused liver toxicity at higher doses (100 mg/kg and 200 mg/kg) in previous studies[28]. Therefore, the induction of CYP1A2 might have a large influence on the therapeutic efficacy and liver toxicity associated with flutamide treatment. Induction of CYP1A2 using flutamide treatment and its possible effects on the metabolism of other drugs and the carcinogenesis of heterocyclic amines in human beings would be useful topics of further study.
Acknowledgments
We thank Yi WANG for kindly supplying β-actin primer. The supports from PhD Xin WU and Hong-Xin ZHU from our university are also acknowledged.
References
- Neri RO, Florance K, Koziol P. A biological profile of a nonsteroidal antiandrogen, SCH13521(4'-nitro-3'trifluoromethyliso-butyranilide). Endocrinology 1972;91:427-37.
- Neri RO, Monahan M. Effects of novel nonsteroidal antiandrogen on canine prostatic hyperplasia. Invest Urol 1972;10:123-30.
- Labrie F, Dupont A, Cusan L, Manhes G, Bergeron N, Lacourciere Y. Combination therapy with castration and flutamide: today’s treatment of choice for prostate cancer. J Steroid Biochem 1989;33:817-21.
- Chen DH, Kaung HL, Miller CM, Resnick MI, Marengo SR. Microarray analysis of changes in renal phenotype in the ethylene glycol rat model of urolithiasis: potential and pitfalls. BJU Int 2004;93:637-50.
- Pitts WR Jr. The use of flutamide as a single antiandrogen treatment for hormone-refractory prostate cancer. BJU Int 2004;93:1119-20.
- Andrade RJ, Lucena MI, Fernandez MC, Suarez F, Montero JL, Fraga E. Fulminant liver failure associated with flutamide therapy for hirsutism. Lancet 1999;353:983-6.
- Caine M, Perlberg S, Gordon R. The treatment of benign prostatic hypertrophy with flutamide: a placebo controlled study. J Urol 1975;114:564-6.
- Bonard M, Almeida S. Placebo-controlled double-blind study in human benign obstructive prostatic hypertrophy with flutamide. Eur Urol 1975;2:24-8.
- Lubbert C, Wiese M, Haupt R, Ruf BR. Toxic hepatitis and liver failure under therapy with flutamide. Internist (Berl) 2004;45:333-40.
- Ometz JL, Dupont A, Cusan L, Tremblay M, Suburu R, Lrmay M. Incidence of liver toxicity associated with the use of flutamide in prostate cancer patients. Am J Med 1992;92:465-70.
- Anjumath S, Michael M, Charles W. Metabolism of the antiandrogenic drugs (flutamide) by human CYP1A2. Drug Metab Dispos 1997;25:1298-304.
- Wang HX, Li D, Xu CJ, Liu X. Flutamide-associated acute liver failure. Ann Ital Med Int 2003;18:250-3.
- Aizawa Y, Ikemoto I, Kishimoto K. Flutamide-induced hepatic dysfunction in relation to steady-state plasma concentrations of flutamide and its metabolites. Mol Cell Biochem 2003;252:149-56.
- Gonzales FJ, Liu SY, Yano M. Regulation of cytochrome P450 genes: molecular mechanism. Pharmacogenetics 1993;3:51-7.
- Boobis AR, Gooderham NJ, Rich KJ, Zhao K, Edwards RJ, Murray BP, et al. Enzymatic studies of the activation of heterocyclic food mutagens in man. Princess Takamatsu Symp 1995;23:134-44.
- Vazquez RM, Gil GL, Lopez SP, Aleman VS, Garcia PA. Liver toxicity associated with flutamide. An Med Intern 2004;21:307-8.
- Williams AT, Burke RF. Carbon tetrachloride hepatotoxicity: an example of free radical-mediated injury. Semin Liver Dis 2000;10:279-84.
- Kamataki T, Kitagawa H. Effects of lyophilization and storage of rat liver microsomes on activity of aniline hydroxylase, contents of cytochrome b5 and cytochrome P-450 and aniline-induced P-450 difference spectrum. Jpn J Pharmacol 1974;24:195-203.
- Bradford MM. A rapid and sensitive method for the quantitation of microgram quantities of protein utilizing the principle of protein-dye binding. Anal Biochem 1976;72:248-54.
- Casler WL, Menzies JA, Whitehouse LW, Moon TW. Detection of quantitative trait loci affecting caffeine metabolism by interval mapping in a genome-wide scan of C3H/HEJ×APNF2 mice. Drug Metab Dispos 1999;27:1375-80.
- Sandhu P, Guo Z, Baba T, Martin MV, Turkey RH, Guengerich FP. Expression of modified human cytochrome P450 1A2 in Escherichia coli stabilization, purification, characterization, and catalytic activities of the enzyme. Arch Biochem Biophys 1994;309:168-77.
- Zacharova LY, Gulyaeva LF, Lyakhovich VV. Rat hepatic CYP1A1 and CYP1A2 induction by menadione. Toxicol Lett 2005;155:253-8.
- McManus ME, Burgess WE, Weronese ME, Huggett A, Quattrochi LC, Tukey RH. Metabolism of 2-acetylaminofluorene and benzopyrene and activation of food-derived heterocyclic amine mutagens by human cytochromes P-450. Cancer Res 1990;50:3367-76.
- Toyoshiba H, Walker NJ, Bailer AJ, Portier CJ. Evaluation of toxic equivalency factors for induction of cytochromes P450 CYP1A1 and CYP1A2 enzyme activity by dioxin-like compounds. Toxicol Appl Pharmacol 2004;194:156-68.
- Butler MA, Iwasaki M, Guengerich FP, Kadlubar FF. Human cytochrome P450, the phenacetin O-deethylase, is primarily responsible for the hepatic 3-demethylation of caffeine and N-oxidation of carcinogenic arylamines. Proc Natl Acad Sci USA 1989;86:7696-700.
- Kadlubar PF, Hammons GK. The role of cytochrome P-450 in the metabolism of chemical carcinogens, in mammalian cytochromes P-450. Boca Raton (FL): CRC Press; 1987.
- Walubo A, Barr S, Abraham AM, Coetsee C. The role of cytochrome-P450 inhibitors in the prevention of hepatotoxicity after paracetamol overdose in rats. Hum Exp Toxicol 2004;23:49-54.
- Wang HX, Xu CJ, Li D. Influence of flutamide on liver biotransformation enzymes and antioxidation in rats. J Fudan Univ 2001;28:299-302. (Med Sci).