
MI-QSAR models for prediction of corneal permeability of organic compounds1
Introduction
Most ocular diseases are treated by drugs that are applied to the eye to achieve a localized action on the surface or in the interior of the eye[1]. However, typically less than 5% of the applied drug reaches the intraocular tissues. There are 2 main ways to improve the ocular absorption of ophthalmic drugs: increasing corneal permeability and prolonging the contact time on the ocular surface. Because a major part (50%–100%) of the instilled dose is absorbed systemically and may cause systemic side effects, it seems that a more effective way to improve the bioavailability of ophthalmic drugs is to increase their corneal permeability.
The main route for intraocular drug absorption is across the cornea[2]. The corneal barrier we discussed in the present article is composed of epithelium, stroma, and endothelium[3]. Usually, the corneal epithelium is the main barrier for drug penetration into the eye[4]. Intercellular tight junctions (zonula occludens), which completely surround the most superficial cells, serve as a selective barrier for small molecules and fully prevent the diffusion of macromolecules via the paracellular route. Compared with epithelium, which is mainly composed of lipids, stroma is a highly hydrophilic tissue containing mostly water. The major cellular components of the corneal stroma are the corneal fibroblasts (keratocytes) that occupy 2%–3% of the total volume of corneal stroma. Because of the relatively open structure, drugs with a molecular size of up to 500 000 can diffuse in normal stroma[5]. Only for the most lipophilic drugs does the hydrophilic stroma represent the rate-limiting barrier to corneal penetration. This is because of the slow partitioning of lipophilic compounds from the lipophilic epithelium to the hydrophilic stroma[6]. The corneal endothelium is a single layer of hexagonal cells that maintains normal corneal hydration. It has been estimated that drugs with molecular sizes up to approximately 20 nm can permeate normal endothelium[7].
As mentioned earlier, the corneal permeability of ophthalmic drugs is mainly determined by the epithelium. There are 2 ways for drugs to penetrate across epithelium: for lipophilic drugs, penetration primarily occurs via the transcellular route, and for hydrophilic drugs, it occurs via the paracellular route that involves passive or altered diffusion through intercellular spaces[8]. Physicochemical drug properties, such as lipophilicity[9], molecular size[10], charge[11], solubility[12], degree of ionization[12,13], and pH[14], affect the route and rate of corneal permeability. For highly hydrophilic drugs, the rate-limiting barrier is the lipoidal corneal epithelium, whereas for highly lipophilic drugs, partitioning from the epithelium to the hydrophilic stroma is rate-limiting and, in most cases, determines the corneal permeability[15].
To research corneal permeability, we need to determine the permeability coefficient. For measuring permeability coefficients in vitro, an isolated rabbit cornea mounted in a perfusion chamber is usually used, which maintains its viability and integrity during the experiment[16]. This method is very time consuming and expensive. Therefore it seems necessary to construct theoretical models of the corneal permeability of drug candidates on the basis of their physicochemical properties and other structural parameters. Since the 1970s, several congeneric quantitative structure-activity relationships (QSAR) models have been reported for, amongst others, β-blocking agents[10] (r=0.9756) and steroids[17]. These models are functions of the partition coefficient (log P) or the distribution coefficient (log D, for an ionizable compound) of the drug[9,17]. However, Grass and Robinson pointed out that some steroids did not fit the parabolic curve established for β-blockers[18]. Yoshida and Topliss tried to develop a non-congeneric model on the basis of former research results[19]; they used the difference between the octanol-water partition coefficient and the alkanewater partition coefficient (Δlog P) and the distribution coefficient (log D) as predictors, and obtained a preferable noncongeneric model (R=0.950, S=0.221) that unified β-blockers and steroids. Furthermore, they then introduced a further 9 structurally different compounds, including methanol, into the model, using the same method, and also obtained a good result (R=0.917, S=0.282). However, Δlog P values are usually difficult to obtain. Therefore, Fu and Liang attempted to predict the corneal permeabilities of miscellaneous compounds from simpler parameters[20]. They primarily considered charge parameters and solid parameters and constructed a better model (R=0.921, S=0.233), which included β-blockers, steroids and other structurally different compounds. Moving on from traditional QSAR, Iyer et al developed a methodology called membrane-interaction (MI)-QSAR analysis, which combines a structure-based design methodology with classic intramolecular QSAR analysis to model the interactions of different compounds with cellular membranes[21]. They successfully constructed MI-QSAR models predicting the blood-brain barrier penetration of organic compounds.
In the present article, we focused on constructing predictive models of corneal permeability for miscellaneous organic compounds on the basis of MI-QSAR analysis.
Materials and methods
Corneal permeability coefficient The dependent variable used in this theoretical model is the logarithm of the corneal permeability coefficient (P), log P. In vitro P (per cm) is calculated using the equation below:
where ΔC/Δt is the change in concentration in dpm/mL of sample per unit time, and 7 is the volume of the sampling chamber in mL. Therefore, the quantity 7ΔC/Δt is the steady-state flux in dpm/h. A is the surface area of the cornea (taken to be 1.087 cm2), and C0 is the initial concentration of the diffusing drug.
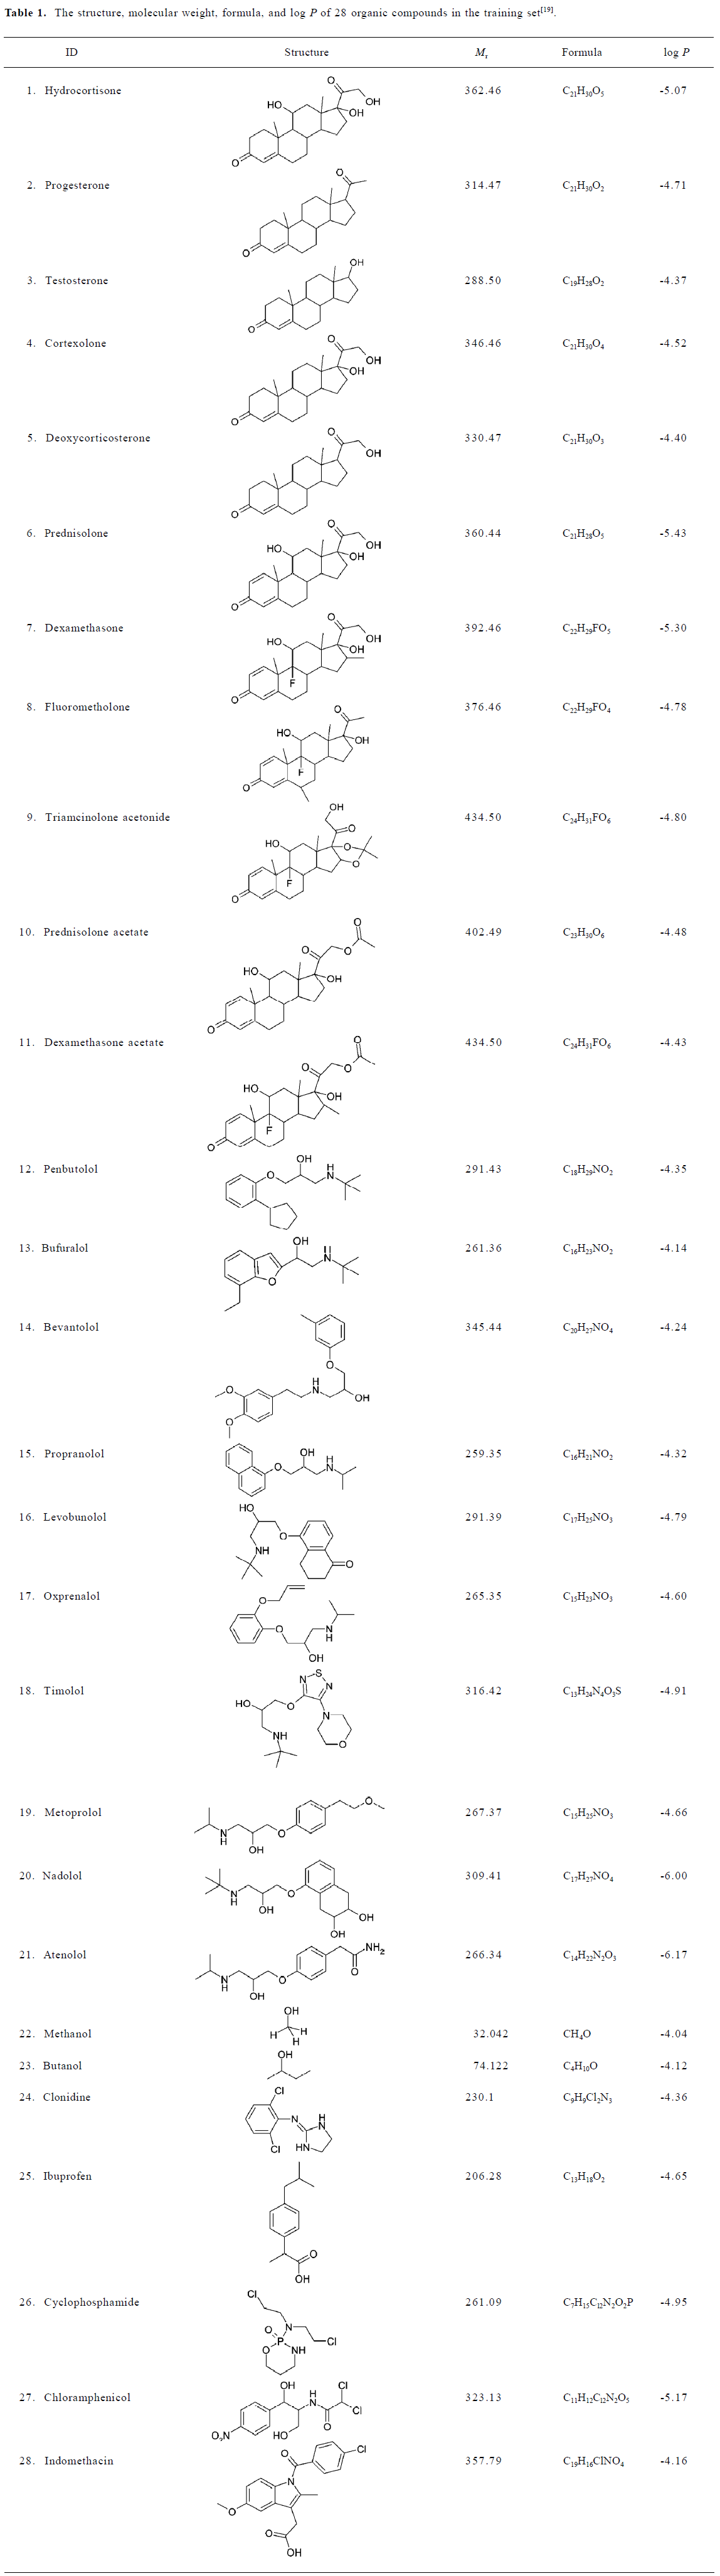
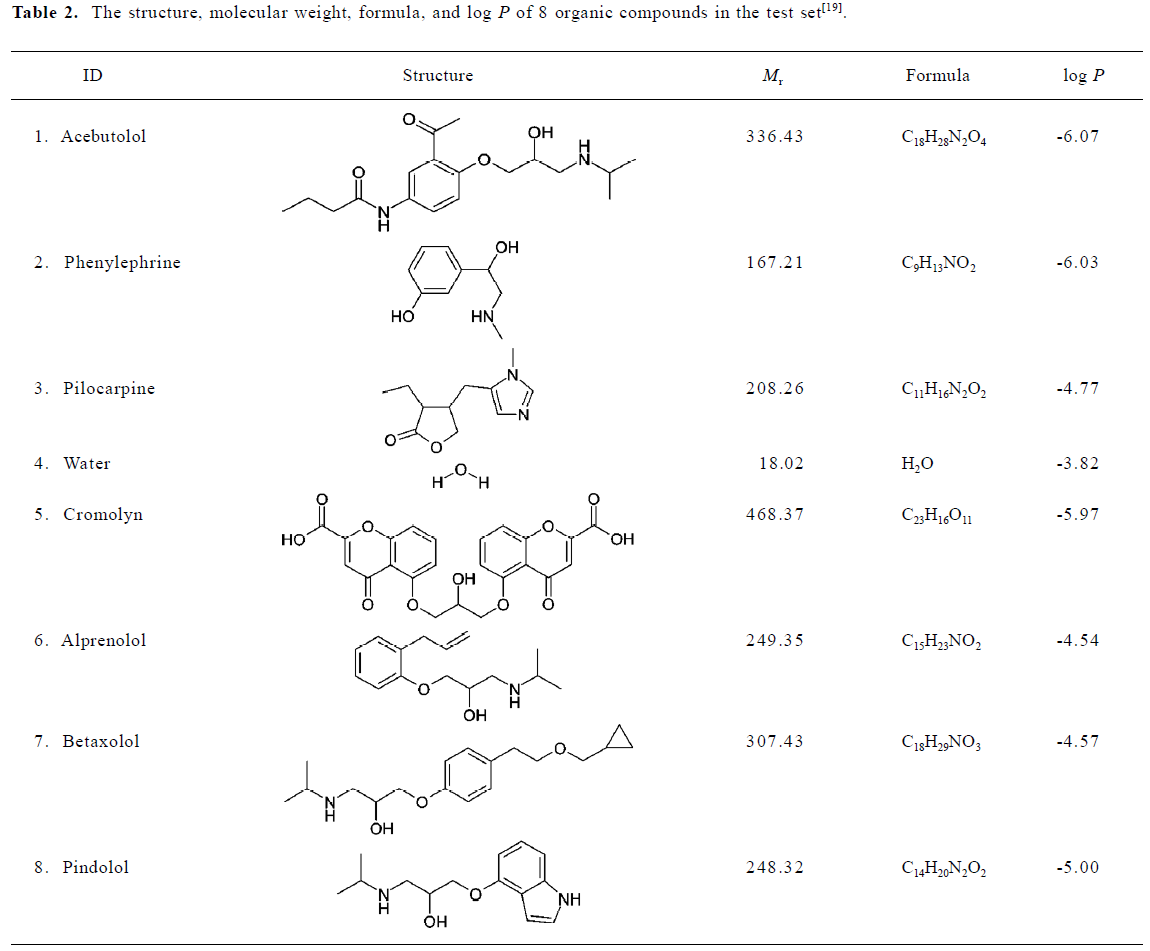
Building solute molecules and a DMPC monolayer A training set of 28 organic compounds[19] (Table 1) and a test set of 8 organic compounds[19] (Table 2) were chosen. These compounds had a range of molecular weights, from 18.02 to 468.37. Experimental values of log P published to date cover a range between -6.17 and -3.82. All these compounds were built on a personal computer using the Build module of the commercial software package Hyperchem 7.5 (release 7.5 for Windows; Hypercube, Waterloo, Ontario, Canada). First, the geometry of these compounds was optimized by using the Amber 94 force field in gas state. Second, they were placed in a periodic solvent box whose volume was X=12 Å, Y=10 Å, Z=24 Å, which included 96 water molecules. The temperature was 298 K and the pressure was 101.325 kPa. Then, the compounds in water were minimized by using the method described earlier. The compounds in water were simulated by using the Monte Carlo method at 300 K, and minimized by using the method described earlier. The Monte Carlo method, which samples from the random conformations generated by the Boltzmann distribution under a certain temperature, simulates the molecular movement and kinetic properties of the equilibrium state. It uses a logarithm to calculate a conformation based on the previous one, and obtains a continuous conformation sequence that forms a trace in image space. Dynamic simulation uses dynamic equations to generate new conformations, whereas the Monte Carlo method uses a statistical sampling technique to produce the trace of the image space. That is to say, dynamic simulation calculates average value according to time, whereas the Monte Carlo method computes the statistical mean value from averaging each conformation. If the primary parameter is appropriate, both the Monte Carlo and the dynamic method can reach equilibrium. However, the Monte Carlo method is usually faster. Here, we used a Monte Carlo simulation to gain the steady-state conformation of the solute in the solvent[22].
Full table
Full table
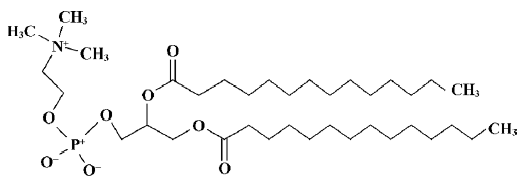
The phospholipid dimyristoylphosphatidylcholine (DMPC) was selected as the model phospholipid in the present study. A single DMPC (Figure 1) molecule was built using Hyperchem 7.5 from the available crystal structure data[23]. A model of the DMPC membrane monolayer was constructed by using the software Material Studio (version 2.2.1; Accelrys, San Diego, CA, USA). According to the work done by van der Ploeg and Berendsen, the DMPC monolayer is composed of 25 DMPC molecules (5×5×1)[24]. The unit cell parameters used for building the DMPC monolayer were a=8 Å, b=8 Å, c=32 Å, and γ=96.0 º, which yield an average surface area per phospholipid of 64 Å2, similar to the value found by Stouch experimentally[25]. Therefore, we can consider the DMPC membrane monolayer model to be reasonable.
Molecular dynamic simulation To prevent unfavorable van der Waals interactions between a solute molecule and the membrane DMPC molecules, one of the “center” DMPC molecules was removed from the DMPC model described and an organic compound (solute) was inserted in the space created by the missing DMPC molecule to form a solute-membrane complex. The solute was inserted at 3 different positions in the DMPC model and 3 corresponding molecular dynamic simulation (MDS) models were generated for each compound. The 3 different positions (depths) were: (1) solute molecule in the head group region; (2) solute molecule between the head-group region and the aliphatic chains; and (3) solute molecule in the tail region of the aliphatic chains. MDS of the complex was performed by using the Discover module of Material Studio, using a compass force field. A simulation temperature of 311 K was selected and 2-dimensional periodic boundary conditions corresponding to the “surface plane” of the monolayer were used (a=32 Å, b=32 Å, c=80 Å, and γ=96.0°) for the DMPC model. In order to equilibrate the solute-membrane complex gradually and fully, the MDS course was carried out with 3 phases: (1) simulation at 120 K for 1500 steps (1.5 ps); (2) simulation at 220 K for 1500 steps (1.5 ps); and (3) simulation at 311 K for 10 000 steps (10 ps).
Calculation of descriptors Most of the intramolecular solute descriptors were calculated by using the commercial software package CS Chem3D Ultra 7.0 (Chemoffice 2002; Cambridgesoft, Cambridge, MA, USA), which included molecular mechanism (MM) parameters (such as bending energy, torsion energy and van der Waals energy), quantum chemistry parameters (such as electronic energy, HOMO, and LUMO energy), hydrophobic parameters (such as Clog P), and stereo parameters (such as Es and Balaban index). The data of QO,N and QH comes from Fu and Liang’s study[20].
The intermolecular solute-membrane interaction descriptors were extracted directly from the MDS trajectories in which the solute-membrane complex had the lowest energy geometry. These descriptors were mainly energy parameters. The total energy of a system can be expressed as follows[21]:
Etotal=Evalence+Ecrossterm+Enonbond
Construction and testing of MI-QSAR models MI-QSAR models of permeation of the cornea by organic compounds were constructed by using the partial sum of squares for regression using the SPSS software package (Chicago,USA). A training set of 28 structurally diverse compounds whose corneal permeability coefficients have been measured in vivo was used to construct the MI-QSAR models. Molecular dynamics simulations were used to determine the explicit interaction of each test compound with the DMPC model. An additional set of intramolecular solute descriptors were computed and considered in the trial pool of descriptors for building MI-QSAR models. The MI-QSAR models were optimized by using multidimensional linear regression fitting and a stepwise method. A test set of 8 compounds was evaluated by using the MI-QSAR models as part of a validation process. A principal components analysis (PCA) was performed by using SPSS to identify the principal components of the constructed models.
Application package for models A forecasting application package of the constructed models was built using the MFC module of the commercial software packages Microsoft Visual C++ (version 6.0; Microsoft Corporation, USA).
Results
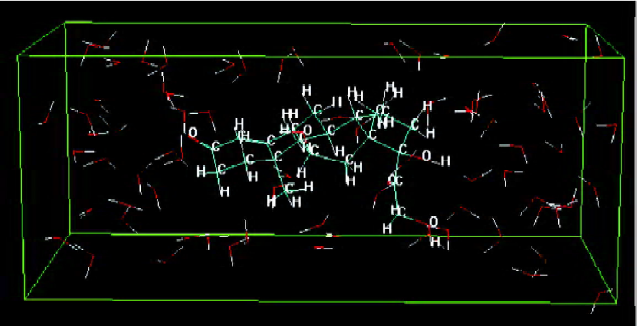
Construction of solute molecules and a DMPC monolayer Figure 2 shows the dominant conformation of compound No 1 labeled by atom-type in water. The box denotes the water solvent box defined in the Monte Carlo simulation.
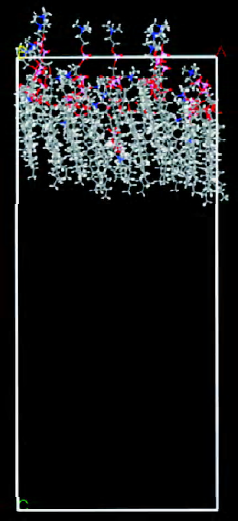
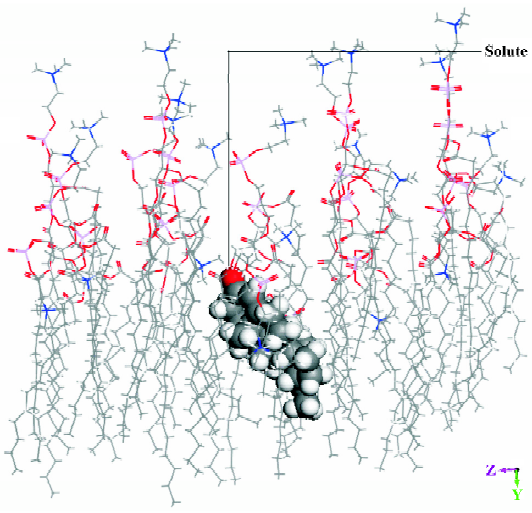
Molecular dynamic simulation The energy of a solute inserted in the middle position of the DMPC model was lower than that of a solute inserted in the other 2 positions. Figure 3 shows the dominant conformation of a solute-membrane complex in the MDS. The DMPC molecules appear as white sticks. The molecule depicted using spheres represents an organic compound. The white box indicates the border of the volume. Figure 4 is a “side” view of the molecule in Figure 3.
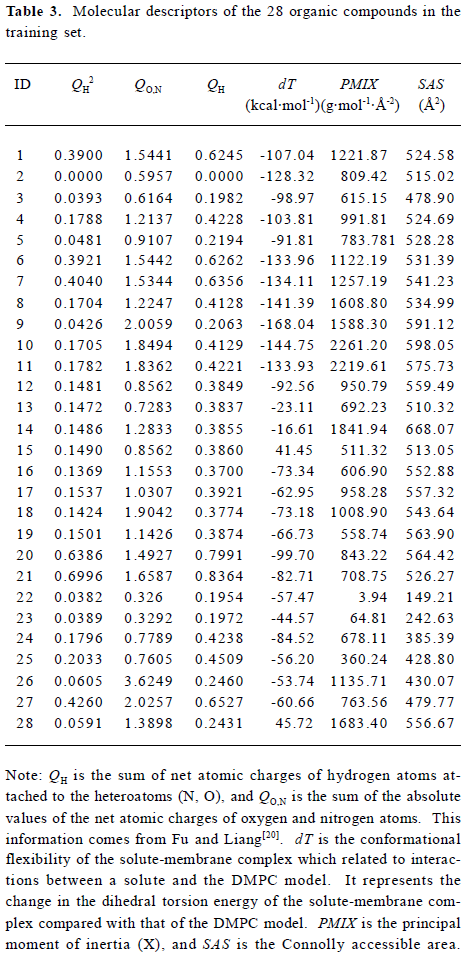
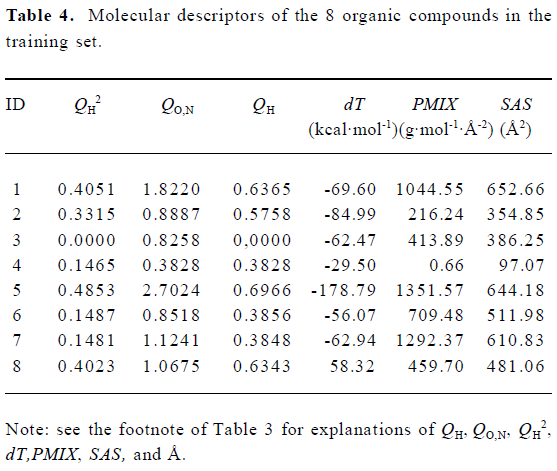
Construction and testing of MI-QSAR models MI-QSAR analysis was used to develop predictive models of corneal permeability of some organic compounds and simulate the interaction of a solute with the phospholipid-rich regions of cellular membranes. Molecular descriptors of 28 compounds in the training set and 8 compounds in the test set are listed in Table 3 and Table 4, respectively. Six MI-QSAR equations were constructed based on the information in Table 3:
Full table
Full table
log P=4.201−2.585 QH2
n=28 R=0.860 S=0.2750 R2=0.730 F=74.071 (1)
log P=3.972−2.388 QH2−0.207 QO,N
n=28 R=0.897 S=0.2433 R2=0.789 F=51.407 (2)
log P=4.488−5.230 QH2−0.236 QO,N+2.768 QH
n=28 R=0.939 S=0.193 1 R2=0.867 F=59.628 (3)
log P=4.354−4.925 QH2−0.216 QO,N+2.533 QH+1.576×10⁻³ dT
n=28 R=0.950 S=0.1785 R2=0.886 F=53.656 (4)
log P=4.324−4.396 QH2−0.288 QO,N+2.106 QH+2.163×10⁻³ dT+1.795×10⁻⁴ PMIX
n=28 R=0.962 S=0.1605 R2=0.908 F=54.355 (5)
log P=3.885−4.290 QH2−0.304QO,N+2.171QH+2.366×10⁻³ dT+3.453×10⁻⁴ PMIX−1.22×10⁻³ SAS
n=28 R=0.976 S=0.1301 R2=0.940 F=70.957 (6)
where QH is the sum of net atomic charges of hydrogen atoms attached to the heteroatoms (N, O), QO,N is the sum of the absolute values of the net atomic charges of oxygen and nitrogen atoms, dT is the conformational flexibility of the solute-membrane complex, PMIX is the principal moment of inertia (X), and SAS is the Connolly accessible area. PMIX and SAS are intramolecular solute descriptors that came from the CS calculation. dT is related to interactions between a solute and the DMPC model. It represents the change in the dihedral torsion energy of the solute-membrane complex, compared with that of the DMPC model, that is, ΔEtorsion. Here, n is the number of organic compounds, R is the correlation coefficient, S is the standard deviation and F is the F-statistic.
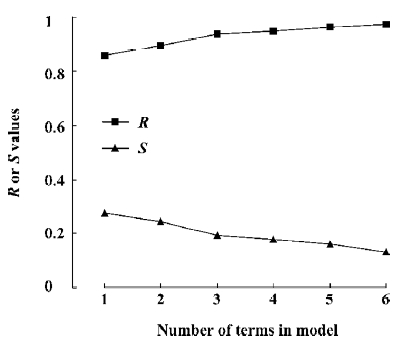
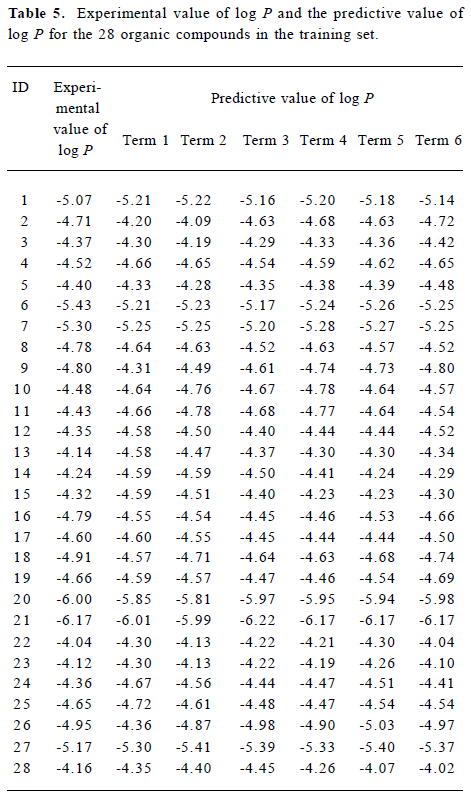
Figure 5 is a diagnostic plot of the MI-QSAR models: R is the correlation coefficient and S is the standard deviation of the best x-term model, where x is plotted on the X-axis for the 28 compounds of the training set. From this plot we can see that with the increase of the variable from 1 to 6, the relativity of MI-QSAR equations is also improved, and the predictive ability of the models is enhanced. The observed and predicted log P values of the training set are listed in Table 5.
Full table
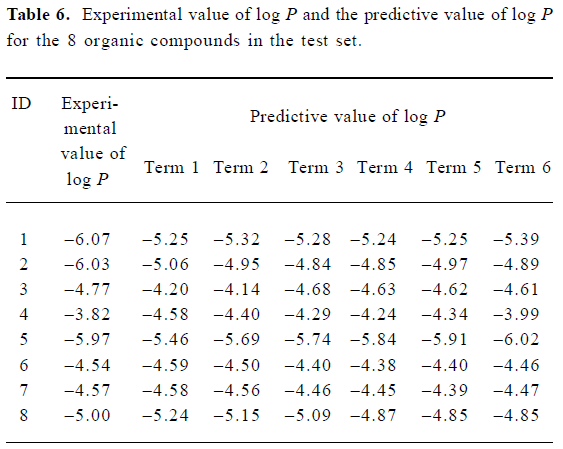
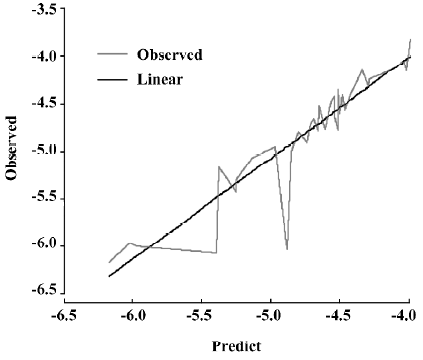
A test set of 8 organic compounds was constructed as one way to attempt to validate the MI-QSAR models given by the 6 equations mentioned. The compounds of the test set were selected from different groups of ophthalmic drugs. The observed and predicted log P values for this test set are given in Table 6. Figure 6 gives the linear relationship between the experimental log P values (shown as the abscissa Predict) and the corresponding predicted log P as predicted by the 6-term MI-QSAR model (shown as the ordinate Observed) for all the molecules in the training set and the test set.
Full table
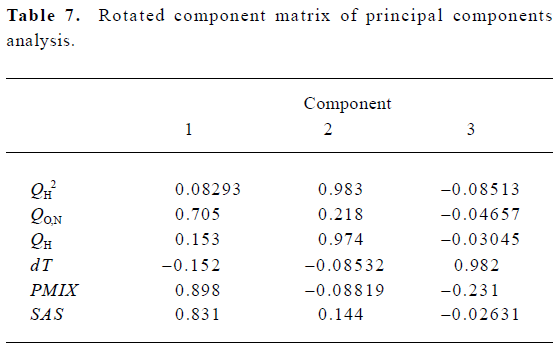
According to the result of the PCA, which has a Kaiser-Meyer-Olkin (KMO) measure of sampling adequacy value of 0.543 and a Bartlett value of 94.955 (P<0.01), there are 3 principal components in the models. The cumulative variance that they explain is 84.550%. Table 7 shows the rotated component matrix. From it we can see that QO,N, PMIX and SAS can be replaced by the first component, QH2 and QH can be replaced by the second component, and dT can be replaced by the third component.
Full table
Discussion
We have constructed a theoretical model of corneal permeability of organic compounds. With the increase in the number of variables, the relativity of the MI-QSAR equation is also improved, and the predictive ability of the model is enhanced. Equation 6 is most significant. Moreover, the models have been validated by using the compounds of the test set, and the 5–6 term MI-QSAR models could be used to predict log P for other compounds during drug design.
These MI-QSAR models indicate that corneal permeability depends on 5 parameters: QH, QO,N, dT, PMIX, and SAS. QH seems to be the dominant descriptor in these MI-QSAR models, which is a parameter that is closely related to the hydrophilic groups such as -COOH, -NH2, -OH, and -NH-. A compound with greater corneal permeability usually has adequate hydrophilic groups. Relative to the stroma, the barrier effect of epithelium is more prominent, so when a compound has a QH value that is too high, its corneal permeability will decrease markedly. This is why log P is directly proportional to QH, but inversely proportional to QH2. The QH value is also relevant to the capacity of a compound to form hydrogen bonds, which is the same as the descriptor QO,N. When QO,N lessens, the value of log P will increase, which indicates that weak hydrogen bond potential is favorable for corneal penetration. This is a similar situation to the transport of compounds through other biological membranes such as skin[26,27], small intestine[28], Caco-2 cell monolayers[29,30], and the blood-brain barrier[31]. PMIX is the moment of inertia (X) when the Cartesian coordinate axes are the principal axes of the molecule. The inertia of a molecule is determined by its 3-dimensional structure, and describes the molecule shape. The MI-QSAR models reveal that with the accretion of inertia (X), the solute compound becomes more easily to penetrate through the cornea. It can be inferred that quadrate molecules are more likely to permeate the cornea. SAS represents the area of the solute that contacts the solvent, and can be considered as an index of the solute’s hydrophobic properties. When SAS increases, the value of log P decreases. Thus, it can be concluded that hydrophobic (lipophilic) molecules can cross the corneal barrier more easily.
The other descriptor, dT, reflects the interaction of the solute with the membrane and the behavior of the entire membrane-solute complex. Here, the greater dT is, the more the value of log P increases. This indicates that for a small molecule-membrane complex in the combined state, the log P value is low when its Etorsion is stable, which means that the more tightly a small molecule combines with the membrane, the more difficultly it has in penetrating through the corneal barrier. This suggests that as the solute becomes more flexible within the membrane, its log P value would decrease. This may be due to the complex amphiphilic structure of the corneal barrier.
On the basis of the results of the PCA, the capability of a organic compound to permeate the cornea is mainly related to 3 principal components, which can be related to the molecular structure and shape, the hydrophilicity of a solute molecule, and the strength of the combination of a small molecule with the membrane, respectively. The molecular structure and shape are described by 3 parameters: QO,N, PMIX and SAS. QO,N and SAS represent the strength of hydrogen bonds in a compound and PMIX represents the shape of a solute molecule. Generally, a quadrate molecule with weak hydrogen bond potential has good potential to penetrate the cornea. The hydrophilicity of a solute molecule is described by 2 descriptors, namely QH2 and QH. Generally, organic compounds with proper hydrophilic groups, in which lipophilicity is greater than hydrophilicity, are easily able to penetrate through the cornea. The strength of the combination of a small molecule with the membrane is described by one parameter, namely ΔEtorsion. The more tightly a small molecule combines with the membrane, the more difficulty it has in penetrating through the corneal barrier.
For QSAR models, the less comparable the studied molecules are, the more universally significant the equations are. On the other hand, the precision of a MI-QSAR simulation may be greatly increased when a series of organic compounds with similar structures comprise the training set. Although our MI-QSAR models are noncongeneric models based on several types of organic compounds, there are still many types of compounds that cannot be included in these models. For further studies, we should pay more attention to the experimental component, in order to expand the research range of molecules and search for new models that can unify more types of compounds, to improve the practical value of the constructed models.
In conclusion, we have developed an extension of the traditional QSAR approach by combining it with a solute-membrane complex that simulates the corneal environment. MI-QSAR analysis is a structure-based design methodology combined with classic intramolecular QSAR analysis to model the interactions of different compounds with cellular membranes. Although still applying the structural information in a 2-dimensional, “structure-function relationship” manner, this method also takes into account the powerful 3-dimensional behavior displayed by membrane structures, and thus improves on past QSAR methods. With the help of the model, the membrane penetration process can be reliably described for structurally diverse molecules whose interactions with the phospholipid-rich regions of cellular membranes are explicitly considered. The MI-QSAR models indicate that the corneal permeability of organic molecules is not only influenced by organic solutes themselves, but is also related to the properties of the solute-membrane complex, that is, interactions between the molecule and the phospholipid-rich regions of cellular membranes. Compared with the work of Iyer and coworkers, which paid more attention to the energy parameters of the solute-membrane system[21], our models achieve a better correlation coefficient and smaller standard deviation by taking a wider range of descriptors into account, and thus have a better predictive ability. Moreover, we use PCA to identify the descriptors involved in the models, which makes the data analysis more clear and reliable. In addition, by building an application for the constructed models, we recognize the human-machine dialog in the prediction process, and make the work easier.
References
- Davies NM. Biopharmaceutical considerations in topical ocular drug delivery. Clin Exp Pharmacol Physiol 2000;27:558-62.
- Ahmed I, Patton TF. Disposition of timolol and insulin in the rabbit eye following corneal versus noncorneal absorption. Int J Pharm 1987;38:9-21.
- Kumar MT, Pandit JK, Balasubramaniam J. Novel therapeutic approaches for uveitis and retinitis. J Pharm Pharm Sci 2001;4:248-54.
- Toropainen E, Ranta VP, Talvitie A, Suhonen P, Urtti A. Culture model of human corneal epithelium for prediction of ocular drug absorption. Invest Ophthalmol Vis Sci 2001;42:2942-8.
- Maurice DM, Mishima S. Ocular pharmacokinetics. In: Sears MC, editor. vol 69. Handbook of experimental pharmacology. Pharmacology of the eye. Berlin: Springer-Verlag; 1984. p19–116.
- Schornwald RD. Ocular drug delivery. Pharmacokinetic considerations. Clin Pharmacokinet 1990;18:255-69.
- Liaw J, Robinson JR. Ocular penetration enhancers. In: Mitra AK, editor. Ophthalmic drug delivery system. New York: Marcel Dekker; 1993. p 369–81.
- Borchardt RT. Assessment of transport barriers using cell and tissue culture systems. Drug Dev Ind Pharm 1990;16:2595-612.
- Schoenwald RD, Huang HS. Corneal penetration behavior of beta-blocking agents I: physiochemical factors. J Pharm Sci 1983;72:1266-72.
- Liaw J, Robinson JR. The effect of polyethylene glycol molecular weight on corneal transport and the related influence of penetration enhancers. Int J Pharm 1992;88:125-40.
- Liaw J, Rojanasakul Y, Robinson JR. The effect of drug charge type and charge density on corneal transport. Int J Pharm 1992;88:111-24.
- Sieg JW, Robinson JR. Vehicle effects on ocular drug bioavailability II: evaluation of pilocarpine. J Pharm Sci 1977;66:1222-8.
- Maren TH, Jankowska L. Ocular pharmacology of sulfonamides: the cornea as barrier and depot. Curr Eye Res 1985;4:399-408.
- Wei G, Xu H, Ma Y, Li SM, Zheng JM. Effect of pH on the permeability of timolol maleate across isolated rabbit cornea. Acta Pharm Sin 2001;36:707-10.
- Shih RL, Lee VHL. Rate limiting barrier to the penetration of ocular hypotensive beta blockers across the corneal epithelium in the pigmented rabbit. J Ocul Pharmacol 1990;6:329-36.
- Loftssona T, Jarvinen T. Cyclodextrins in ophthalmic drug delivery. Adv Drug Deliv Rev 1999;36:59-79.
- Schoenwald RD, Ward RL. Relationship between steroid permeability across excised rabbit cornea and octanol-water partition coefficients. J Pharm Sci 1978;67:786-8.
- Grass GM, Robinson JR. Mechanisms of corneal drug penetration: in vivo and in vitro kinetics. J Pharm Sci 1988;77:3-17.
- Yoshida F, Topliss JG. Unified model for the corneal permeability of related and diverse compounds with respect to their physicochemical properties. J Pharm Sci 1996;85:819-23.
- Fu XC, Liang WQ. A simple model for the prediction of corneal permeability. Int J Pharm 2002;232:193-7.
- Iyer M, Mishra R, Han Y, Hopfinger AJ. Predicting blood-brain barrier partitioning of organic molecules using membrane-interaction QSAR analysis. Pharm Res 2002;19:1611-21.
- Ma XL, Chen C, Yang J. Predictive model of blood-brain barrier penetration of organic compounds. Acta Pharmacol Sin 2005;26:500-12.
- Hauser H, Pascher L, Pearson RH, Sundell S. Preferred conformation and molecular packing of phosphatidylethanolamine and phosphatidylcholine. Biochem Biophys Acta 1981;650:21-51.
- van der Ploeg P, Berendsen HJC. Molecular dynamics simulation of a bilayer membrane. J Chem Phys 1982;76:3271-6.
- Stouch TR. Lipid membrane structure and dynamics studied by all atom molecular dynamics simulations of hydrated phosphatidylcholine vesicles. Mol Simulation 1993;1:335-62.
- Abraham MH, Martins F, Mitchell RC. Algorithms for skin permeability using hydrogen bond descriptors: the problem of steroids. J Pharm Pharmacol 1997;49:858-65.
- Fu XC, Yu QS, Liang WQ. A modified mathematical model for percutaneous absorption of drugs. Chin Pharm J 2000;35:276-7.
- Clark DE. Rapid calculation of polar molecular surface area and its application to the prediction of transport phenomena. 1. Prediction of intestinal absorption. J Pharm Sci 1999;88:807-14.
- van de Waterbeemd H, Camenish G, Folkers G, Raevsky OA. Estimation of Caco-2 cell permeability using calculated molecular descriptors. Quant Struct Act Relat 1996;15:480-90.
- Fu XC, Liang WQ, Yu QS. Correlation of drug absorption with molecular charge distribution. Pharmazie 2001;56:267-8.
- Norinder U, Sjoberg P, Osterberg T. Theoretical calculation and prediction of brain-blood partitioning of organic solutes using Molsurf parameterization and PLS statistics. J Pharm Sci 1998;87:952-9.