
Kinetic changes and modulation by carbamazepine on voltage-gated sodium channels in rat CA1 neurons after epilepsy1
Introduction
Epilepsy is a common neurological disorder, affecting approximately 1%–2% of the population[1]. It is a chronic and often progressive brain disorder, characterized by the periodic and unpredictable occurrence of seizures[2]. In the absence of a specific etiological understanding, chronic administration of antiepileptic drugs (AEDs) to suppress seizures is the treatment in epilepsy. However, about 30% of epilepsy patients do not respond to the usual AEDs despite adequate drug treatment[3].
Voltage-gated sodium channels are molecular targets of many of the most widely used AEDs, like carbamazepine (CBZ), because they mediate regenerative inward currents that are responsible for the initial depolarization of action potentials in brain neurons. AEDs suppress abnormal neuronal excitability associated with seizures by means of complex voltage- and frequency-dependent inhibition of ionic currents through sodium channels[4]. Voltage-gated sodium channels have 3 functional states: open, resting and inactivated. Membrane depolarization activates channels from the resting to the open state allowing the rapid influx of sodium ions. During prolonged depolarization (>1 ms), the channels inactivate and sodium influx declines; in this state, the channels remain closed and are refractory unless the membrane is repolarized to allow them to recover to the resting state[5]. CBZ, as well as phenytoin and lamotrigine, binds to a common receptor located on the extracellular side of the sodium channel, and they all have much higher affinity to the inactivated state than to the resting state of the sodium channel[6].
The brain sodium channel proteins consist of a pore-forming α subunit associated with auxiliary β subunits – β1, β2, and/or β3[7–9]. So far, 4 different sodium channel subtypes have been identified in the rat brain: I, II, III, and VI[10–12]. The expression of α or β subunits in neurons can be altered during the epileptogenic process either in model rats or in human tissue[13–20]. In rodents, systemic administration of kainate, a glutamate receptor agonist, induces the development of the well-described model of limbic seizures which is accompanied by neuronal cell death, axonal sprouting and neosynaptogenesis in the hippocampus as well as the induction of specific genes[21].
The hippocampus plays a crucial role in the pharmaco-resistance of temporal lobe epilepsy in epilepsy patients[22], and the mechanisms underlying pharmacoresistance most likely involve the functional and morphological changes developing in the hippocampus in the course of the disease[23]. So our question is raised as to whether the properties of the sodium channels in hippocampal neurons could be changed after short-term and long-term kainate-induced epilepsy and whether the efficacy of CBZ might be reduced following epilepsy.
Materials and methods
Animals Twenty-six male Sprague-Dawley rats (Harlan, Zeist, the Netherlands), weighing 150–200 g at the time of kainate injection, were used in this study. Twelve rats were used for the 3 week kainate model experiments (6 rats in each control and kainate group) and 14 rats were used for the 3 month experiment (7 rats in each control and kainate group). The rats were housed in individual cages under a controlled environment (21±1 oC; humidity 60%; light at 08:00–20:00). Food and water were available ad libitum. All the animal experiments were performed in accordance with the regulations of the Animal Welfare Committee of the University of Amsterdam, which strives to minimize the use and suffering of experimental animals.
Short-term (3 weeks) and long-term (3 months) kainate model rats of epilepsy Epilepsy was induced with kainate acid (KA) (Biovectra, Charlottetown, Prince Edward Island, Canada) injections according to the protocol of Hellier et al[24] and Wuarin and Dudek[25]. The rats were injected intraperitoneally with 10 mg/kg KA dissolved in 0.05 mol/L phosphate-buffered saline (PBS; pH=7.4). The animals were monitored throughout status epilepticus (SE) induction, and seizure severity was assessed according to a modified Racine’s scale[26,27]. Motor seizure activity was characterized as follows: class III, animals displayed forelimb clonus with a lordotic posture; class IV, animals reared with concomitant forelimb clonus; and class V, animals had a generalized clonic convulsion associated with loss of balance. When the rats did not exhibit clear behavioral changes within 1 h after injection, additional KA injections (5 mg/kg) were given every hour until a clear change of behavior (stage II/III seizures) was observed. The maximal cumulative dose varied between 10–25 mg/kg. No termination of convulsions by ketamine/xylazine (ket/xyl) was used to minimize risk of death. An SE was considered to have been established if the rats experienced more than 2 stage IV/V seizures within the first hour after the injection. The control rats were injected intraperitoneally with 0.05 mol/L PBS (pH=7.4). Sugar water was supplied to all rats for 24 h after the KA treatment. The animals were killed 2 weeks (short-term kainate model) or 3 months (long-term kainate model) after SE.
Cell preparation On each experimental day, a rat was decapitated. The brain was quickly removed and cooled immediately in an oxygenated PIPES buffered dissociation solution, containing (mmol/L) 120 NaCl, 5 KCl, 1 MgCl2, 20 PIPES, 25 D-glucose; pH 7.0 (adjusted using NaOH). From a 300 µm thick transverse slice of the hippocampus, the CA1 area was dissected and cut into 0.5 mm thick slabs, which were incubated for 50 min at 32 oC in oxygenated PIPES-buffered dissociation solution containing 1 mg/mL trypsin (type XI from bovine pancreas; Sigma, St Louis, MO). After washing, tissue pieces were kept in dissociation solution at room temperature (20 oC) until use. Neurons were isolated by trituration of a tissue piece in 0.5 mL extracellular solution through a series of Pasteur pipettes with decreasing diameter and brought into a perfusion chamber of an inverted microscope (Diaphot, Nikon). Pyramidal shaped neurons with a clear apical dendrite, a bright and smooth appearance and no visible organelles were selected for electrophysiological measurements[28].
Current recording Voltage-dependent sodium currents were measured under whole-cell voltage-clamp conditions at room temperature (20 oC), using patch pipettes of 2–3 MΩ resistance. Pipette solution contained (in mmol/L) 110 CsF, 5 NaCl, 10 EGTA, 10 HEPES, 2 MgCl2, 25 TEACl, 5 MgATP, 0.1 NaGTP, 0.1 LEUPEPTIN. The pH was adjusted to 7.3 using CsOH. Neurons were continuously perfused with extracellular solution containing (in mmol/L) 95 Choline-Cl, 20 NaCl, 10 HEPES, 2 CaCl2, 1 MgCl2, 5 KCl, 25 tetraethylammonium chloride, 5 4-aminopyridine (4-AP), 100 μmol/L CdCl2 and 25 mmol/L D-glucose; pH 7.4 (adjusted using HCl). To avoid space-clamp problems, the sodium gradient was reduced by equimolarly replacing part of the sodium in the extracellular solution by choline. After gigaseal formation and cell membrane rupturing, series resistance was compensated for 75%. The protocols were applied by an Atari (TT030) computer-controlled Axopatch 200A amplifier. The membrane capacitance was read from the amplifier dials as a measure of membrane surface. The holding membrane potential was set at -70 mV. The currents were sampled at a frequency of 5 kHz and analyzed using custom-made software. Two to 4 min after the whole-cell configuration, the cell was moved into either control or drug-containing extracellular solution emitted by the application pipette using the Fast-Step Perfusion system (SF-77B, Warner Instrument Corporation, Hamden, USA). In each extracellular solution (control or drug-containing) protocols were performed twice, and the control extracellular solution was always applied before and after drug use. A small drift of the voltage dependence of steady-state inactivation and recovery from inactivation with time was executed when estimating the effects of the drugs. The interval of protocols was always 2.5 min. Current traces were corrected offline for linear leak using the leak conductance determined by a voltage step of -5 mV and +5 mV around the pre-pulse potential of -150 mV.
Data analysis Only electrotonically compact cells that did not escape voltage clamp and showed little rundown within the recording time were incorporated in the analysis. The currents were corrected offline for linear non-specific leak and residual capacitive current transients. Data are given as the mean±SEM. Student’s t-test was used to compare groups of cells. P<0.05 was considered to indicate a significant difference.
Drugs and reagents CBZ (Sigma, USA) was dissolved in dimethylsulfoxide (DMSO; Sigma, USA) to make a stock solution of 200 mmol/L. Then it was diluted in extracellular solution to reach the final concentrations required (25, 75, and 100 µmol/L). The final concentration of DMSO was always 0.05%, which had no significant effect on sodium currents.
Results
We conducted experiments using rats 3 weeks (short term) and 3 months (long term) after kainate injection. All the results presented here were from long-term epileptic rats, except those we stated were from short-term epileptic rats.
Functional changes in sodium channels after kainate-induced epilepsy
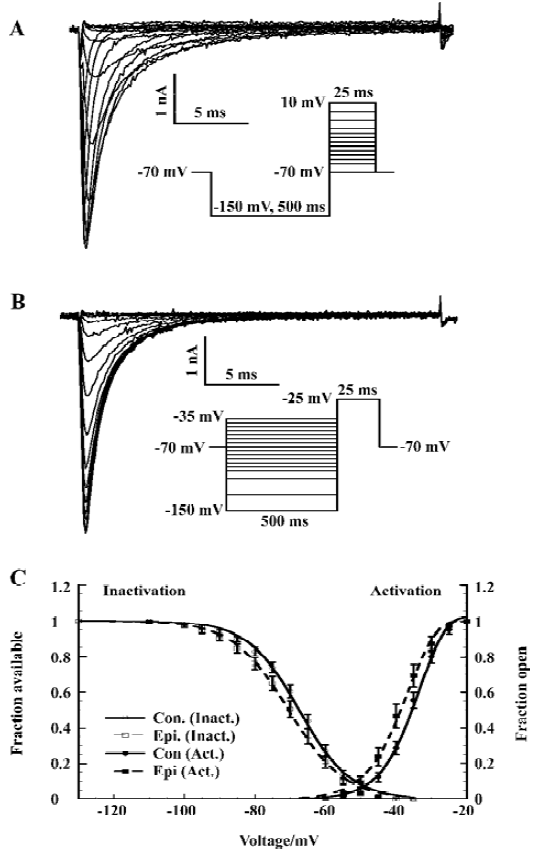
Voltage-dependent activation and steady-state inactivation shifted to the negative potentials We investigated the sodium channel properties on voltage-dependent activation and inactivation after epilepsy. Sodium currents were activated by depolarization (25 ms) to levels between -70 mV and +10 mV from a pre-pulse potential of -150 mV (Figure 1A). The depolarization activated a fast, transient inward sodium current that first increased in amplitude as the channels opened, and at higher potentials, decreased due to the reduced driving force. The current activated at potentials >-55 mV for the control (>-60 mV for epileptic) CA1 neurons, and the current amplitude increased with membrane potential up to -15 mV.
We determined the peak amplitude of the current for each step and constructed a current-voltage relation. This I–V curve was fitted to the Goldman-Hodgkin-Katz current equation[29] using a Boltzmann function to describe the sodium permeability as a function of membrane voltage (V):
Where α=F/RT and gmax=αF [Na+] outp0 where p0 is the maximal permeability, F is the Faraday constant, R is the gas constant and T represents the absolute temperature. The maximal conductance of the current is gmax (nS), while the potential of half-maximal activation (Vh) and the slope parameter (Vc) characterize its voltage dependence.
The voltage dependence of steady-state inactivation of the sodium current was measured by varying a 500 ms hyperpolarizing pre-pulse from -150 to -35 mV followed by a 25 ms depolarization to -25 mV (Figure 1B). The peak amplitude of the current (I) evoked at -25 mV was normalized to Imax and plotted as a function of pre-pulse potential (V). The curve was fitted by a Boltzmann equation:
Where Vh is the potential of half-maximal inactivation and Vc is proportional to the slope of the curve.
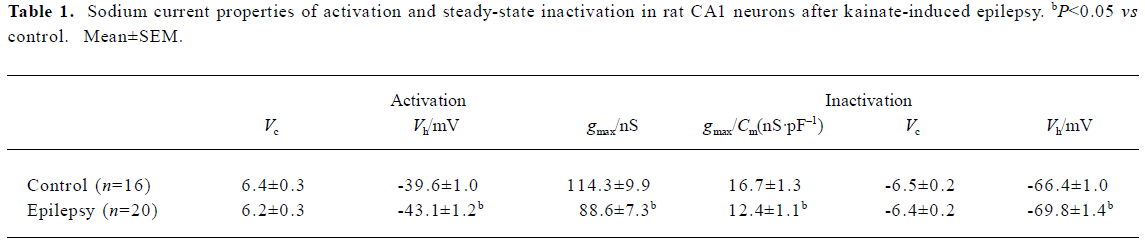
The sodium channel conductance (gmax) in CA1 neurons decreased after epilepsy, from 114.3±9.9 nS (n=16) to 88.6±7.3 nS (n=20); P<0.05 (Table 1). In order to exclude the interpretation of cell surface (indicated by membrane capacitance Cm), we calculated the sodium current density (gmax/Cm) and it was also lower in neurons after epilepsy from 16.7±1.3 nS/ pF (n=16) to 12.4±1.1 nS/pF (n=20); P<0.05 (Table 1).
Full table
Both voltage-dependence of activation and steady-state inactivation shifted to a more hyperpolarized direction without changing the slopes after epilepsy, with Vh of activation -43.1±1.2 mV (n=20; control rat: -39.6±1.0 mV, n=16; t-test P<0.05) and Vh of inactivation -69.8±1.4 mV (n=20; control rat: -66.4±1.0 mV, n=16; t-test, P<0.05; Figure 1C; Table 1).
The voltage-dependent properties of activation and steady-state inactivation from the short-term epilepsy group did not differ from the control group (data not shown).
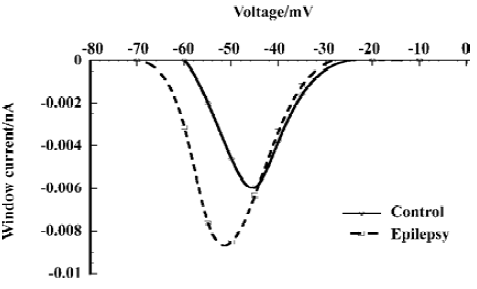
Increase of the window current In the small voltage range where the activation and inactivation curves of the fast sodium current overlap, a persistent window current exists because the current can be activated that will not completely inactivate[30]. The overlap was illustrated in Figure 1 (A). We calculated the absolute window current from the product of the activation and inactivation function (Eqn 1 and Eqn 2) using the mean parameters given in Table 1. After kainate-induced epilepsy, the maximal window current amplitude increased from 6 pA to 9 pA, and it shifted to the hyperpolarizing direction from -46 mV to -52 mV (Figure 2).
Recovery from inactivation was slower The time course of recovery from inactivation was determined using a double-pulse protocol (Figure 3A). The interval Δt (during which the current was allowed to recover) between 2 25 ms depolarization steps varied between 1 and 200 ms. The recovery time constant was determined at membrane voltages of -70, -80, and -90 mV. The amplitude of the sodium current activated by the second pulse was plotted as a function of Δt and fitted with a single-exponential function to give the time constant of recovery from inactivation (Tau; Figure 3B).
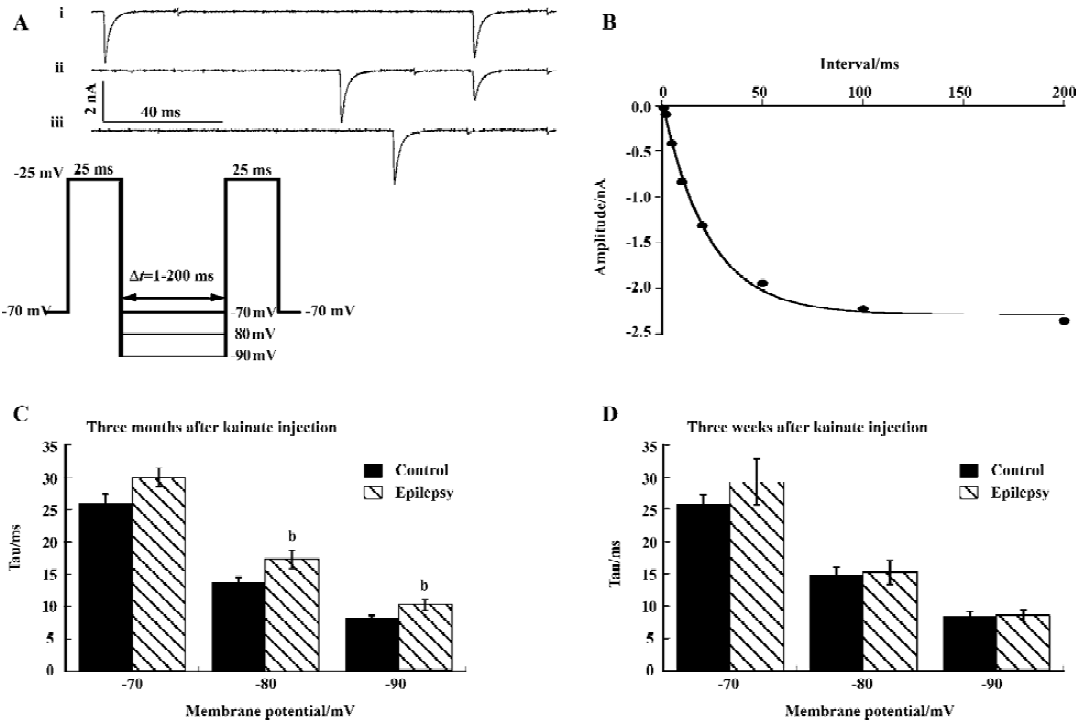
Recovery from inactivation was faster at more hyperpolarized membrane potentials, and recovery was slower after kainate-induced epilepsy, which reached significance at membrane potential of -80 and -90 mV (P<0.05; Figure 3C). Three weeks after kainate injection, recovery was unchanged (Figure 3D).
Sodium channel inhibition by CBZ after kainate-induced epilepsy
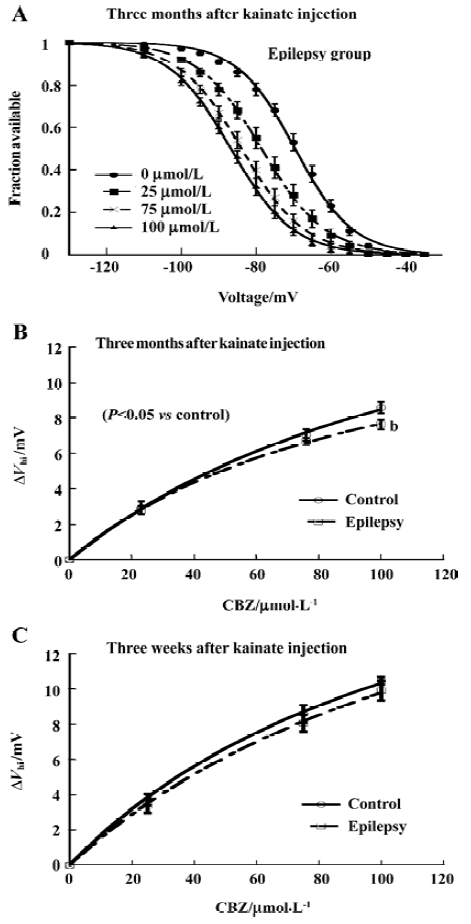
The voltage shift of the steady-state inactivation by CBZ slightly decreased The protocol is described in Figure 1C. CBZ concentration-dependently shifted the sodium channel inactivation curves to more hyperpolarized potentials in rat CA1 neurons after kainate-induced epilepsy (Figure 4A). However, in comparison with control group, the absolute shift of the midpoint of the steady-state inactivation curves (ΔVhi, which is the difference between the control and presence of CBZ. In this way the small drift with time in voltage dependence of steady-state inactivation was also corrected) by CBZ in the epilepsy group was slightly smaller, which reached significance at 100 µmol/L (P<0.05, Figure 4B). The similar shift by CBZ was also found in the rats 3 weeks after kainate injection, but there was no significant difference between the control and epilepsy groups (Figure 4C).
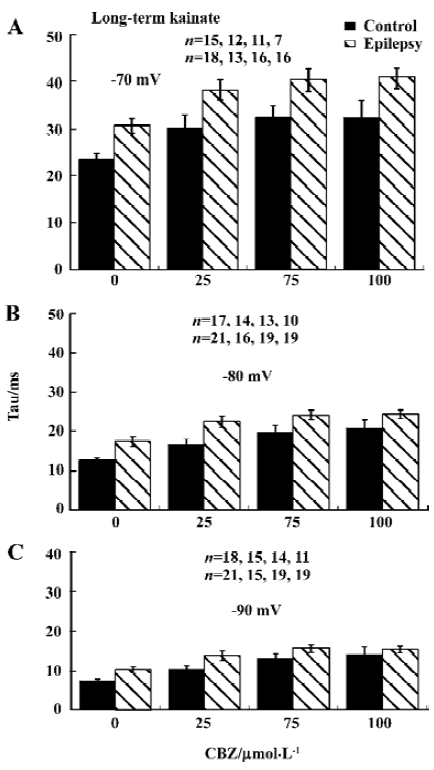
Time constant of recovery from inactivation by CBZ was not significantly changed The time course of recovery from inactivation was determined by the same double-pulse protocol as described in Figure 3A. CBZ concentration dependently slowed down the recovery from inactivation at each membrane potential, represented by the increased time constant (Tau) of recovery from inactivation in the presence of different CBZ concentrations (Figure 5). The Tau was bigger with higher concentration of CBZ generally, and it had not changed significantly after kainate-induced epilepsy (Figure 5). The binding rate constant of CBZ to the fast inactivated sodium channels in rat CA1 neurons was not changed significantly after kainate-induced epilepsy.
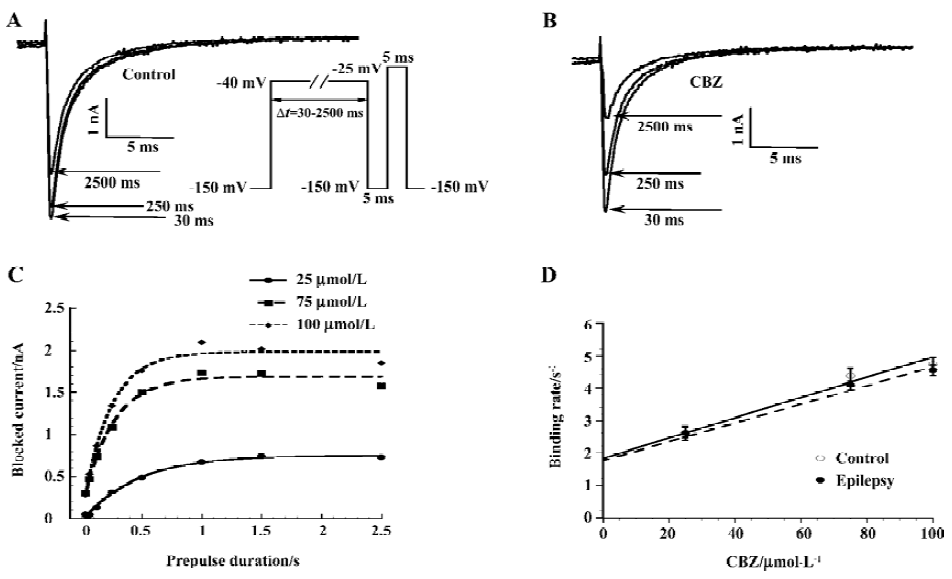
Experiments were performed to determine the binding rate at which CBZ binds to the inactivated sodium channels, and it was assessed by a voltage protocol described in Figure 6A[31]. With such a protocol, the channels were exposed to a depolarizing voltage step (to -40 mV) of different durations (30–2500 ms). Longer depolarizing voltage steps allowed more channels to enter the inactivated state, and due to the much higher affinity of CBZ to this state, more channels were blocked. Figure 6A demonstrates that with increasing pre-pulse durations, more sodium currents became blocked in the presence of 75 µmol/L CBZ. By subtracting the control current (no CBZ present) from the current in the presence of CBZ at each pre-pulse duration, the CBZ-blocked current was obtained. This procedure eliminated the contamination by slowly inactivating currents. Expressing the blocked current as a function of the pre-pulse duration showed the development of the CBZ block, a relationship that can be fitted with a mono-exponential function and the resulting Tau value describes the time course of development of the block for each CBZ concentration (Figure 6B). The 1/Tau value at each CBZ concentration yielded the binding rates and these increased linearly with higher CBZ concentrations for the control and epilepsy neurons (Figure 6C). The slopes of these linear relationships gave the binding rate constant of CBZ for the sodium channels of the control and epilepsy CA1 neurons. These values were (31.3±2.6)×103 (mol/L)-1⋅s-1 for the control group (n=11) and (28.9±4.7)×103 (mol/L)-1⋅s-1 for the epilepsy group (n=16), without significant differences between them. This finding indicates that the binding of CBZ to the inactivated sodium channels is similar for the control and epilepsy groups.
Discussion
In the present study, we characterized the properties of the voltage-gated sodium current and its modulation by CBZ in acutely dissociated hippocampal CA1 neurons from rats 3 months and 3 weeks after kainate injection and the binding rate constant of CBZ onto the inactivated channels. Our main findings were the enlarged and negative voltage shifted window currents which were mainly caused by the negative shift of the voltage-dependent activation, and the increased recovery time constant from inactivation after epilepsy. The efficacy of CBZ and its binding rate to the channels did not change markedly. For the short-term (3 weeks) epileptic rats, we could not detect any differences on sodium currents between the control and epilepsy groups.
Epilepsy model induced by kainate injection All the epileptic rats (3 months and 3 weeks after kainate injection) in our study were wild and showed typical behaviors of epileptic seizures compared with the control rats. In the hippocampal CA1 area of the epileptic rats, there was a significant cell loss found by Gorter et al[32].
Functional changes in sodium channels after kainate-induced epilepsy The overlap of the activation and the inactivation curves gives rise to a voltage-window in which a persistent current exists, because activation occurs at a voltage where the current will not completely inactivate. When it is of sufficient amplitude, it is important for cellular excitability[30]. In our study, after epilepsy, the window current was larger due to the more hyperpolarizing voltage shift of activation than inactivation, and the voltage at which the maximal window current amplitude occurred shifted 6 mV to the negative direction. That means it will drive the membrane voltage closer to the firing threshold, thereby lowering the threshold for epileptic activity.
On the other hand, our data showed that neuron excitability could also be attenuated after epilepsy due to the slowed recovery from inactivation and decreased membrane current density. The slowed recovery from inactivation could be accounted for by the negative voltage shift of activation and inactivation, which could cause the inactivated channels to accumulate so as to enlarge the refractory period. With regards to the lower membrane current density, our explanation is that it could be a compensation mechanism or that the cells we recorded were from surviving cells after seizures, as we saw the significant cell loss in cell suspension compared with the control. We did not detect any differences of channel properties between the control and epilepsy groups in short-term epileptic rats. So the sodium channel properties could change secondary to long-term epileptic seizures.
Sodium channel inhibition by CBZ after kainate-induced epilepsy CBZ displayed similar sodium channel inhibition on long-term and short-term epileptic rats as it does usually. It shifted the voltage-dependence of inactivation to more negative potentials, with the similar ΔVhimax and EC50; concentration-dependently slowed down the recovery from inactivation. The only difference we found was at 100 µmol/L where ΔVhi shifted by CBZ was reduced after long-term epilepsy. Because 100 µmol/L was much higher than CBZ’s therapeutically relevant concentration range in the human brain (3–15 µmol/L[33]), we assume that long-term epileptic seizures might not be the key factor causing pharmaco-resistance of CBZ in clinical epilepsy treatment, at least from this epilepsy model study. In additional, CBZ bound to the inactivated channels at a similar speed after epilepsy compared with the control, which also supports our conclusion.
The possible mechanism for the functional changes of sodium channels associated with epilepsy and the slightly reduced response of channels to CBZ modulation could be as follows: (1) the changed expression of sodium channel subtypes. Even though we do not have direct proof of this in our study, we can not exclude its involvement. Bartolomei et al[20] reported that following KA-induced seizures, there was a marked increase in type III mRNA expression and a modest increase in type II mRNA expression in the rat hippocampus. Furthermore, in the human epileptic hippo-campus, a significant downregulation of type II mRNA and a significant upregulation of type III mRNA were observed[14]. Taken together, there is a higher expression of type III mRNA than type II mRNA of sodium channels in the hippocampus after epilepsy. In our other study of sodium channel subtypes expressed in HEK cells and CBZ, we detected the different pharmacological profiles of CBZ between type II and type III, and this observation supports our suggestion in the present study; (2) the changed expression of sodium channel auxiliary β subunits. In a 72 h observation after kainate injection, β2 mRNA expression was seen to increase transiently in the first 1 h and then decreased significantly in the hippocampus[18]. This variation might play a role in cellular excitability changes occurring in the course of seizures, because the expression of the β2 subunit with neuronal α subunits in oocytes increased current amplitude, modulated gating and increased membrane capacitance[34]; (3) mutation in genes encoding sodium channel α or β subunits. In generalized epilepsy with febrile seizure plus, mutation in 3 genes coding for α (SCN1A, SCN2A) or β1 subunits (SCN1B) have been identified[35–37]. In the functional study of mutations in SCN1A by heterologous expression with its known accessory subunits β1 and β2 in cultured mammalian cells, SCN1A mutations could alter channel inactivation, resulting in persistent inward sodium currents, which could likely enhance excitability of neuronal membranes by causing prolonged membrane depolarization[38]; (4) sodium channel modulation by guanine nucleotide binding protein (G protein)-coupled pathways. Sodium channels in hippocampal neurons could be modulated by G-protein-coupled pathways under conditions of whole-cell voltage clamp[39]. The activation of the G protein increased the sodium current amplitude caused by a negative shift in the voltage dependence of both activation and inactivation[39].
Other functional studies on sodium channels after epilepsy In long-term epileptic rats induced by pilocarpine, the sodium channel window current in dentate granule cells increased due to the positive shift of voltage-dependent inactivation and the negative shift of voltage-dependent activation. No changes were found in the recovery from inactivation[40]. Furthermore CBZ completely lost its effects on slowing down the fast recovery from inactivation, and so failed to reduce the sodium current availability during high-frequency action potential series[41]. In another pilocarpine model, epileptic rats responded to CBZ treatment at very high concentrations[42]. Our present results are not consistent with these findings, which may be related to the different induction protocols leading to chronic epilepsy, as well as the different cell types detected. Because the processes underlying epileptogenesis even differ among post-status epilepsy models, like pilocarpine and kainate models, the markedly different antiepileptogenic effects of drugs could exist between models[43].
Our conclusion is that the properties of sodium channels in acutely dissociated hippocampal neurons could change secondary to the chronic epilepsy processes. However, the alternation is not enough to destroy the effective targeting of CBZ, so it is not the key factor for pharmacoresistance.
Acknowledgement
We thank Twan JANSEN (Center for Neuroscience, Swammerdam Institute for Life Sciences, University of Amsterdam, Amsterdam, the Netherlands) for participating in some of the experiments.
References
- Browne TR, Holmes GL. Epilepsy. N Engl J Med 2001;344:1145-51.
- Lothman EW. Basic mechanisms of seizure expression. Epilepsy Res 1996.Suppl 11:9-16.
- Regesta G, Tanganelli P. Clinical aspects and biological bases of drug-resistant epilepsies. Epilepsy Res 1999;34:109-22.
- Ragsdale DS, Avoli M. Sodium channels as molecular targets for antiepileptic drugs. Brain Res Brain Res Rev 1998;26:16-28.
- Clare JJ, Tate SN, Nobbs M, Romanos MA. Voltage-gated sodium channels as therapeutic targets. Drug Discov Today 2000;5:506-20.
- Kuo CC. A common anticonvulsant binding site for phenytoin, carbamazepine, and lamotrigine in neuronal Na+ channels. Mol Pharmacol 1998;54:712-21.
- Catterall WA. Structure and function of voltage-gated ion channels. Annu Rev Biochem 1995;64:493-531.
- Catterall WA. Molecular properties of brain sodium channels: an important target for anticonvulsant drugs. Adv Neurol 1999;79:441-56.
- Catterall WA. From ionic currents to molecular mechanisms: the structure and function of voltage-gated sodium channels. Neuron 2000;26:13-25.
- Noda M, Ikeda T, Suzuki H, Takeshima H, Takahashi T, Kuno M, et al. Expression of functional sodium channels from cloned cDNA. Nature 1986;322:826-8.
- Kayano T, Noda M, Flockerzi V, Takahash H, Numa S. Primary structure of rat brain sodium channel III deduced from the cDNA sequence. FEBS Lett 1988;228:187-94.
- Schaller KL, Krzemien DM, Yarowsky PJ, Krueger BK, Caldwell JH. A novel, abundant sodium channel expressed in neurons and glia. J Neurosci 1995;15:3231-42.
- Aronica E, Troost D, Rozemuller AJ, Yankaya B, Jansen GH, Isom LL, et al. Expression and regulation of voltage-gated sodium channel beta1 subunit protein in human gliosis-associated pathologies. Acta Neuropathol (Berl) 2003;105:515-23.
- Whitaker WR, Faull RL, Dragunow M, Mee EW, Emson PC, Clare JJ. Changes in the mRNAs encoding voltage-gated sodium channel types II and III in human epileptic hippocampus. Neuroscience 2001;106:275-85.
- Aronica E, Yankaya B, Troost D, van Vliet EA, Lopes da Silva FH, Gorter JA. Induction of neonatal sodium channel II and III alpha-isoform mRNAs in neurons and microglia after status epilepticus in the rat hippocampus. Eur J Neurosci 2001;13:1261-6.
- Whitaker WR, Clare JJ, Powell AJ, Chen YH, Faull RL, Emson PC. Distribution of voltage-gated sodium channel alpha-subunit and beta-subunit mRNAs in human hippocampal formation, cortex, and cerebellum. J Comp Neurol 2000;422:123-39.
- Whitaker WR, Clare JJ, Emson PC. Differential distribution of voltage-gated sodium channel alpha- and beta-subunits in human brain. Ann N Y Acad Sci 1999;868:88-92.
- Gastaldi M, Robaglia-Schlupp A, Massacrier A, Planells R, Cau P. mRNA coding for voltage-gated sodium channel beta2 subunit in rat central nervous system: cellular distribution and changes following kainate-induced seizures. Neurosci Lett 1998;249:53-6.
- Gastaldi M, Bartolomei F, Massacrier A, Planells R, Robaglia-Schlupp A, Cau P. Increase in mRNAs encoding neonatal II and III sodium channel alpha-isoforms during kainate-induced seizures in adult rat hippocampus. Brain Res Mol Brain Res 1997;44:179-90.
- Bartolomei F, Gastaldi M, Massacrier A, Planells R, Nicolas S, Cau P. Changes in the mRNAs encoding subtypes I, II and III sodium channel alpha subunits following kainate-induced seizures in rat brain. J Neurocytol 1997;26:667-8.
- Ben-Ari Y, Represa A. Brief seizure episodes induce long-term potentiation and mossy fibre sprouting in the hippocampus. Trends Neurosci 1990;13:312-8.
- Jeub M, Beck H, Siep E, Ruschenschmidt C, Speckmann EJ, Ebert U, et al. Effect of phenytoin on sodium and calcium currents in hippocampal CA1 neurons of phenytoin-resistant kindled rats. Neuropharmacology 2002;42:107-16.
- Heinemann U, Draguhn A, Ficker E, Stabel J, Zhang CL. Strategies for the development of drugs for pharmacoresistant epilepsies. Epilepsia 1994;35 Suppl 5:S10-21.
- Hellier JL, Dudek FE. Spontaneous motor seizures of rats with kainate-induced epilepsy: effect of time of day and activity state. Epilepsy Res 1999;35:47-57.
- Wuarin JP, Dudek FE. Electrographic seizures and new recurrent excitatory circuits in the dentate gyrus of hippocampal slices from kainate-treated epileptic rats. J Neurosci 1996;16:4438-48.
- Racine RJ. Modification of seizure activity by electrical stimulation. II. Motor seizure. Electroencephalogr Clin Neurophysiol 1972;32:281-94.
- Ben-Ari Y. Limbic seizure and brain damage produced by kainic acid: mechanisms and relevance to human temporal lobe epilepsy. Neuroscience 1985;14:375-403.
- Vreugdenhil M, Faas GC, Wadman WJ. Sodium currents in isolated rat CA1 neurons after kindling epileptogenesis. Neuroscience 1998;86:99-107.
- Hille B. Ionic channels of excitable membranes. 2nd ed. Sundor-land (MA): Sinauner Associates Inc; 1992.
- Johnston D, Wu SMS. Foundations of cellular neurophysiology. Cambridge, Massachusetts: MIT Press; 1995.
- Kuo CC, Lu L. Characterization of lamotrigine inhibition of Na+ channels in rat hippocampal neurones. Br J Pharmacol 1997;121:1231-8.
- Gorter JA, Goncalves Pereira PM, van Vliet EA, Aronica E, Lopes da Silva FH, . Neuronal cell death in a rat model for mesial temporal lobe epilepsy is induced by the initial status epilepticus and not by later repeated spontaneous seizures. Epilepsia 2003; .44: 647–58.