
Metabolism and effect of para-toluene-sulfonamide on rat liver microsomal cytochrome P450 from in vivo and in vitro studies
Introduction
Para-toluene-sulfonamide (p- para-toluene-sulfonamide; PTS) is a novel anticancer reagent for which phase III clinical trials are being conducted in China. PTS is intended mainly for the treatment of breast cancer and head and neck squamous cancer. It is delivered by intravenous or intratumoral injection as an adjunct to chemotherapy and radiation therapy. The reagent has good lipophilic ability, and its clinical pharmacokinetics accord with the one-compartment model.
Because cytochrome P450 enzyme play a prominent role in the metabolism of many pharmaceutical agents and activation or deactivation of potential carcinogens, it would be useful to know as early in the development process as possible that which CYP enzymes are likely to process a new chemical entity (NCE), which CYP activities are likely to be altered by an NCE and the magnitude of the alteration. Moreover, CYP genes have promise in enhancing the sensitivity of tumor cells to cancer chemotherapeutic drugs[1]. Inhibition screening is very useful not only for investigating the potential influence of new drugs on liver CYP, but also for future applications of pharmacogenomics and pharmacogenetics to personalize treatment regimens[2].
In our experiments, we chose five CYP isoforms and their specific substrates (phenacetin for CYP1A2, tolbutamide for CYP2C7, dextromethorphan for CYP2D1 and CYP3A2, and chlorozoxazone for CYP2E1). Dextromethorphan is reduced to dextrorphan by the rat CYP2D1 enzyme. In a parallel pathway, it is N-demethylated to 3-methoxymorphinan, which is catalyzed by CYP3A2[3]. The known inhibitors selected for CYP1A2, CYP2C7, CYP2D1 and CYP3A2 were, respectively, α-naphthoflavone, sulfaphenazole, quinidine, and ketoconazole. The present study was designed to: (1) investigate the effect of PTS pretreatment on rat liver CYP content; (2) examine the kinetic parameters of PTS incubation metabolism toward CYP; (3) to identify the principal CYP isoforms that metabolize PTS; (4) assess the inhibitory mechanism of known inhibitors on PTS metabolism in vitro; (5) investigate the modulation effect of PTS on the activities of selected CYP isoforms.
Materials and methods
Chemicals PTS standard was manufactured by Aldrich (Wyoming, IL, USA), phenacetin (Phe), acetaminophen (Ace), tolbutamide (Tol), 4-hydroxytolbutamide (4-OH-Tol), chlorozoxazone (Chl), 6-hydroxychlorozoxazone (6-OH-Chl), dextromethorphan hydrobromide monohydrate (Dex), dextrorphan (Dor), 3-methoxymorphinan (3-MM), α-naphtho- flavone (α-Naph), sulfaphenazole (Sulf), quinidine (Qui), ketoconazole (Ket), antipyrine, β-nicotinamide adenine dinucleotide phosphate (β-NADP), glucose-6-phosphate (G-6-P), and glucose-6-phosphate dehydrogenase (G-6-PDH) were obtained from Sigma-Aldrich (St Louis, MO, USA). Chromatographic grade acetonitrile was purchased from Fisher Scientific (Fair Lawn, NJ, USA). All other supplies were of the highest grades available from standard commercial sources.
Solutions Stock solutions of the analytes were prepared separately by dissolving each compound in water with acetonitrile at concentrations lower than 1% (v/v)[4]. G-6-PDH was dissolved in 5 mmol/L sodium citrate and was kept at -80 °C until used.
Microsome preparation Male Wistar rats (3 months old, weighing 230–260 g) were purchased from the Department of Laboratory Animal Sciences, Capital University of Medical Sciences. Animals were divided into 4 groups, with 6 animals in every group. The groups received the following treatments: blank control, phenobarbital iv injection (40 mg/kg per d)[5], or PTS intravenous injection via the tail vein at dosages of 33 and 99 mg/kg per d .
Rats were killed after the animals had been treated for 4 consecutive days. Microsomes were prepared by differential centrifugation and the preparation was stored at -80 °C until used. All procedures were performed at 0–4 °C[6]. Total CYP content and microsome protein were measured by using the method of Omura[7] and Lowry[8]. SPSS pharmaceutical software was used for statistical comparisons. The significance level was set at P<0.05.
Microsome incubation and sample preparation The incubation volume was 0.5 mL, containing 1.0 mg protein, 100 mmol/L potassium phosphate buffer (pH 7.4), and an NADPH- generating system (0.5 mmol/L β-NADP, 2.0 mmol/L G-6-P, 5 mmol/L MgCl2, and 0.1 mmol/L ethylenediamine tetraacetic acid). The samples were preincubated for 5 min at 37 °C prior to the addition of 2 U G-6-PDH. Reactions were carried out for 30 min and terminated by placement into icy water and the addition of 100 µL 7% perchloric acid. The samples were centrifuged at 16 100× g for 10 min to pellet the protein precipitate. The supernatant was transferred for HPLC analysis. All incubations were carried out in triplicate, and the mean values were used for analysis[9].
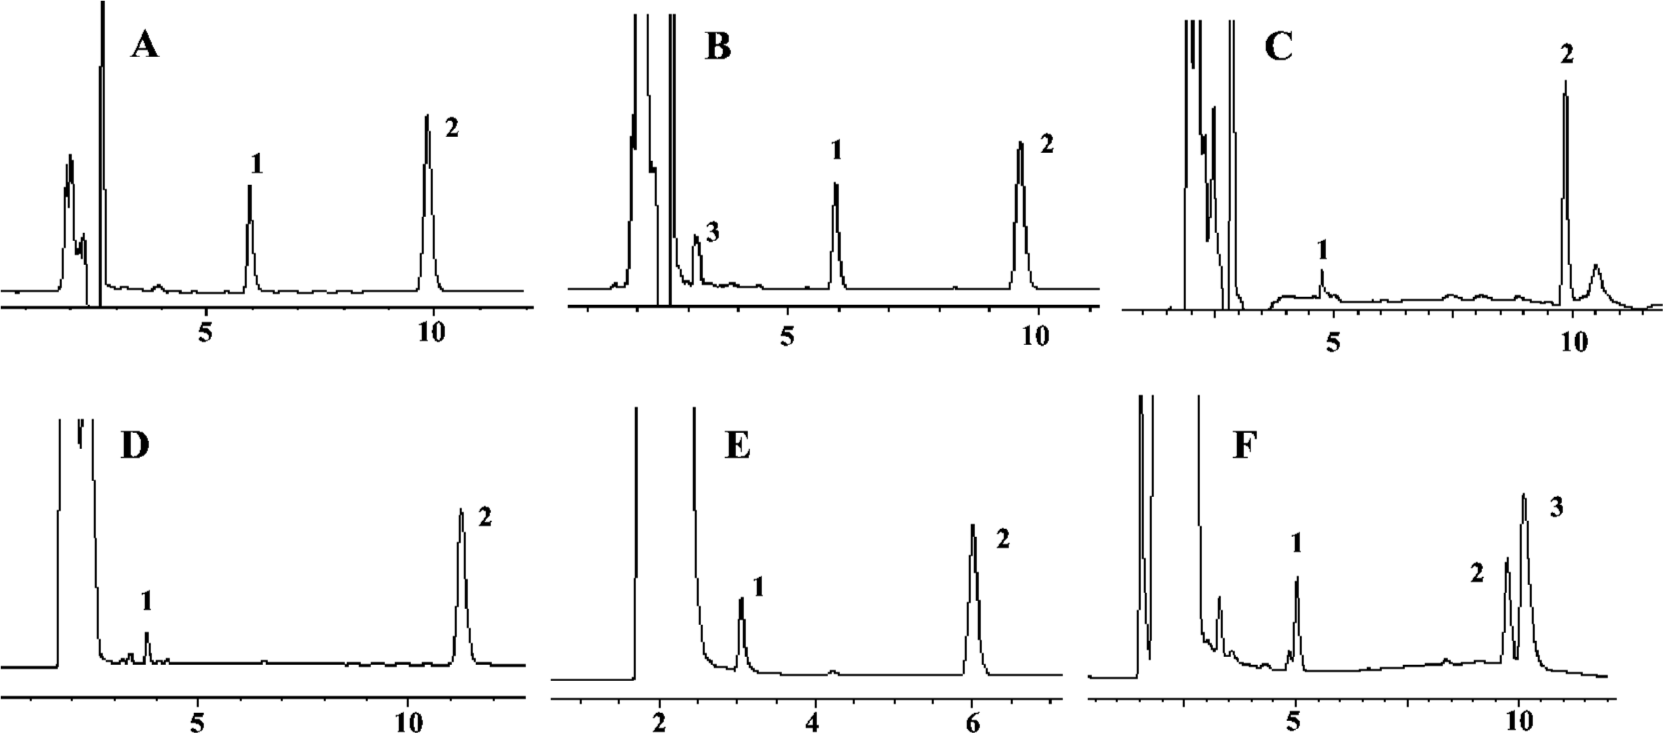
Apparatus and chromatographic conditions[10] The samples were analyzed on an Agilent 1100 series liquid chromatograph (Agilent Technologies, Waldbronn, Germany) at room temperature. An aliquot (50 µL) from each sample was injected onto an Agilent XDB C18 column (4.6 mm×250 mm, 5 µm). Compounds were quantified using their peak areas.
For CYP1A2 phenacetin O-deethylase, the mobile phase consisted of a gradient of acetonitrile/water with 0.1% acetic acid (pH 3.5) monitored at 230 nm. The flow rate was 1.2 mL/min. The retention times of Ace and Phe were 4.7 min and 9.9 min, respectively.
For CYP2C7 tolbutamide methylhydroxylation, mobile phase A consisted of acetonitrile, and mobile phase B consisted of water with 0.1% acetic acid (pH 3.5; 40:60), monitored at 230 nm. The flow rate was 1.2 mL/min. The retention times of 4-OH-Tol and Tol were 3.8 min and 11.3 min, respectively.
For CYP2D1 dextro-O-demethylation and CYP3A2 dextro-N-demethylation, the mobile phase consisted of a gradient of acetonitrile/water with acetic acid and 0.1% triethylamine (pH 4.5) monitored at 277 nm. The flow rate was 1.0 mL/min. The retention times of Dor, 3MM and Dex were 4.7 min, 10.6 min and 11.1 min, respectively.
For CYP2E1 chlorzoxazone 6-hydroxylation, mobile phase A consisted of acetonitrile and mobile phase B consisted of water with 0.1% acetic acid (pH 3.5; 40:60) monitored at 278 nm. The flow rate was 1.2 mL/min. The retention times of 6-OH-Chl and Chl were 3.1 min and 6.2 min, respectively.
For PTS, mobile phase A consisted of acetonitrile and mobile phase B consisted of water with 0.1% acetic acid (pH 3.5; 20:80) monitored at 230 nm. The flow rate was 1.2 mL/min. The retention times of the metabolites, internal standard (IS) and PTS were 3.0 min, 5.8 min and 9.7 min, respectively.
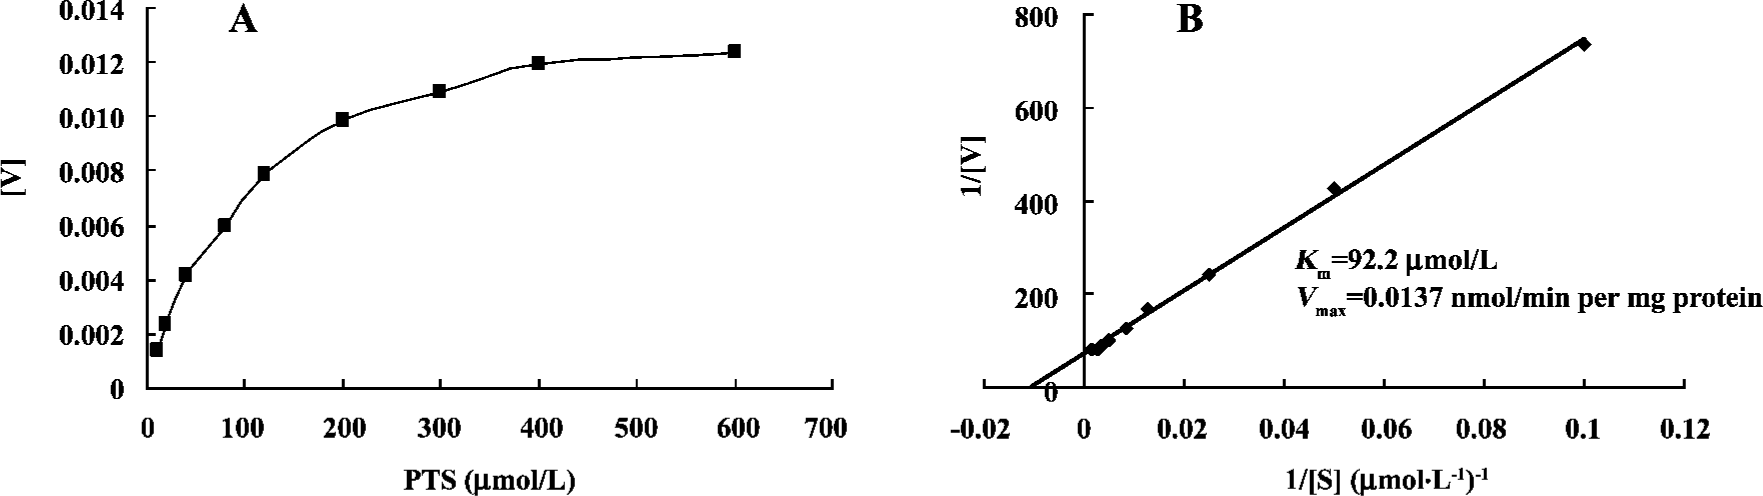
PTS incubation and kinetics assays To determine the kinetics of PTS metabolism, an incubation mixture contained PTS at 0, 10, 20, 40, 80, 100, 120, 200, 300, 400, and 600 μmol/L. The apparent Km and Vmax values were estimated by nonlinear regression analysis of V (enzyme activity) and [S] (substrate concentration) using the Michaelis-Menten model:
V=Vmax[S]/(Km+[S])
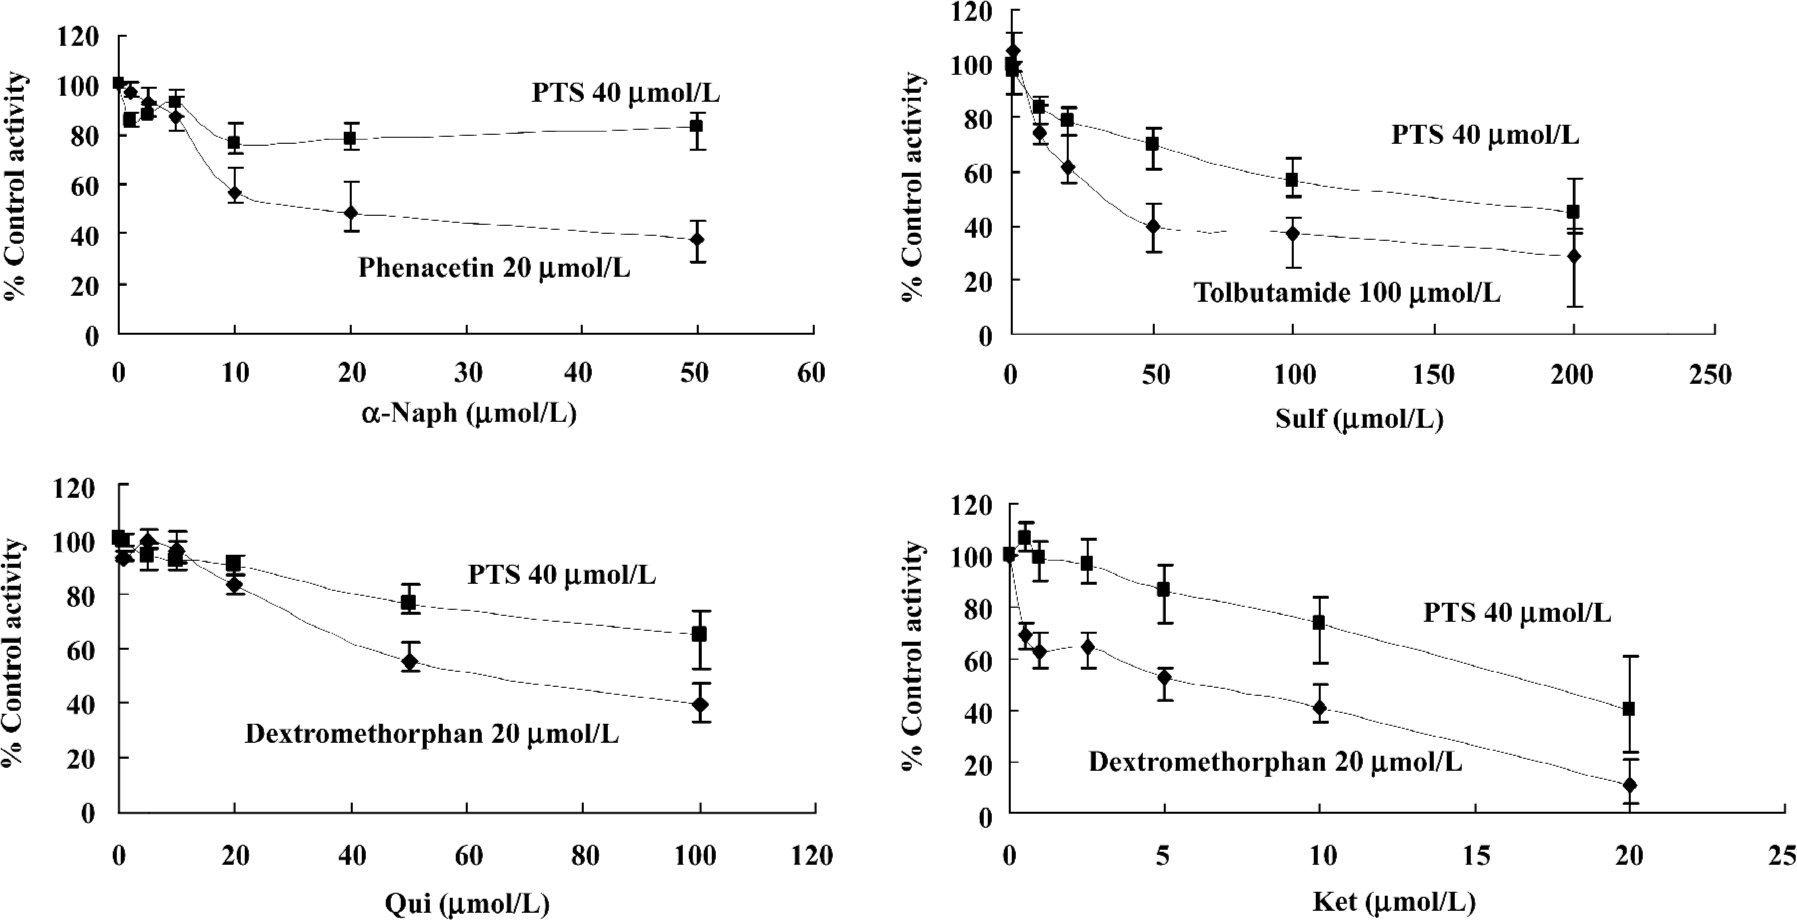
Inhibition study in rat liver microsomes The incubation mixture contained microsome protein, the relevant inhibitor, PTS, and NADPH-generating system. Various concentrations of α-Naph (1.0–50.0 µmol/L), Sulf (1.0–200.0 µmol/L), Qui (1.0–100.0 µmol/L), or Ket (0.5–20.0 µmol/L) were co-incubated with 40 µmol/L PTS. Because PTS metabolite standard was not available, the analyte to internal standard (antipyrine) peak area ratio was used instead of using absolute quantitation[11]. Both positive (in the presence of known inhibitors and specific substrates) and negative (in the presence of PTS or substrate and in the absence of the inhibitor) control samples were included in each assay to ensure the integrity of the microsomal incubation system. The result, expressed as percentage of control activity, was calculated based on a comparison between the peak area ratio of the sample and that of the negative control samples[2].
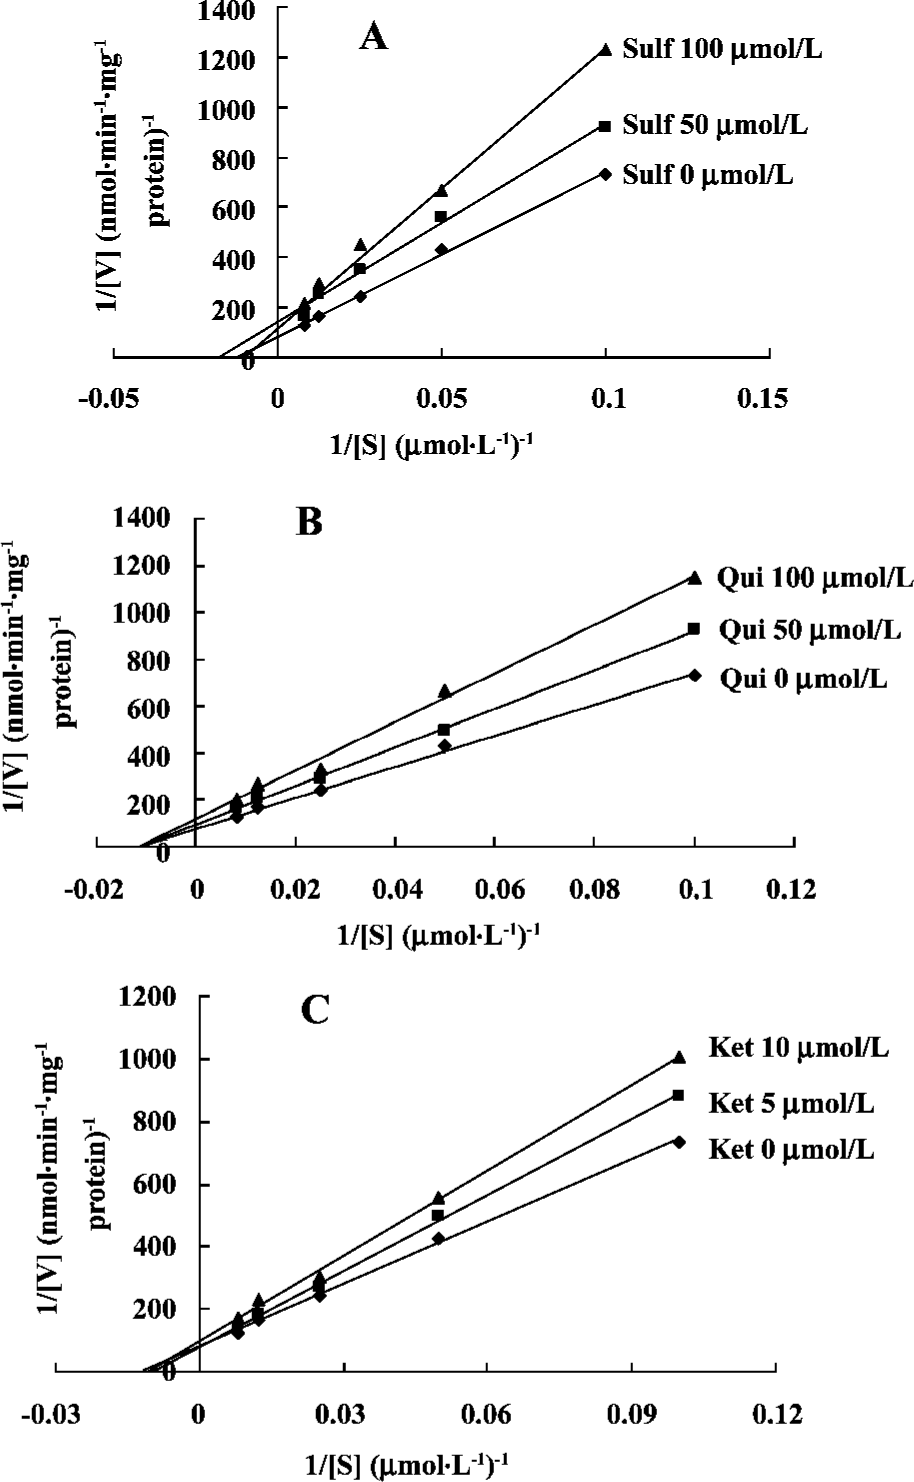
The inhibitory effects of Sulf, Qui, and Ket on PTS metabolism were derived from Lineweaver-Burk plots of PTS metabolite formation by varying the concentration of the PTS at several fixed concentrations of the inhibitor[12]. Sulf at concentrations of 0, 50, and 100 µmol/L, Qui at concentrations of 0, 50, and 100 µmol/L, or Ket at concentrations of 0, 5, and 10 µmol/L were co-incubated with PTS at concentrations ranging from 10.0 to 160.0 µmol/L. To investigate the effect of PTS on CYP isoform activity, PTS at concentrations of 0–120 µmol/L were added to the incubation mixture with CYP substrates. A single fixed concentration at approximately the Km for each substrate (20 µmol/L Phe, 100 µmol/L Tol, 20 µmol/L Dex, or 40 µmol/L Chl) was used in the incubation sample. The areas for Ace, 4-OH-Tol, Dor, 3-MM and 6-OH-Chl were used for analysis.
Results
Total CYP and microsome protein content There was no significant difference in total CYP and microsome protein content between the PTS pretreatment and blank control groups. PTS pretreatment at the investigated concentrations had little effect on rat liver CYP content (Table 1).
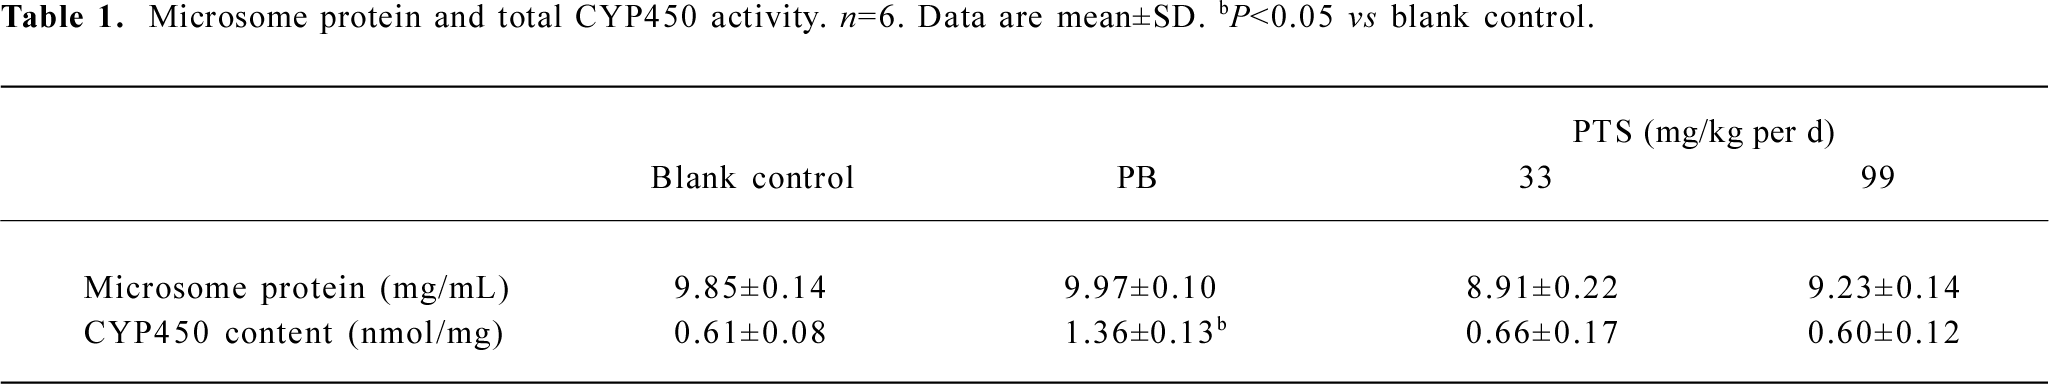
Full table
Validation of PTS assay Validation of the HPLC method developed for PTS assay was performed with 6 calibration standards ranging from 10.0–320.0 µmol/L, and 3 quality control (QC) samples (20, 40, and 80 µmol/L). Standard samples were added to the boiled microsome mixture and prepared as described earlier. The calibration curve was constructed by linear least-squares regression of standard concentrations against peak area ratio of PTS and internal standard. The calibration curve Y=0.065X+0.2265 had excellent linearity, with a correlation coefficient of 0.9996 (n=6). The average recovery for the method was 106.2%±4.5% from different concentrations. The relative standard deviations of intra-day and inter-day variation in the concentrations determined were less than 9.4%.
Mass spectrometry for PTS and its metabolite We hoped to gather more information about the metabolites and metabolism of PTS by in vitro incubation. In HPLC chroma tograms, the retention times of the PTS metabolite and PTS itself were, respectively, 3.0 min and 9.7 min. There was no interfering peak found at the same retention time for the metabolite and PTS in the chromatogram for microsomal incubation. We collected the material with a retention time of approximately 3.0 min during the HPLC separation of the PTS incubation sample. This material was analyzed by using a Finnigan LCQ Deca XP Max (Sunnyvale, CA, USA) mass spectrometer. The metabolite with [M+1] + 188>171 in the mass spectrometry could be a hydroxylated derivative(Figure 1).
Kinetics assays of PTS metabolism relative to CYP The Km and Vmax values were estimated using the Michaelis-Menten model. The Km and Vmax of the CYP-catalyzed reaction of PTS metabolism were 92.2 µmol/L and 0.0137 nmol/min per mg protein, respectively (Figure 2).
Inhibition screening of PTS metabolism PTS metabolism was inhibited by Sulf, Qui and Ket. The results indicated that CYP2C7, CYP2D1, and CYP3A2 might be responsible for the CYP-catalyzed metabolism of PTS in liver microsomes of male Wistar rats (Figure 3).
Mechanisms of inhibitors The three inhibitors (Sulf, Qui and Ket) were assessed with respect to their inhibitory mechanisms. Lineweaver-Burk plots of PTS metabolite formation in the presence of Sulf, Qui and Ket are shown. As seen in Figure 4, PTS metabolism was inhibited by both Sulf and Ket through a mixed inhibitory mechanism. Qui had a noncompetitive mechanism. Noncompetitive inhibition mainly implies that an intermediate substance hinders the release of the substrate (Figure 4).
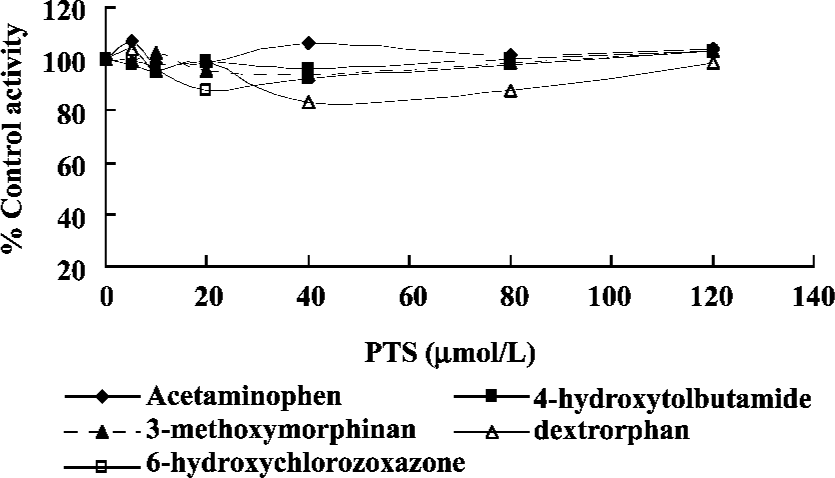
Effect of PTS on rat CYP isoform activity No significant changes were found with respect to the areas of Ace, 4-OH-Tol, Dor, 3-MM and 6-OH-Chl when the concentration of PTS changed from 0 to 120 µmol/L. This study indicated that PTS had neither an inhibitive nor an inductive effect on the CYP1A2, CYP2C7, CYP2D1, CYP3A2 and CYP2E1 reactions selected in our experiments (Figure 5).
Discussion
Acquiring metabolic information and determining the effect of an NCE on CYP are important in developing clinically safe and efficient medications[13]. Drug co-administration and individual differences in therapeutic effectiveness are common in cancer therapy. In the present article, we provide a relatively complete description of PTS metabolism involving CYP. This was a prerequisite for further toxicological risk assessment using this animal model.
In preclinical animal pharmacokinetic research, it was found that PTS could be given to rats at dosages of 33–198 mg/kg per d, for which the T1/2 was 2.90–3.48 h, and the Cmax was 29.24–151.23 mg/mL. There was one metabolite detected in the aqueous and organic phases, respectively, in urine samples. PTS might be used at higher concentrations in the clinical setting to treat different severities and types of tumors. Further experiments in human microsomes with different PTS concentrations are expected.
Because of various anti-tumor mechanisms, the anticancer drug degradation process could be very different and could have no relation with liver CYP enzymes at all. We arrived at a preliminary conclusion that CYP was responsible for PTS metabolism because of two pieces of evidence. First, inhibition screening studies showed that inhibition of the activity of CYP2C7, CYP2D1, and CYP3A2 slowed down the metabolism of PTS. Secondly, the result that CYP was responsible for PTS metabolism had also been verified by PTS metabolism research in a rat in situ liver perfusion model. In the latter experiment, there was difference in the PTS metabolism curves between the groups receiving Ket and PB pretreatment and the blank controls. The inhibitors Sulf, Qui and Ket gave us further evidence that CYP2C7, CYP2D1, and CYP3A2 might contribute to PTS rat liver metabolism. However, specific CYP isoforms and different effective inhibitors (especially for CYP3A) for screening research will be needed to verify our results.
Inhibitors of CYP2C7, CYP2D1, and CYP3A2 could slow down PTS metabolism and potentiate its activity or toxicity. Of Sulf (up to 100 µmol/L, 56.8% of control activity), Qui (up to 100 µmol/L , 65.1%), and Ket (up to 20 µmol/L , 40.1%), Ket was the most effective inhibitor of PTS metabolism. Agents that modulate CYP3A will always need to be administered with care, and the same is true for PTS administration.
PTS had no effect on phenacetin O-deethylase, tolbutamide methylhydroxylation, dextro O-demethylation, dextro N-demethylation, or chlorzoxazone 6-hydroxylation reactions, which respectively represent the activities of CYP1A2, CYP2C7, CYP2D1, CYP3A2 and CYP2E1 in vitro. Our data predict that PTS could be used relatively safely with many current drugs, and that PTS would be suitable for pharmaceutical development. PTS has a simple structure, and it could be manufactured easily and cheaply. In conclusion, studies of CYP correlations with NCE metabolism provide a firm scientific basis for the safe and effective use of drugs, personalized medicine, and drug discovery.
References
- Zhou JQ, Tang ZQ. Cytochrome P450 directed prodrug activation therapy in the research of cancer enzymology. J Chin Pharm Sci 2005;14:1-9.
- Peng SX, Barbone AG, Ritchie DM. High-throughput cytochrome P450 inhibition assays by ultrafast gradient liquid chromatography with tandem mass spectrometry using monolithic columns. Rapid Commun Mass Spectrom 2003;17:509-18.
- Afshar M, Rouini MR, Amini M. Simple chromatography method for simultaneous determination of dextromethorphan and its main metabolites in human plasma with fluorimetric detection. J Chromatogr 2004;802:317-22.
- Testino SA Jr, Patonay G. High-throughput inhibition screening of major human cytochrome P450 enzymes using an in vitro cocktail and liquid chromatography-tandem mass spectrometry. J Pharm Biomed Anal 2003;30:1459-67.
- Mimura N, Kobayashi K, Nakamura Y, Shimada N, Hosokawa M, Chiba K. Metabolism of medroxyprogesterone acetate (MPA) via CYP enzymes in vitro and effect of MPA on bleeding time in female rats in dependence on CYP activity in vivo. Life Sci 2003;73:3201-12.
- Paul LD, Springer D, Staack RF, Kraemer T, Maurer HH. Cytochrome P450 isoforms involved in rat liver microsomal metabolism of californine and protopine. Eur J Pharmacol 2004;485:69-79.
- Omura T, Sato R. The carbon monoxide-binding pigment of liver microsomes. J Biol Chem 1964;239:2379-85.
- Lowry OH, Rosebrough NJ, Farr AL, Randall J. Protein measurement with the Folin phenol reagent. J Biol Chem 1951;193:265-75.
- Liu XQ, Zhao Y, Li D, Qian ZY, Wang GJ. Metabolism and metabolic inhibition of cilnidipine in human liver microsomes. Acta Pharmacol Sin 2003;24:263-7.
- Zhou JQ, Tang ZQ. Effect of quercetin on CYP1A2,CYP2E1,CYP3A2 and its inhibition mechanism from in vitro rat liver microsomal studies. J Chin Pharm Sci 2005;14:231-6.
- Yu C, Shin YG, Kosmeder JW, Pezzuto JM, van Breemen RB. Liquid chromatography/tandem mass spectrometric determination of inhibition of human cytochrome P450 isozymes by resveratrol and resveratrol-3-sulfate. Rapid Commun Mass Spectrom 2003;17:307-13.
- Kim KA, Lee JS, Park HJ, Kim JW, Kim CJ, Shim IS, et al. Inhibition of cytochrome P450 activities by oleanolic acid and ursolic acid in human liver microsomes. Life Sci 2004;74:2769-79.
- Hu YZ, Yao TW. In vitro metabolism and inductive or inhibitive effect of DL111 on rat cytochrome P4501A enzyme. Chem Biol Inter 2004;147:109-17.