
Changes in angiopoietin expression in glomeruli involved in glomerulosclerosis in rats with daunorubicin-induced nephrosis1
Introduction
Daunorubicin (DRB), a widely used chemotherapeutic agent, has nephrotoxic side effects in the treatment of a variety of neoplasias[1]. Previous studies have demonstrated that a single intravenous injection of DRB into rats induces severe glomerular podocyte injury with massive proteinuria and focal and segmental glomerulosclerosis[2,3]. However, the mechanisms involved in this nephrotoxicity have not been fully elucidated. Podocytes express angiopoietin-1 (Ang1), which has the potential to stabilize capillary structure, promote endothelial cell survival, and regulate the permeability of glomeruli[4,5]. Hence we can speculate that podocyte injury leads to a decrease in glomerular Ang1, which may be implied in the progression of glomerular lesions. Angio-poietin-2 (Ang2) is produced by endothelial cells, as a natural antagonist of Ang1 in vivo[6], and is also stored in the Weibel-Palade bodies of endothelial cells[7]. Its secretion is stimulated by hypoxia and tumor necrosis factor-α (TNF-α)[8,9]. However, it is barely detectable in the glomeruli of normal kidneys. A recent study suggests that there is a significant increase in glomerular Ang2 expression in mice with anti-glomerular basement membrane (GBM) glomerulitis, which may contribute to glomerular damage[10]. Accordingly, we wondered whether Ang2 occurred in glomeruli following podocyte injury and if there were changes in the plasma levels of Ang1 and Ang2 that are associated with the progression of glomerular injury. We examined the plasma levels of Ang1 and Ang2 and the expression of Ang1 and Ang2 in glomeruli at sequential stages after nephropathy was induced in rats (by injection of daunorubicin), in order to explore the role of angiopoietins in progressive glomerulosclerosis.
Materials and methods
Reagents and drugs Antibodies and reagents for these determinations were obtained as follows: rabbit anti-human Ang1, Ang2 polyclonal antibodies (Santa Cruz Biotechno-logy, Inc., Santa Cruz, California, USA); rabbit anti-rat fibronectin (FN) polyclonal antibody (Dako corporation,Carpinteria, California,USA); mouse anti-rat TNF-α monoclonal antibodies (R&D Systems, Minneapolis Minnesota, USA); DRB (Pharmacia & Upjohn SPA, Milan, Italy); Pfu DNA polymerase and pGEM2Z plasmid (Promega Corpora-tion, Madison, Wisconsin, USA); SP6 and T7 RNA polymerase and DIG RNA Labeling Kit (Roche, Indianapolis, Indiana, USA); SuperPicTure-plus Immunohistochemical Kit (Zymed, San Francisco, California, USA); Plasma TNF-α Measurement Kit (Biosource, Camarillo, California USA); Ang1 and Ang2 Measurement Kit (R&D Systems, USA); and Urinary Protein Measurement Kit (Jiancheng Bioengineering Institute, Nanjing, China).
Experimental protocols Seventy male Wistar rats, weighing 180–200 g, from the Experimental Animals Centre of Tongji Medical College, Huazhong University of Science and Technology (Wuhan, China) were housed in a room with constant ambient temperature and a 12-h light-dark cycle. The rats were fed a standard laboratory diet and watered ad libitum. They were randomly divided into a normal control group (sham group; n=30) and a daunorubicin-treated group (DRB group; n=40). The rats in the DRB group were given a single intravenous injection of DRB (15 mg/kg in 0.9% NaCl) in their tails. Each rat in the control group was injected with 0.9% NaCl in their tails. Subsequently, at weekly intervals of 1, 2, 4, 6, 8, and 12 weeks, 5 rats from each group were chosen randomly and killed for the purposes of collecting their urine, blood and kidney samples. The kidneys were dissected, and small sections of the kidney tissue were fixed with 2.5% glutaraldehyde and processed for viewing in a Fei Tencai G2-12 transmission electron microscope to observe changes in the ultrastructure of the GBM and podocytes. Other sections were fixed in 4% paraformaldehyde (0.1% diethylpyrocar-bonate DEPC) overnight at 4 °C and, then, routinely embedded in paraffin for periodic acid Schiff (PAS) staining, immunostaining and in situ hybridization histochemistry.
Immunohistochemical analyses For SuperPicTure-plus immunohistochemical staining for Ang1, Ang2, TNF-α, and FN, 3-µm paraffin sections were deparaffinized in xylene, followed by 100%, 95%, and 80% ethanol washes and rehydration in 0.1 mol/L phosphate-buffered saline (PBS; pH 7.5). Sections were then incubated with 3% H2O2 for 10 min at room temperature (to quench endogenous peroxidase), and washed 3 times (2 min for each wash) with distilled water. The sections were submerged in 200 mL of 1×Antigen Retrieval Citra Buffer and heated in a microwave oven at 98 °C for 8 min for epitope recovery. This process was repeated twice. After cooling at room temperature, the sections were incubated with a protein-blocking solution consisting of PBS supplemented with 1% normal goat serum for 20 min. Then, primary antibodies (Ang1, Ang2, TNF-α, or FN antibodies) were added, followed sequentially by incubation with SuperPicTure reagent for 10 min at 37 °C. The sections were rinsed 3 times (3 min for each rinse) in 0.1 mol/L PBS, underwent color development with 0.04% diaminobenzidine (DAB) and 3% H2O2 for 8 min to eliminate any remaining peroxidase activity, and were washed 3 times (3 min for each wash) with distilled water. Finally, the sections were counterstained with hematoxylin and mounted with Universal Mount.
In negative controls, the primary antibody was substituted with PBS or with IgG fractions from rabbit serum, and yellow brown staining in cytoplasm or nuclei as the protein expression.
AngRNA probe preparation and in situ hybridization analyses Based on previously published data on synthesizing polymerase chain reaction (PCR) primers for Ang1 and Ang2[11], the sequences of the Ang1 primers were: sense 5'-GGAGCATGTGATGGAAAATTA-3' and antisense 5'-TGTG-TTTTCCCTCCATTTCTA-3'. The sequences of the Ang2 primers were: sense 5'-AAAGAGTACAAAGAGGGCTTC-3' and antisense 5'-TCCAGTAGTACCACTTGATAC-3'. The primers were amplified by PCR with Pfu DNA polymerase. The amplified PCR products were subcloned into pGEM2Z vectors, which were then amplified and purified further in Escherichia coli. Subsequently, Ang1 and Ang2 RNA probes were generated by in vitro transcription, using the DIG RNA labeling kit, and labeling of the 359 bp Ang1 and the 425 bp Ang2 probes was performed according to the instructions of Roche’s DIG RNA labeling kit
For in situ hybridization, 3-µm paraffin sections were dewaxed and rehydrated, as described earlier, and then soaked in PBS containing 0.1 mol/L glycine, for 10 min; treated with 2 µg/mL protease K, at 37 °C for 20 min. Then sections were rinsed in PBS 3 times (3 min for each rinse), dipped in 0.25% acetic anhydride for 10 min, and rinsed twice (5 min for each rinse) in 0.1 mol/L PBS. Prehybridization was performed in buffer consisting of 50% formaldehide and 0.2×standard saline citrate (SSC) at 37 °C for 30 min. The sections were covered with 20 µL of prehybridization mix in a humidified chamber at 48 °C for 2 h, followed by treatment with 30 µL of the same mixture containing the digoxigenin-labeled RNA probe (3 µg/mL). A glass cover-slip was applied and hybridization was allowed to occur at 48 °C for 12 h in a humidified chamber. After hybridization, the sections were washed twice (5 min for each wash) in 2× SSC at room temperature, washed twice (5 min for each wash) in 1×SSC at 45 °C, washed twice (5 min for each wash) in 0.5×SSC at 37 °C, washed twice (5 min for each wash) in 0.1×SSC at 37 °C, and washed 3 times (3 min for each wash) in 0.1 mol/L PBS at room temperature. The sections were blocked in 10% normal goat serum for 30 min, incubated with rabbit anti-digoxigenin antibody at 37 °C for 60 min, and washed 3 times (3 min for each wash) in 0.1 mol/L PBS at room temperature. Biotinylated goat anti-rabbit IgG was added and the sections were incubated at 37 °C for 20 min, rinsed 3 times (5 min for each wash) in 0.1 mol/L PBS, then incubated with streptAvidin biotin complex-peroxidase (SABC-POD) at 37 °C for 20 min and rinsed 4 times (5 min for each rinse) in 0.1 mol/L PBS. This was followed by chromogenic reaction with 0.05% DAB plus 0.03% H2O2, and counterstaining with hematoxylin. Finally this technique produced a brown-colored in situ hybridization signal. Sense probes were used as negative controls and sections incubated in a hybridization mix without probes served as blank controls. Other staining procedures were conducted in the same manner as described earlier.
Pathological image analysis Quantitative evaluation of renal histology was performed using an Olympus light microscope, equipped with a video camera, and a HPIAS-1000 image analysis system, at ×400 magnification. Thirty glomeruli were randomly chosen in the cortex, junction of the cortex and the medulla to be scanned blindly and to be measured for optical density mean (OPDTM) of the positive stain of the immunohistochemical and hybridization signal in each glomerulus. The OPDTM measurements were added and the mean was calculated. Fifty glomeruli were randomly chosen, as described earlier, in which glomerular area (GA) and area of the extracellular matrix (AECM) were measured. Then, the GA/AECM was calculated as the mean area of the extracellular matrix (MAECM).
Plasma Ang1, Ang2, and TNF-α levels Plasma Ang-1, Ang-2 and TNF-α levels were measured by enzyme-linked immunosorbent assay (ELISA), using commercial kits and reagents, according to the manufacturer’s instructions and the methods described previously[11].
Statistical analyses Data are expressed as mean±SD. Statistical analyses were carried out by using SPSS software (version 12.0). Statistically significant differences among groups were calculated using one-way ANOVA, followed by post hoc analysis, using the least significant difference method. Relationships between various parameters were assessed by using Pearson correlation analysis. Statistical significance was defined as P<0.05.
Results
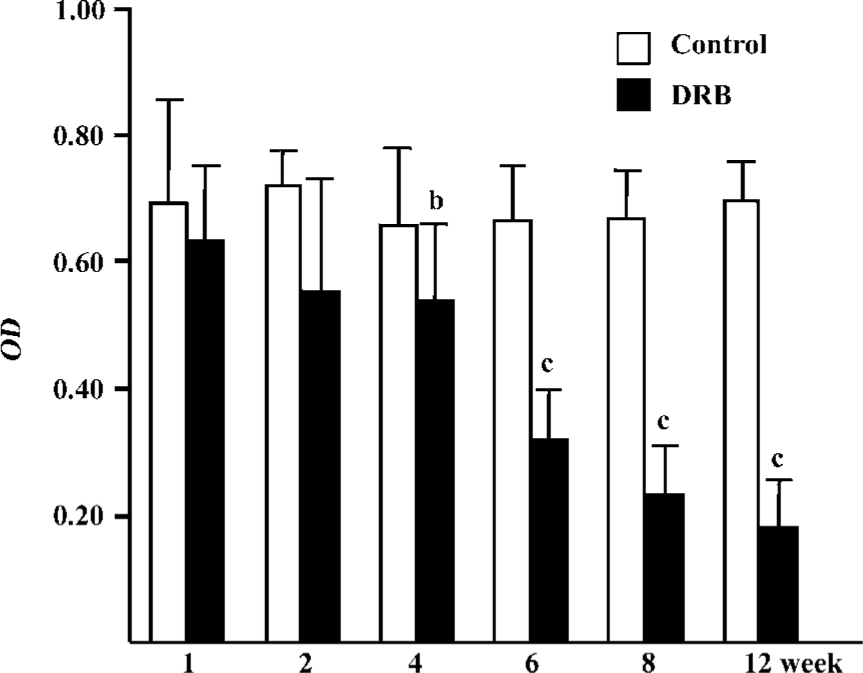
Changes in plasma Ang1, Ang2, TNF-α, and 24 h urinary protein quantitative measurements After the single intravenous injection of DRB, there was no significant difference in plasma Ang1 concentration between the control group and the DRB group. Rats in the DRB group exhibited a trend toward increase in plasma Ang2, TNF-α, and 24 h urinary protein quantitative measurements (24 h UPQM) from week 2 to week 12 (Table 1).

Full table
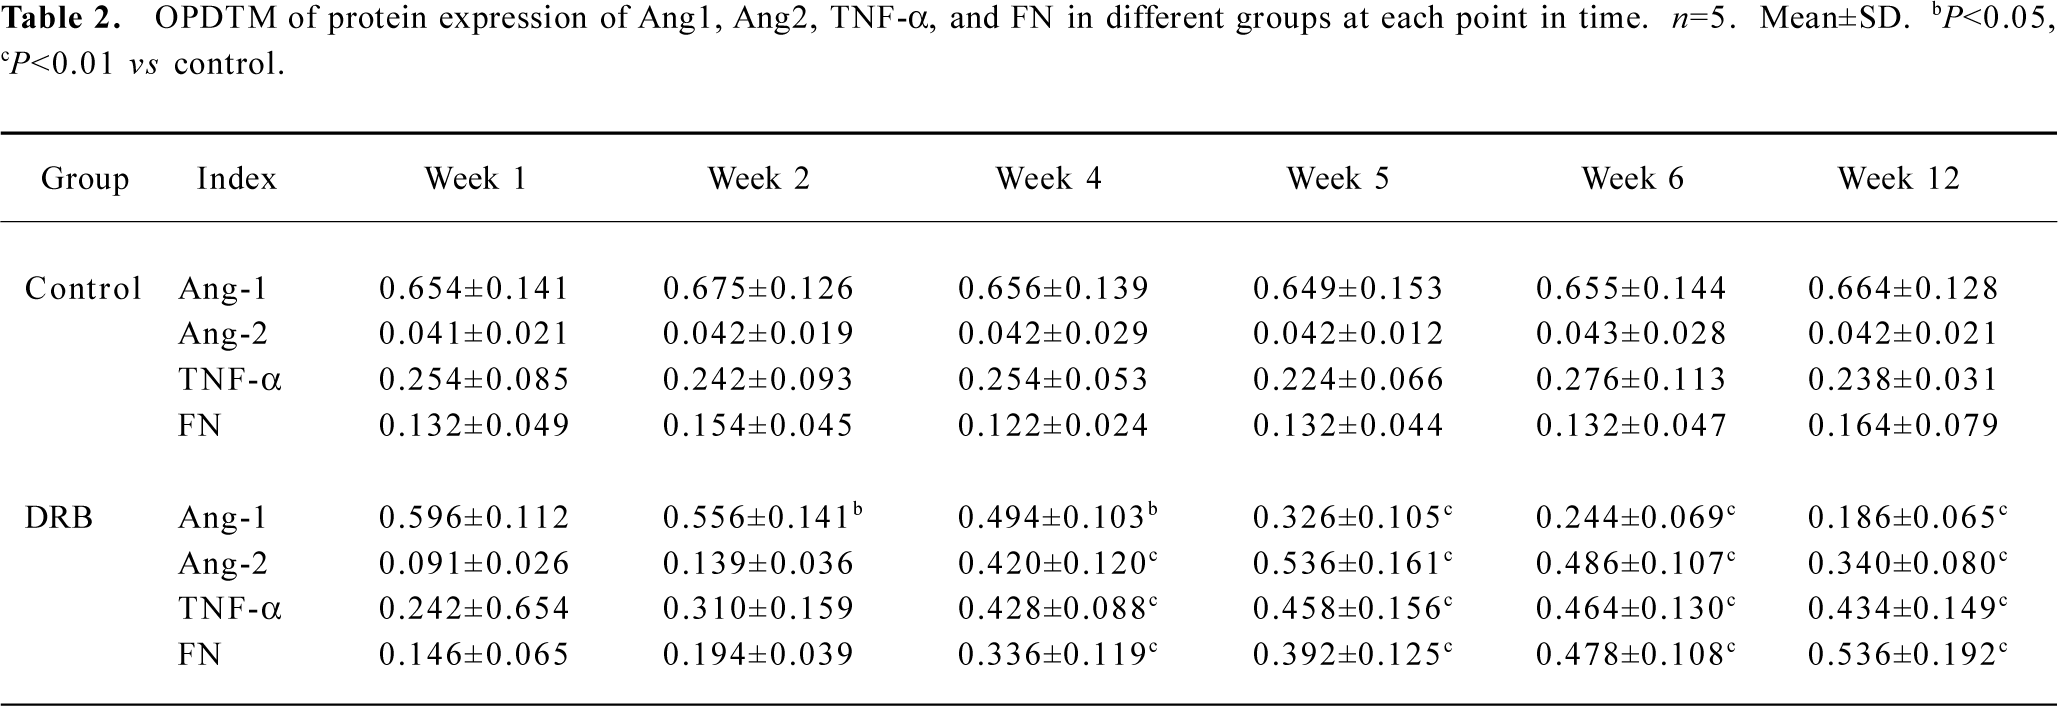
Glomerular Ang expression In situ hybridization indicated that the degree of Ang1 mRNA expression in the glomeruli of the DRB group was less than that in the control group (Figure 1). Similarly, immunostaining indicated that the degree of Ang1 protein expression in glomeruli of the DRB group was diminished in comparison with the control group (Table 2). In contrast, expression of Ang2 mRNA in glomeruli of the DRB group became gradually more intensive from week 1 to week 6, at which time it peaked (Figure 2). Ang 2 protein expression in glomeruli of the DRB Group was consistent with the trend in Ang2 mRNA expression. However Ang2 was detected at very low levels in in situ hybridization and immunostaining in the glomeruli of the control group (Table 2). Ang1 and Ang2 expression is illustrated by in situ hybridization and immunostaining of the glomeruli, as shown in Figures 3, 4.
Full table

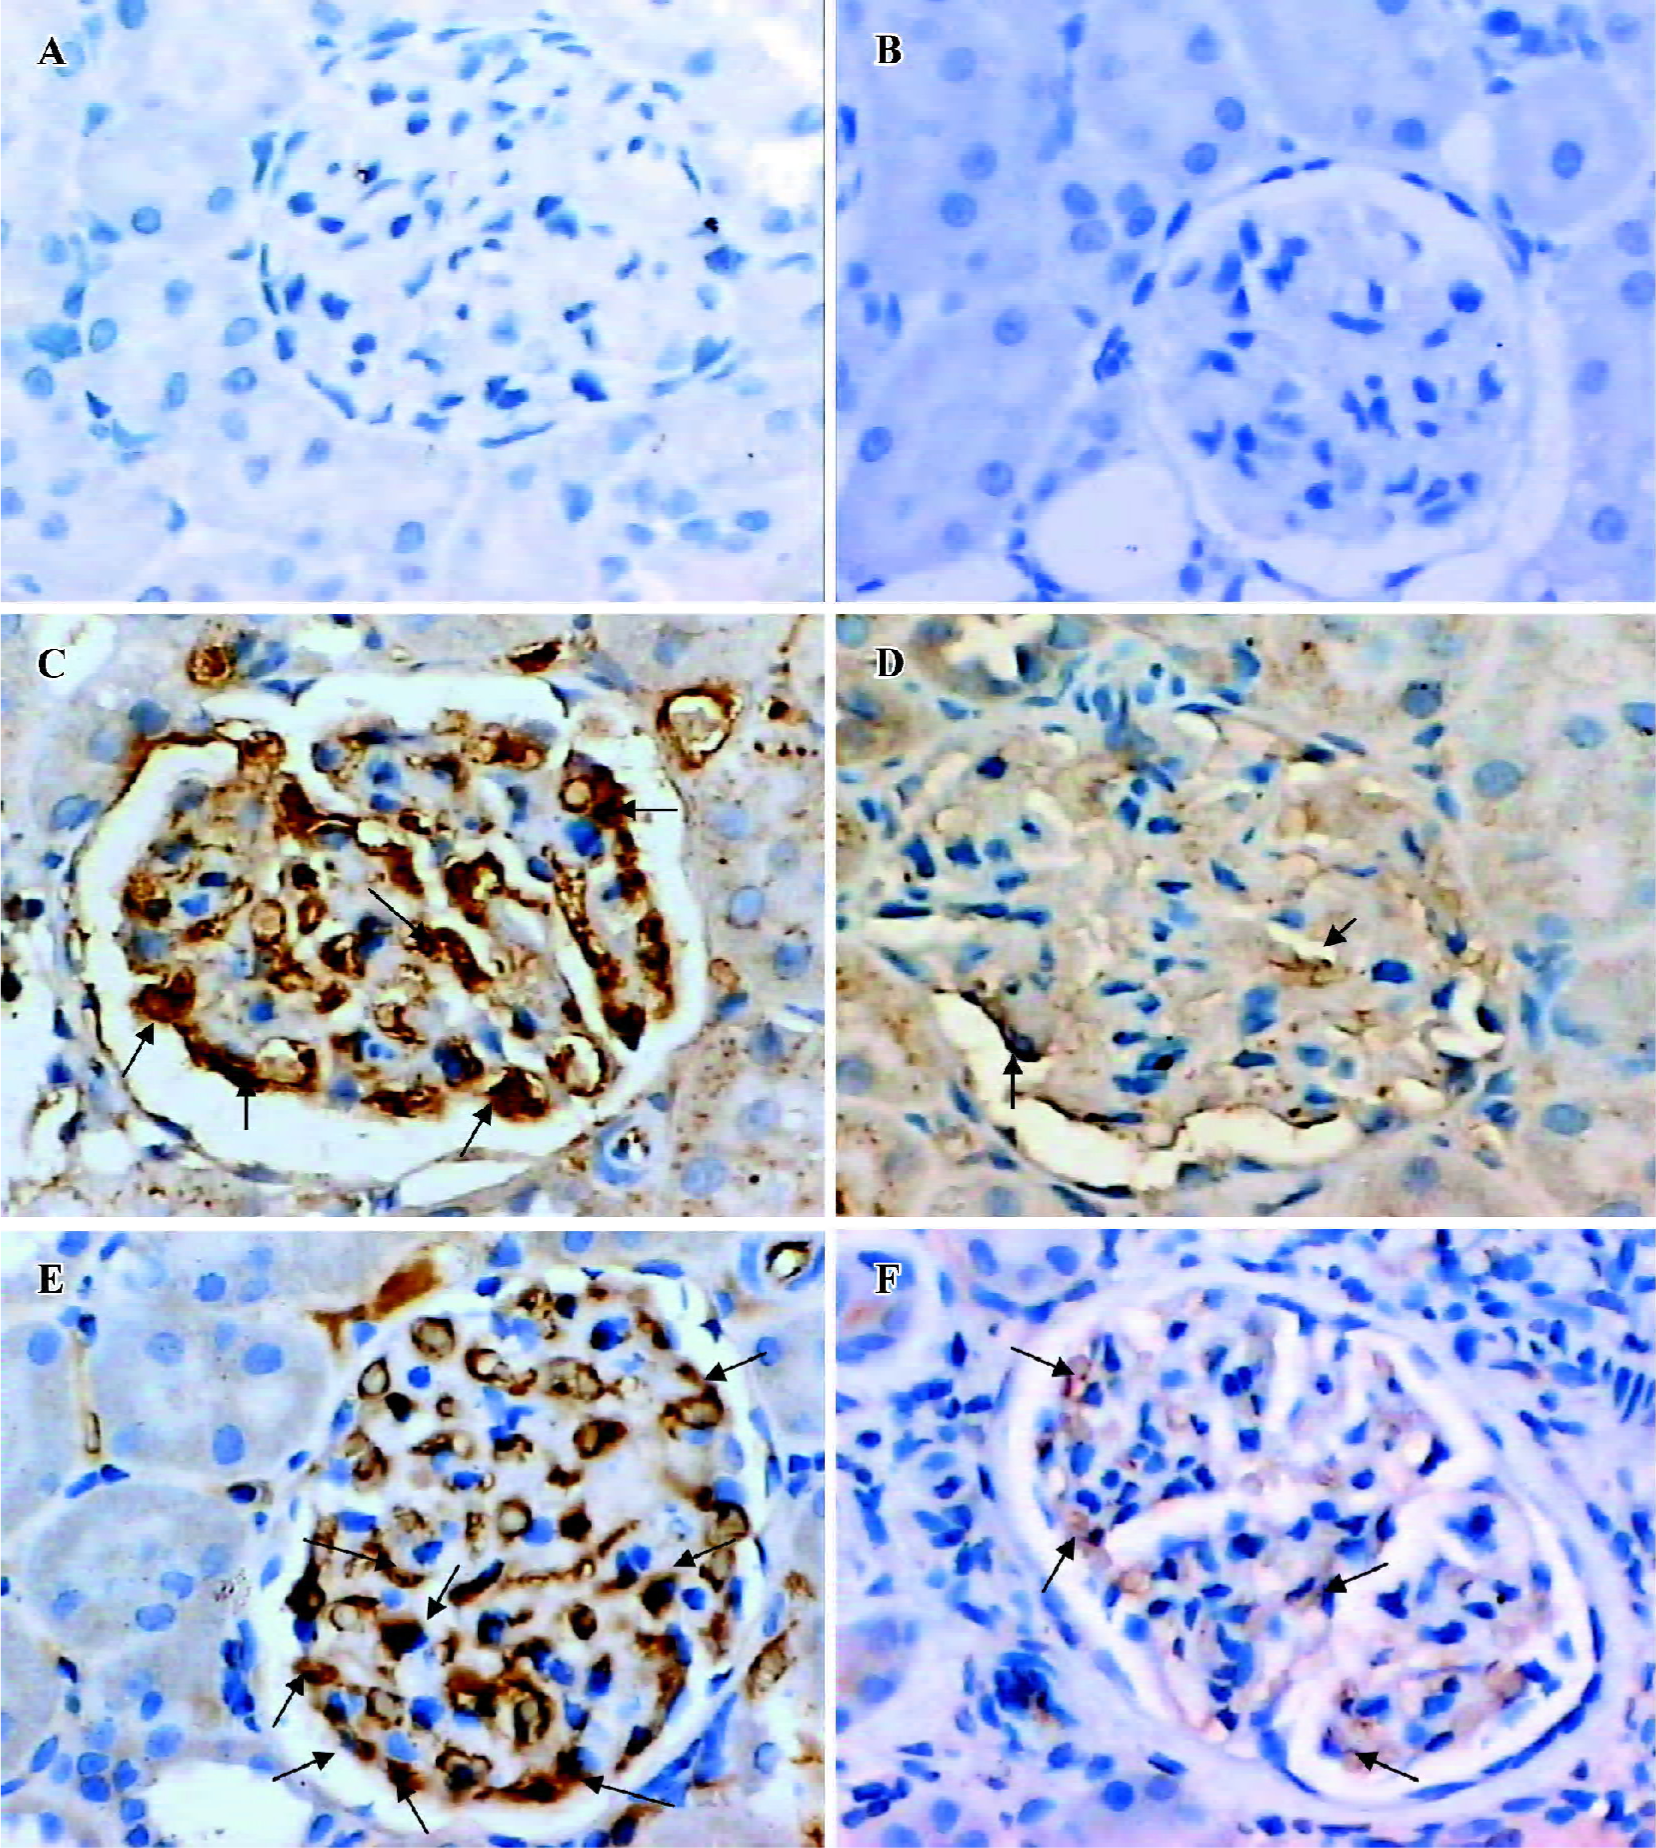

Glomerular TNF-α and FN expression Immunostaining showed that there was a trend towards an increase in TNF-α protein expression in the DRB group. Also, there was a significant difference between the DRB group and the control group from week 4 to week 12 (Table 2). Similarly, immunohistochemical staining showed an increase in expression of the FN protein, beginning in week 4, and sustained through to week 12 (Table 2). Immunostaining images of TNF-α and FN in glomeruli of the DRB and control groups are shown in Figure 5.

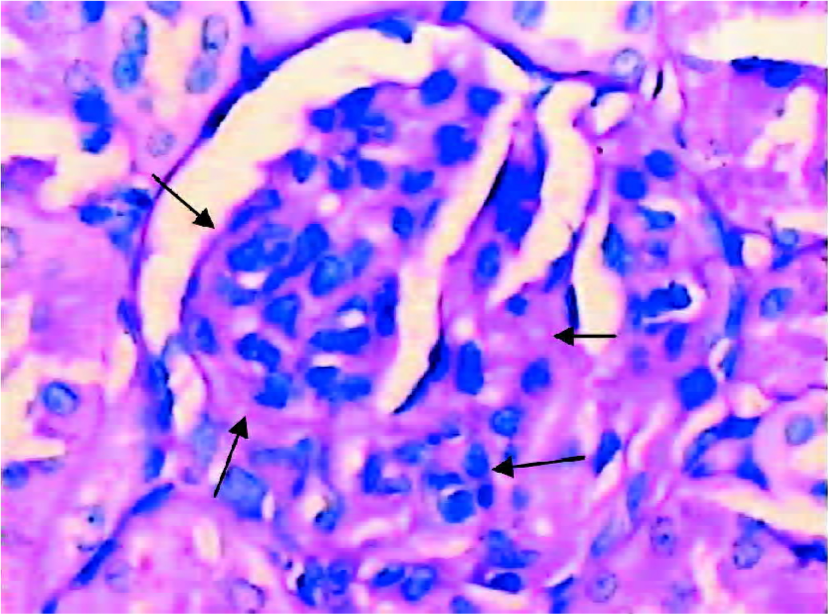
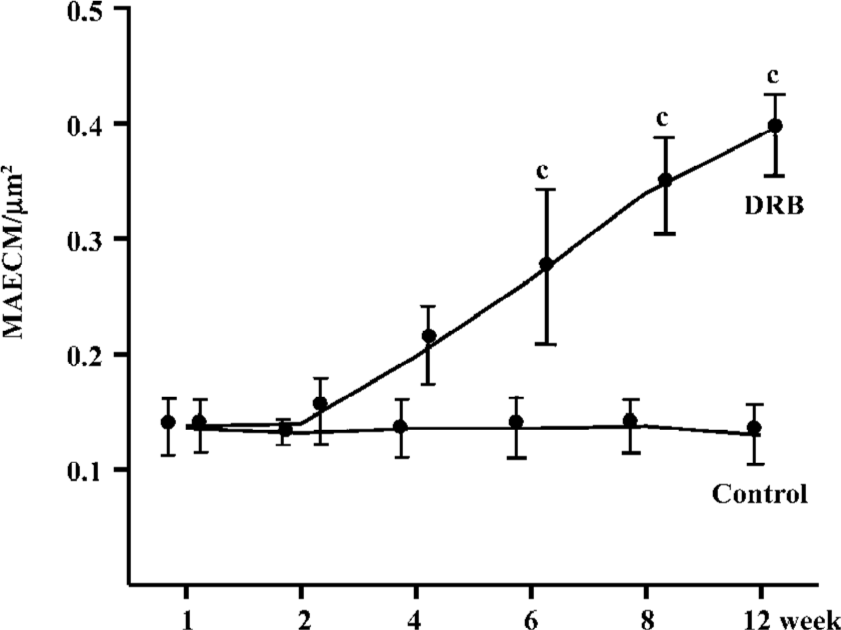
Glomerular morphological analyses PAS staining revealed no significant change in the glomeruli of the DRB group at weeks 1 and 2. The MAECM were 0.138±0.048 µm2 and 0.140±0.062 µm2 at weeks 1 and 2, respectively. At week 4, there were a few glomeruli with some widening of the mesangium, and the MAECM was 0.198±0.072 µm2. Compared with weeks 1 and 2, however, there was no significant difference. At week 6, 20% of glomeruli showed focal segmental widened mesangium, with dilatation of capillary loops. At this time, the MAECM was 0.264±0.141 µm2, which was significantly different (P<0.01) from the corresponding values at weeks 1 and 2. At week 8, 50% of the glomeruli showed focal segmental glomerulosclerosis, and the MAECM was 0.340±0.087 µm2, which was significantly higher than the MAECM at weeks 1, 2, and 4 (P<0.01). At week 12, 70% of the glomeruli showed focal segmental glomerulosclerosis, with various degrees of obliteration of capillaries and adhesion to Bowman’s capsules (Figure 6,7) or collapse of capillaries. Also, some of the glomeruli had global sclerosis, and the MAECM was 0.390±0.074 µm2, which was significantly higher than the MAECM in weeks 1, 2, 4, and 6 (P<0.01). There was significant difference between the DRB group and the control group’s MAECM in weeks 6, 8, and 12 (Figure 7). Glomerular capillary loops of the control group were well-defined and thin and the numbers of endothelial and mesangial cells were normal.
Electron microscopy showed partial effacement of foot processes in the DRB group at week 1. Foot process effacement was widespread at week 4 (Figure 8), with some glomeruli showing collapse of capillaries, microvillous transformation of podocytes, and podocyte separation from GBM. In the control group the glomeruli were normal.

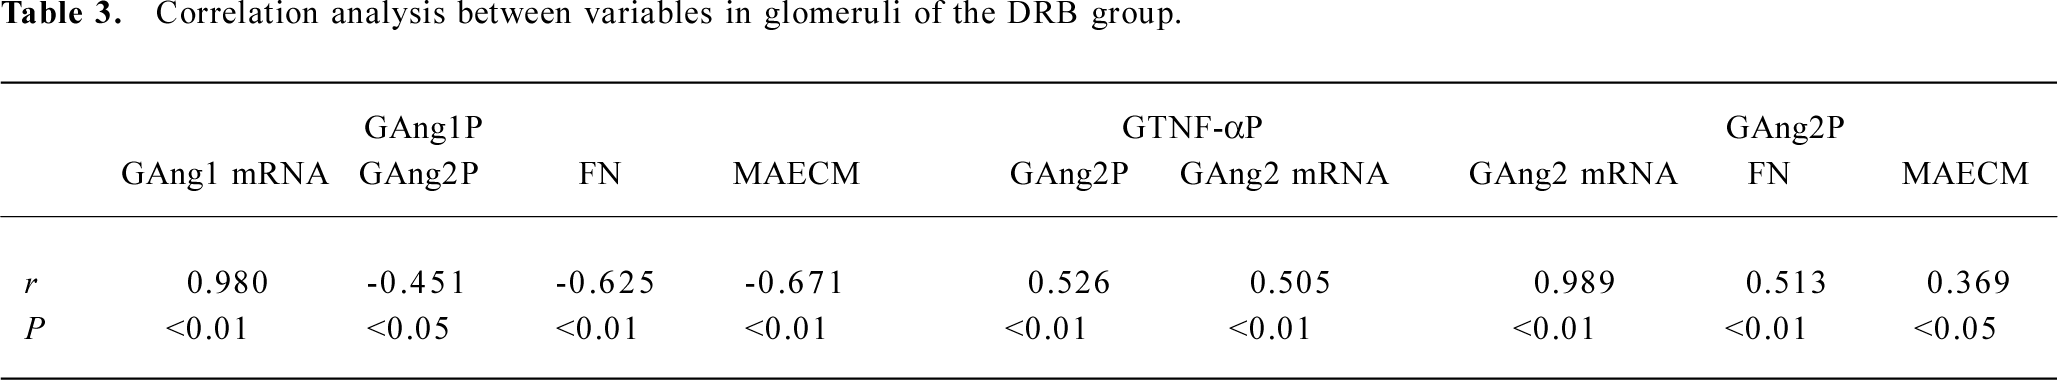
Correlation analysis of variables in the DRB group In the DRB group, there was significant positive correlation between plasma Ang2 and 24 h UPQM (r=0.390, P<0.05), but no correlation between plasma Ang2 and glomerular Ang2 expression. There was a significant positive correlation between plasma TNF-α and glomerular Ang2 mRNA (GAng2 mRNA) expression (r=0.451, P<0.05), and Ang2 protein (GAng2P) expression (r=0.441, P<0.05). However, there was a negative correlation between glomerular Ang1 mRNA (GAng1 mRNA) expression and 24 h UPQM (r=-0.402, P<0.05). Similarly, glomerular Ang1 protein (GAng1P) expression was negatively correlated with 24 h UPQM (r=-0.419, P<0.05). In comparison, there was significant positive correlation between GAng2 mRNA expression and 24 h UPQM (r=0.704, P<0.01). GAng2P expression was also positively correlated with 24 h UPQM (r=0.732, P<0.01). Correlations between glomeruli variables are shown in Table 3.
Full table
Discussion
In the present study, after DRB was administered, ongoing downregulation of Ang1 expression corresponded to the progression of podocyte injury. This suggests that it was podocyte injury that initiated the downregulation of Ang1 expression in glomeruli. Indeed, previous reports have indicated that podocytes are a principal source of Ang1 in glomeruli[4,5,13]. However, there were no significant differences between the DRB group and the control group throughout the experiment, which implies that plasma Ang1 levels may be regulated by multiple factors and involve more complex mechanisms. One explanation for this is that Ang1 can be produced not only by glomerular podocytes, but also by diverse cells outside glomeruli in the body, including mesenchymal cells, vascular smooth muscle cells and periendothelial cells of the capillaries[14]. Thus, local damage in glomeruli may not be enough to affect plasma Ang1 levels. As mentioned earlier, expression of Ang1 by normal glomeruli plays an important role in regulating the permeability of the glomerular filtration barrier. Ang1 increases transendothelial electrical resistance of monolayers that cultured glomerular endothelial cells form on porous supports, and leads to a decrease in protein passage[4,5]. Similarly, Ang1 is critical for stabilizing the interaction of endothelial cells with the surrounding matrix. Ang1 not only supports the localization of proteins such as platelet endothelial cell adhesion molecule-1 (PECAM-1) in junctions between endothelial cells and decreases the phosphorylation of PECAM-1 and vascular endothelial cadherin, but also strengthens these junctions[15]. Ang1 can inhibit an increase in permeability responses to inflammation, and also inhibits the leakage of plasma components into the tissues[16]. Therefore, a decrease in podocyte-derived Ang1 may contribute to the development of proteinuria during glomerular diseases, as the results of our study show that there is negative correlation between the expression of Ang1 and 24 h UPQM. In contrast to Ang1, Ang2 plays a role in increasing vascular permeability. According to a recent report, injection of human recombinant Ang2 can induce tissue edema, which is related to an increase in microvascular permeability[17]. This may explain why our findings show that plasma Ang2 levels and expression of glomerular Ang2 correlate with 24 h UPQM. Elevated levels of plasma Ang2 and glomerular Ang2 expression may accordingly contribute to protein permeability through the basement membrane. Also, plasma Ang2 does not correlate with glomerular Ang2 mRNA or protein levels. This suggests that local expression of Ang2 in glomeruli is independent of its plasma level, whereas plasma Ang2 may be derived from the endothelial cells. However, downregulation of Ang1 expression may weaken its inhibiting effect on Ang2 and facilitate Ang2 expression in glomerular endothelial cells and mesangial cells.
Previous data have demonstrated that macrovascular endothelial cells can produce TNF-α. Macrophages, isolated from nephritic glomeruli, are known producers of TNF-α. And glomerular mesangial cells and epithelial cells also have the capacity to produce TNF-α in vitro. Increases of TNF-α in plasma levels and upregulation of TNF-α expression in glomeruli are involved in the development and progression of numerous human and experimental glomerular injuries[18,19]. In the present study we found that the plasma level of TNF-α and its expression in glomerular tufts were prominent, and both correlated with Ang2 expression in glomeruli. A previous study indicated that TNF-α upregulated Ang2 mRNA expression in endothelial cells in a time- and dose-dependent manner[9]. Thus, the upregulation of Ang2 expression in glomeruli may result from the stimulation of TNF-α; however, further research would be required to establish this as fact.
Accumulation of FN in glomeruli is a hallmark of progressive glomerulosclerosis. Increases in Ang2 in mesangial cells results in expansion of the endothelial cell matrix and disruption of capillary structure[20]. Our data indicate that expression of Ang2 protein positively correlates with expression of FN protein and MAECM; however, expression of Ang1 protein inversely correlates with expression of FN protein and MAECM in the DRB group. Therefore, these findings suggest that elevated expression of Ang2 may, in turn, upregulate FN expression and thus involve an accumulation of ECM in glomeruli. In addition, downregulation of Ang1 expression may contribute to the effect of Ang2 upon FN.
In summary, during DRB-induced glomerulosclerosis, podocyte injury led to a shift in the balance of Ang1 and Ang2 in glomeruli. Increased TNF-α in plasma and glomeruli may upregulate Ang2 expression in glomeruli. Elevated Ang2 in both plasma and glomeruli may mediate protein permeability through the glomerular filtration barrier. Moreover, local expression of Ang2 may facilitate the progress of glomerulosclerosis by upregulating the component expression of ECM. Further experiments will be required to substantiate these hypotheses.
Acknowledgments
We wish to thank Juan NI, Yang GUAN, and Can-rong NI for their outstanding technical assistance.
References
- Dziegiel P, Suder E, Surowiak P, Jethon Z, Rabczynski J, Januszewska L, et al. Role of exogenous melatonin in reducing the nephrotoxic effect of daunorubicin and doxorubicin in the rat. J Pineal Res 2002;33:95-100.
- Kubosawa H, Akikusa B, Kondo Y. Daunomycin-induced nephropathy in rats. Acta Pathol Jpn 1985;35:109-23.
- Ohtake T, Kimura M, Takemura H, Hishida A. Effects of dietary lipids on daunomycin-induced nephropathy in mice: comparison between cod liver oil and soybean oil. Lipids 2002;37:359-66.
- Satchell SC, Mathieson PW. Angiopoietins: microvascular modulators with potential roles in glomerular pathophysiology. J Nephrol 2003;16:168-78.
- Satchell SC, Anderson KL, Mathieson PW. Angiopoietin 1 and vascular endothelial growth factor modulate human glomerular endothelial cell barrier properties. J Am Soc Nephrol 2004;15:566-74.
- Maisonpierre PC, Suri C, Jones PF, Papadopoulos N, Daly TJ, Davis S, et al. Angiopoietin-2, a natural antagonist for Tie2 that disrupts in vivo angiogenesis. Science 1997;277:55-60.
- Fiedler U, Scharpfenecker M, Koidl S, Hegen A, Grunow V, Schmidt JM, et al. The Tie-2 ligand angiopoietin-2 is stored in and rapidly released upon stimulation from endothelial cell Weibel-Palade bodies. Blood 2004;103:4150-6.
- Mandriota SJ, Pepper MS. Regulation of angiopoietin-2 mRNA levels in bovine microvascular endothelial cells by cytokines and hypoxia. Circ Res 1998;83:852-9.
- Kim I, Kim JH, Ryu YS, Liu M, Koh GY. Tumor necrosis factor-alpha upregulates angiopoietin-2 in human umbilical vein endothelial cells. Biochem Biophys Res Commun 2000;269:361-5.
- Yuan HT, Tipping PG, Li XZ, Long DA, Woolf AS. Angiopoietin correlates with glomerular capillary loss in anti-glomerular basement membrane glomerulonephritis. Kidney Int 2002;61:2078-89.
- Pichiule P, LaManna JC. Angiopoietin-2 and rat brain capillary remodeling during adaptation and deadaptation to prolonged mild hypoxia. J Appl Physiol 2002;93:1131-9.
- Lim HS, Blann AD, Chong AY, Freestone B, Lip GY. Vascular endothelial growth factor, angiopoietin-1, and angiopoietin-2 in diabetes: implications for cardiovascular risk and effects of multifactorial intervention. Diabetes Care 2004;27:2918-24.
- Yuan HT, Suri C, Yancopoulos GD, Woolf AS. Expression of angiopoietin-1, angiopoietin-2, and the Tie-2 receptor tyrosine kinase during mouse kidney maturation. J Am Soc Nephrol 1999;10:1722-36.
- Satchell SC, Harper SJ, Mathieson PW. Angiopoietin-1 is normally expressed by periendothelial cells. Thromb Haemost 2001;86:1597-8.
- Gamble JR, Drew J, Trezise L, Underwood A, Parsons M, Kasminkas L, et al. Angiopoietin-1 is an antipermeability and anti-inflammatory agent in vitro and targets cell junctions. Circ Res 2000;87:603-7.
- Thurston G, Rudge JS, Ioffe E, Zhou H, Ross L, Croll SD, et al. Angiopoietin-1 protects the adult vasculature against plasma leakage. Nat Med 2000;6:460-3.
- Haggstrom Rudolfsson S, Johansson A, Franck Lissbrant I, Wikstrom P, Bergh A. Localized expression of angiopoietin 1 and 2 may explain unique characteristics of the rat testicular microvasculature. Biol Reprod 2003;69:1231-7.
- Ha TS. The role of tumor necrosis factor-alpha in Henoch-Scho-nlein purpura. Pediatr Nephrol 2005;20:149-53.
- Timoshanko JR, Sedgwick JD, Holdsworth SR, Tipping PG. Intrinsic renal cells are the major source of tumor necrosis factor contributing to renal injury in murine crescentic glomerulone-phritis. J Am Soc Nephrol 2003;14:1785-93.
- Singh AK, Gudehithlu KP, Pegoraro AA, Singh GK, Basheerudin K, Robey RB, et al. Vascular factors altered in glucose-treated mesangial cells and diabetic glomeruli. Changes in vascular factors impair endothelial cell growth and matrix. Lab Invest 2004;84:597-606.