
Mutation trend of hemagglutinin of influenza A virus: a review from a computational mutation viewpoint
Introduction
Influenza A viruses have been responsible for four pandemics of severe human respiratory disease over the last century, resulting in tens of thousands of deaths all over the world[1–5]. Since 1997, avian influenza virus infections in poultry have taken on new significance, with increasing numbers of cases involving bird-to-human transmission and the resulting production of clinically severe and fatal human infections[6–8]. At present, two out of three general conditions for the onset of a pandemic have been met; namely, the emergence of a new virus and its ability to replicate in humans causing serious illness. Should the virus achieve efficient human-to-human transmission, the next influenza pandemic might occur[9].
By accumulating point mutations (genetic drift), the influenza A viruses change their antigenic properties mainly in the RNA genes, which code for ten proteins[10]. Hemagglutinin is one of the antigens for neutralizing antibodies and is involved in the binding of virus particles to receptors on host cells[11,12]. It plays an important role in the propagation of the virus and in the infection of the host[13,14]. There are two mechanisms to explain the host-mediated variation of influenza A viruses. The first mechanism is the pressure of the antibody[15]. The second is the selective pressure for the appearance of the host cell variant with altered receptor binding specificities[16].
The sequence analysis is widely used to estimate the mutations of influenza viruses[17–20]. Other approaches have been used to study the mutations of influenza viruses, such as the model of protein evolution[21], the mathematical model capturing both realistic epidemiological dynamics and viral evolution at the sequence level[22], the travelling waves in a one-dimensional model[23], and so on.
From 1999 to 2002, we have developed two computational mutation approaches to analyze the protein primary structure, which include (i) the calculation of predictable and unpredictable portions of amino-acid pairs in a protein[24–38], and (ii) the calculation of amino-acid distribution rank in a protein[39–43]. We reviewed these approaches and their implications in 2002[44] (Table 1).
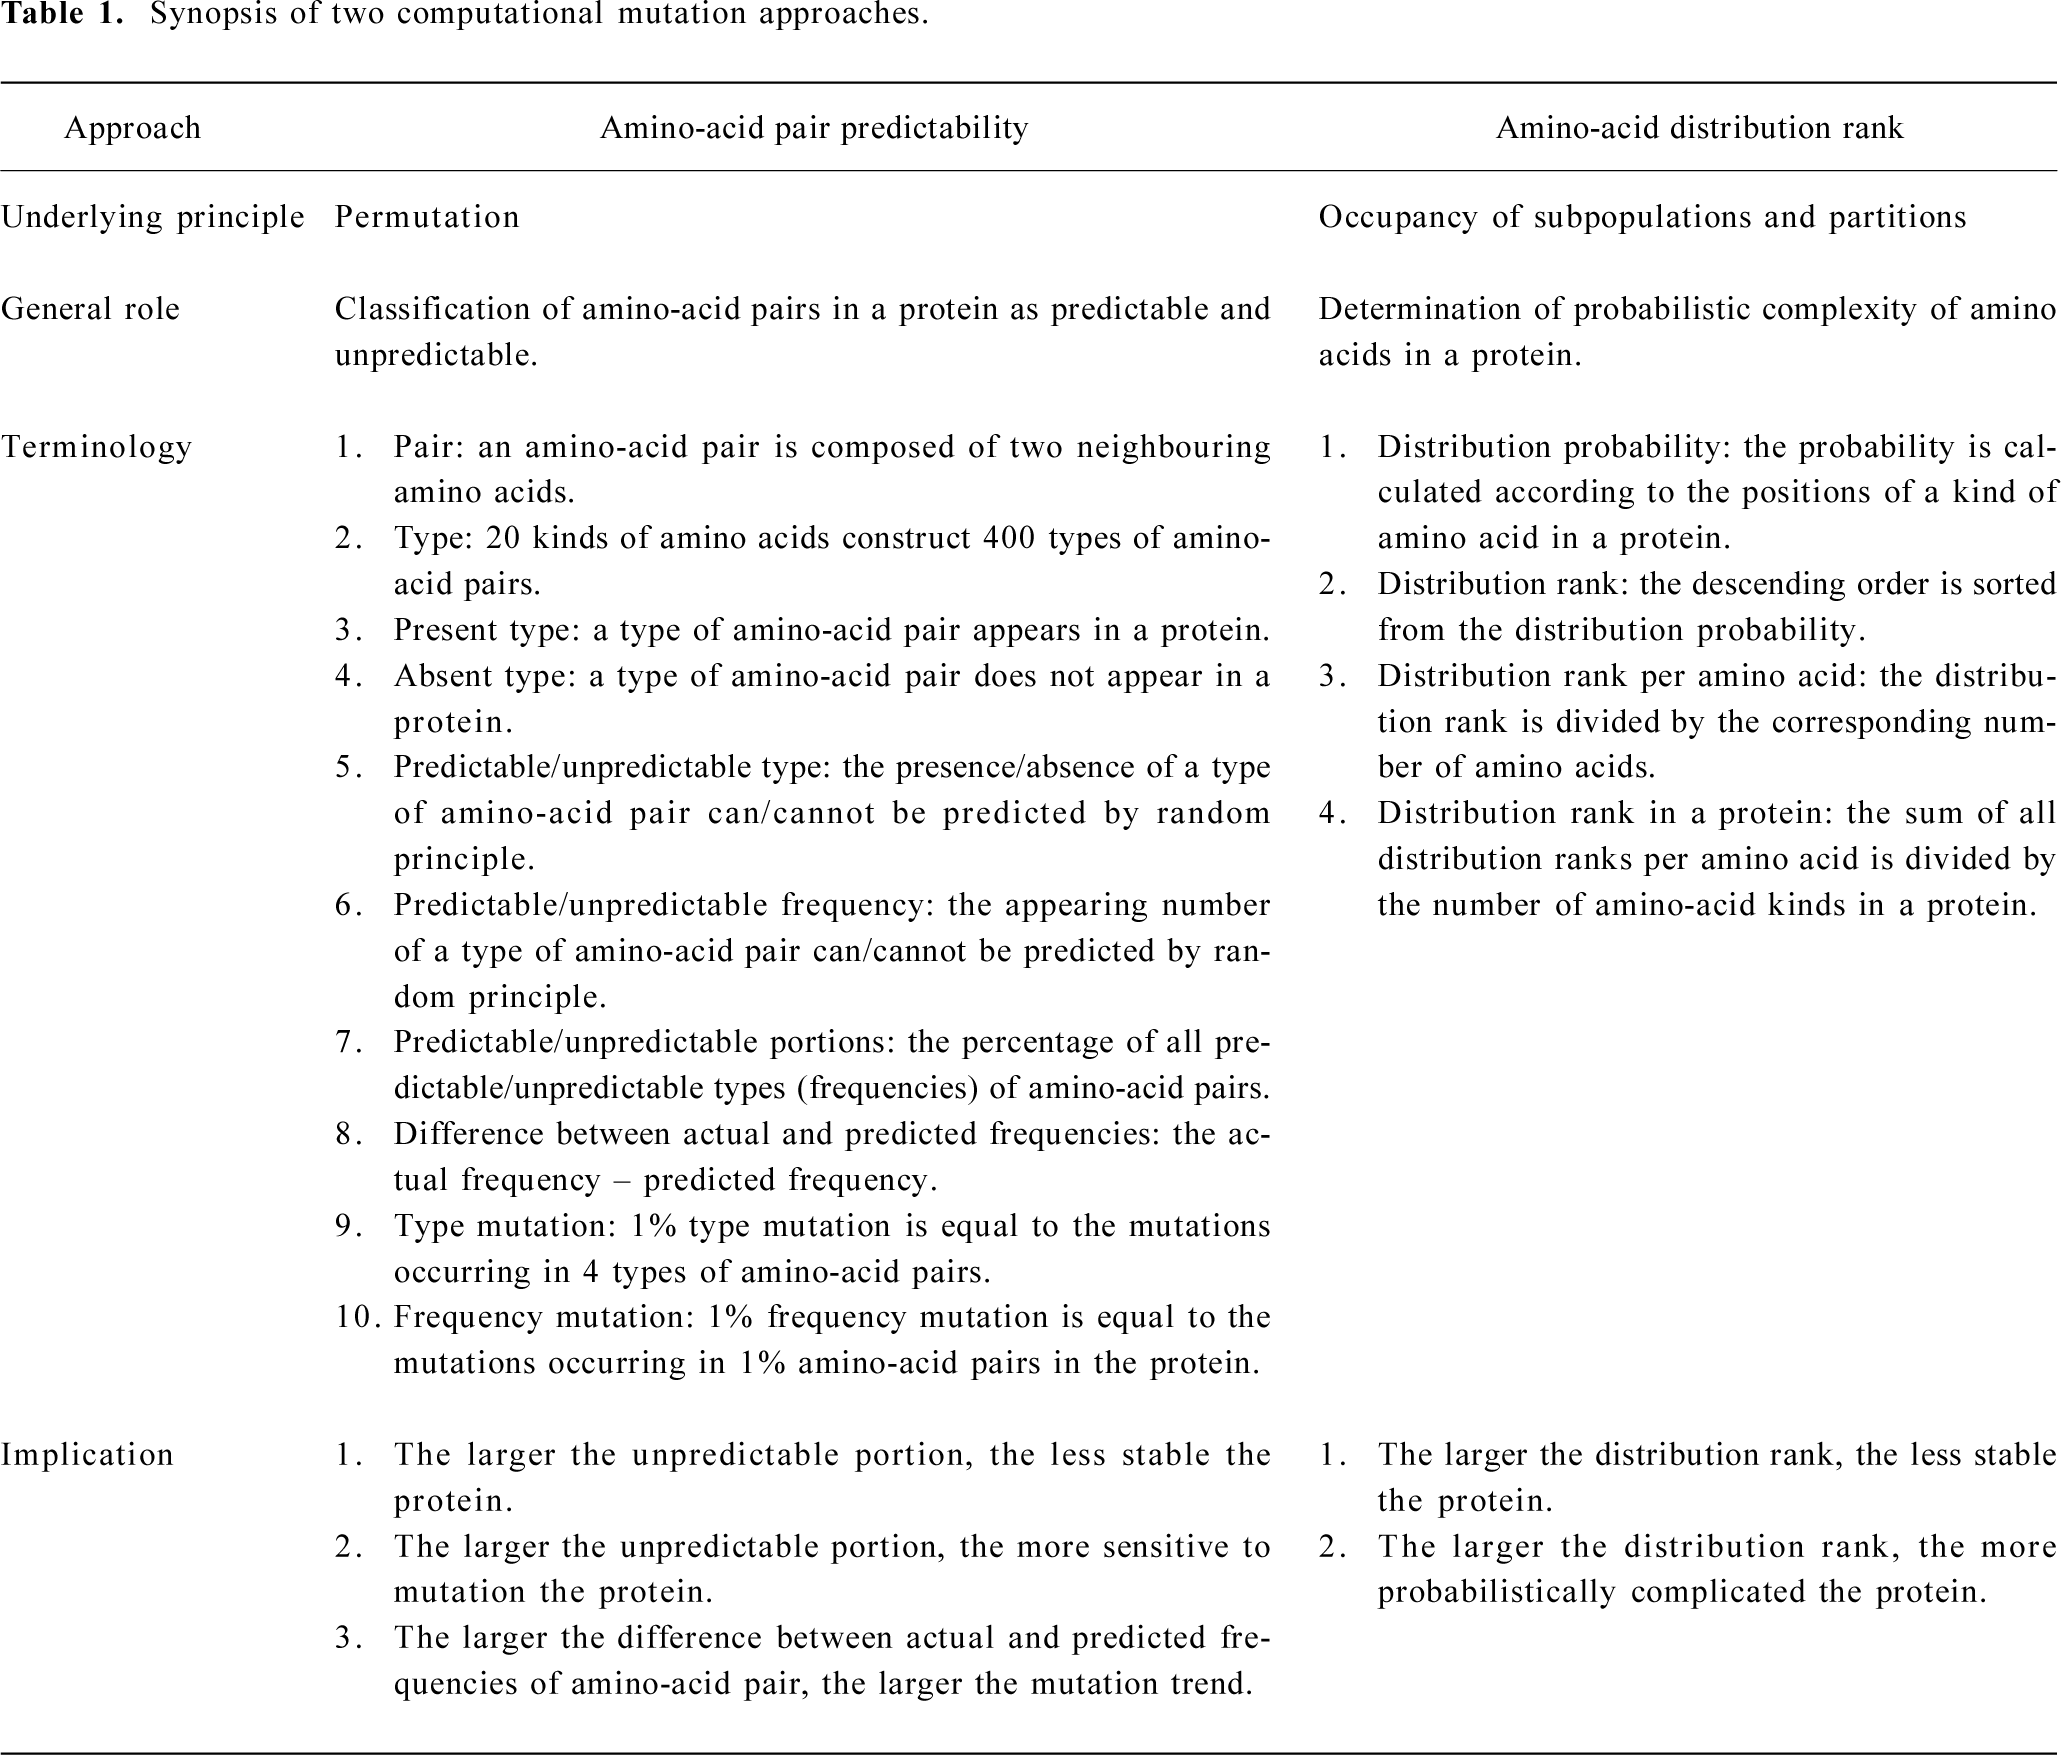
Full table
Since then, we have mainly been applying these approaches to analyze mutations in different proteins. One of the advantages of our approaches is that we can use a single value as a numerical measure to represent a protein, and then compare different proteins among a protein family[45–49], evaluate the mutation effect on proteins[50–63], reveal the mutation trend in proteins[50–65], calculate the mutation periodicity[66,67], and trace the mutation process along the time course[66,67]. In this review we summarise our findings and their implications for mutation features of influenza A virus hemagglutinins in combination with some newly available data.
Historical trend of hemagglutinin mutations
With our first approach (Appendix), we mainly use the unpredictable portion of amino-acid pairs to study the historical trend of hemagglutinin mutations because the unpredictable portion is not engineered by randomness and is deliberately constructed. Also it can present precisely a hemagglutinin with a single value, which is an unambiguous record of hemagglutinin evolutionary process as we can view each hemagglutinin as a sample from its evolution.
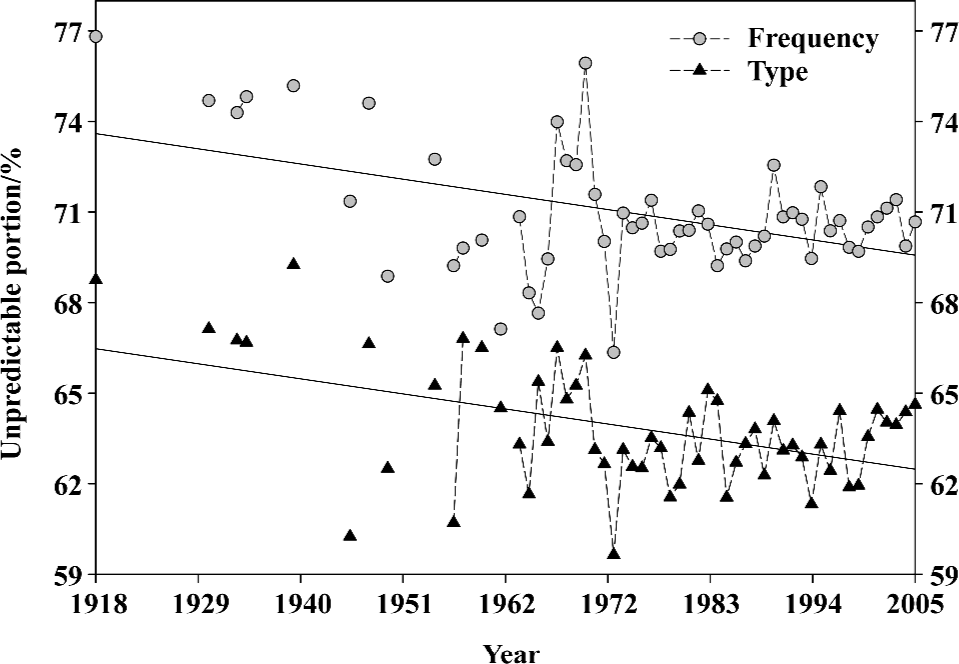
Figure 1 displays the general mutation trend of influenza A virus hemagglutinins from 1918 to 2005 using the unpredictable type and frequency of amino-acid pairs. Each symbol represents the mean value of unpredictable portion of all full-length hemagglutinins in the given year. Several points can be drawn in Figure 1: (i) Two regressed lines indicate that the unpredictable portions of amino-acid pairs are decreasing over time; that is, the hemagglutinins are structurally becoming more stable and less sensitive to mutation. (ii) Any spike in fluctuated unpredictable portions suggests that the hemagglutinin has experienced mutations at some time point, which may result in the influenza pandemic/epidemic. (iii) The statistical means and standard deviations for these data are 63.32%±3.28% for unpredictable types and 70.46%±2.78% for unpredictable frequencies, thus their standard deviations correspond to around 13 type mutations (3.28%/0.25%) and 15 frequency mutations (2.78%/0.18%)[66].
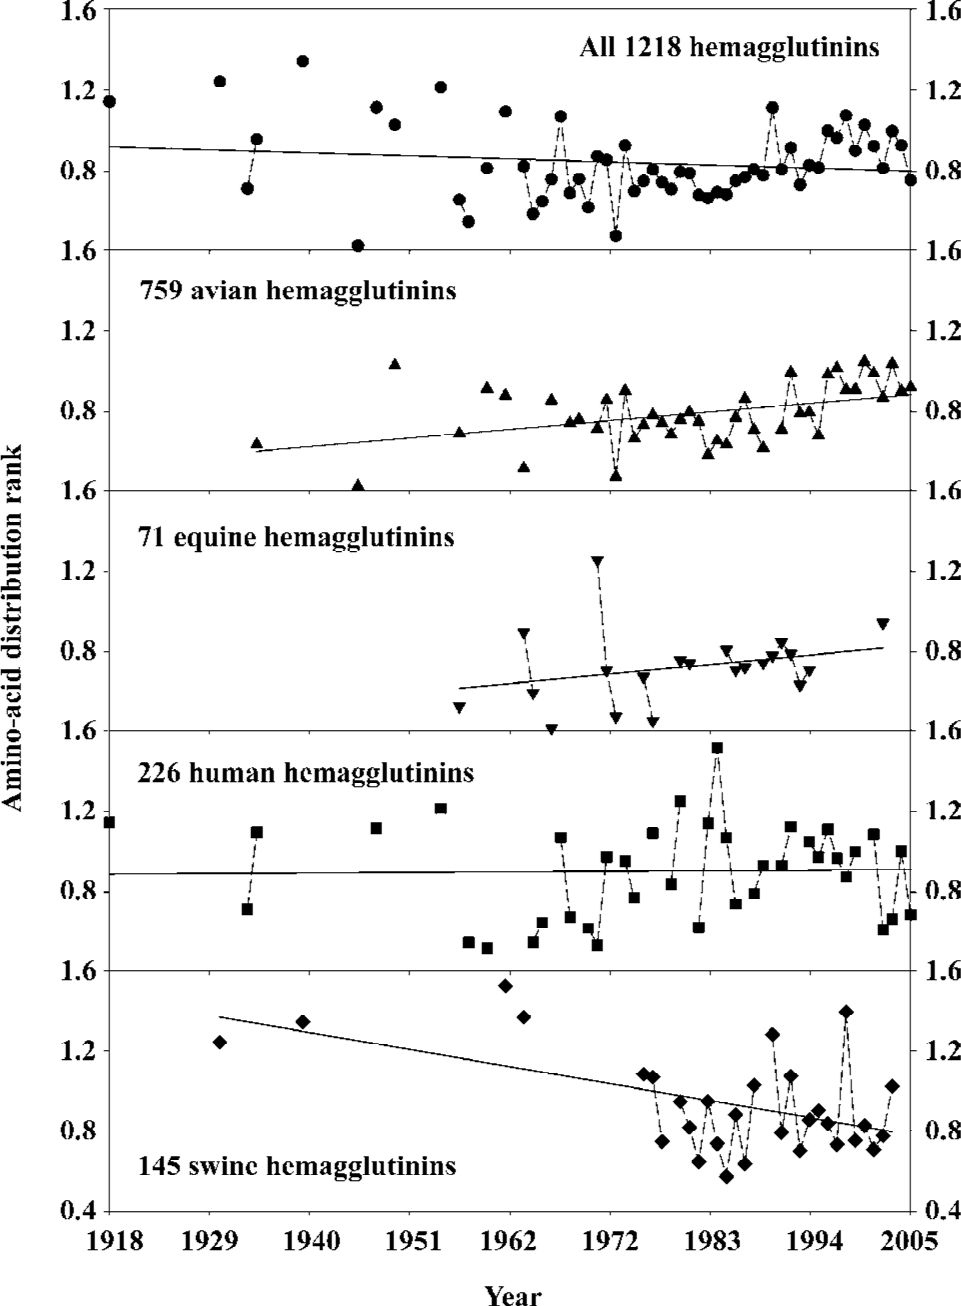
With our second approach (Appendix) and similar rationale, we use the amino-acid distribution rank to study the historical trend in hemagglutinin mutations. Figure 2 shows the general mutation trend of influenza A virus hemagglutinins from 1918 to 2005 using the amino-acid distribution rank. The regressed lines indicate the trend of the amino-acid distribution rank with respect to different species over time. This measure is quite stable for the human hemagglutinins, which suggests that the functional clusters in human hemagglutinins are relatively stable over time because any permanent re-distribution of amino acids would lead to the change in its regressed line. On the other hand, the amino-acid distribution rank increases in avian and equine hemagglutinins and decreases in swine hemagglutinins over time, which indicates that these hemagglutinins have experienced the re-distribution of amino acids. As a result, the function of these hemagglutinins has either increased or decreased over this period of time; that is, the hemagglutinin structure of influenza A viruses becomes more probabilistically complicated for avian and equine, but less complicated for swine[67].
Periodicity of hemagglutinin mutations in the past
The fluctuated data in Figures 1 and 2 imply that there may be some kind of periodicity in mutation sensitivity of influenza A virus hemagglutinins. Figure 3 displays the periodicity obtained from 1963 to 2005 using the fast Fourier transform (Appendix), where each stick represents a periodicity and the stick height is the magnitude of change with respect to unpredictable type/frequency of amino-acid pairs and amino-acid distribution rank. For example, the first prominent peak in the unpredictable type of amino-acid pair is located at 2.3 years/cycle with the height of 2.24%, which means the hemagglutinins would experience 9 type mutations (2.24%/0.25%=8.96, Appendix) at an interval of 2.3 years. This observation is different from the findings in our previous study[66], where we found 5 type mutations based on the data from 1971 to 2004. This difference, of course, results from different databases as more data are documented herein, however it further supports that the number of hemagglutinin mutations is indeed decreasing over time.
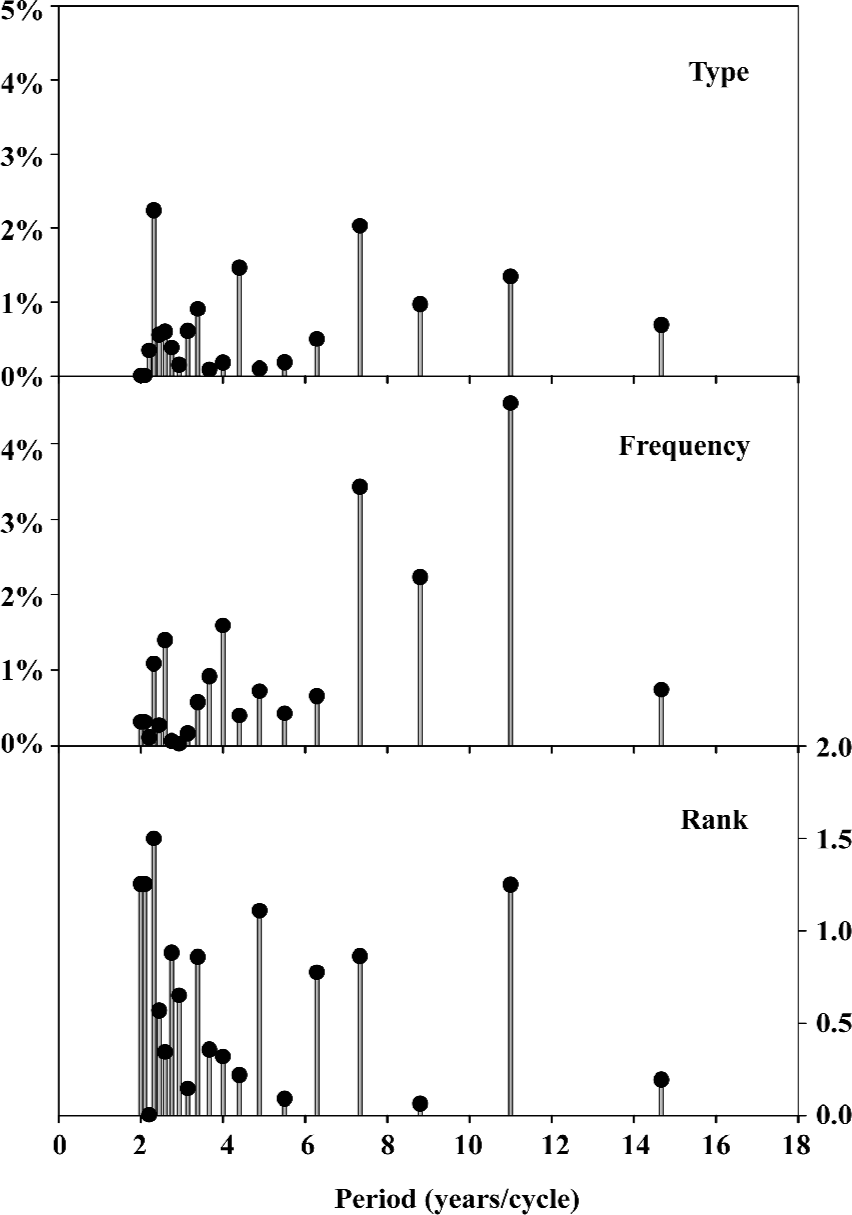
Notably, the prominent peak in the unpredictable frequency of amino-acid pair is located at a cycle of 11 years, which could approximately be connected to the interval of three pandemics (the second pandemic in 1957, the third in 1968 and the fourth in 1977[68,69]).
Compared to the periodicities based upon unpredictable type/frequency of amino-acid pairs and amino-acid distribution rank[67], we understand that there would be type mutations in quite a short period of time with the change in distribution of functional clusters, then there would be frequency mutations in a relative long cycle. In other words, some types of amino-acid pairs in functional clusters appear or disappear during a short period of time, thereafter the mutations are more likely to modify the existing types of amino-acid pairs.
Mutation trend in different hemagglutinin subtypes
As can be seen in Figure 1, the historical trend of hemagglutinin mutations is that the unpredictable portions are decreasing. Thus we would deduce that the larger the unpredictable portion is, the larger the mutation trend is, and this deduction is identical to the findings in our studies on other proteins[50–63].
Figure 4 illustrates the unpredictable portions of amino-acid pairs and distribution rank of amino acids in different hemagglutinin subtypes from influenza A viruses. Although each hemagglutinin subtype has different sensitivity to future mutations, a slight trend can be found in the top panel, for example, the unpredictable type decreases from H2 to H4, from H5 to H7, and increases from H11 to H14. We are particularly interested in H1, H2, H3, H5, H7, and H9 because they are linked to previous human infections. It is important to note that the unpredictable type of H5 hemagglutinins is remarkably larger than others, so the H5 hemagglutinins have a stronger mutation trend than others[46,66], we would therefore expect to see more mutations in H5 hemagglutinins until their unpredictable type reaches the average level, which is currently about 63.3%. This means that we would anticipate 12 type mutations in the future (3%/0.25%) seeing that the mean value of unpredictable type is about 66.5% in H5 hemagglutinins.
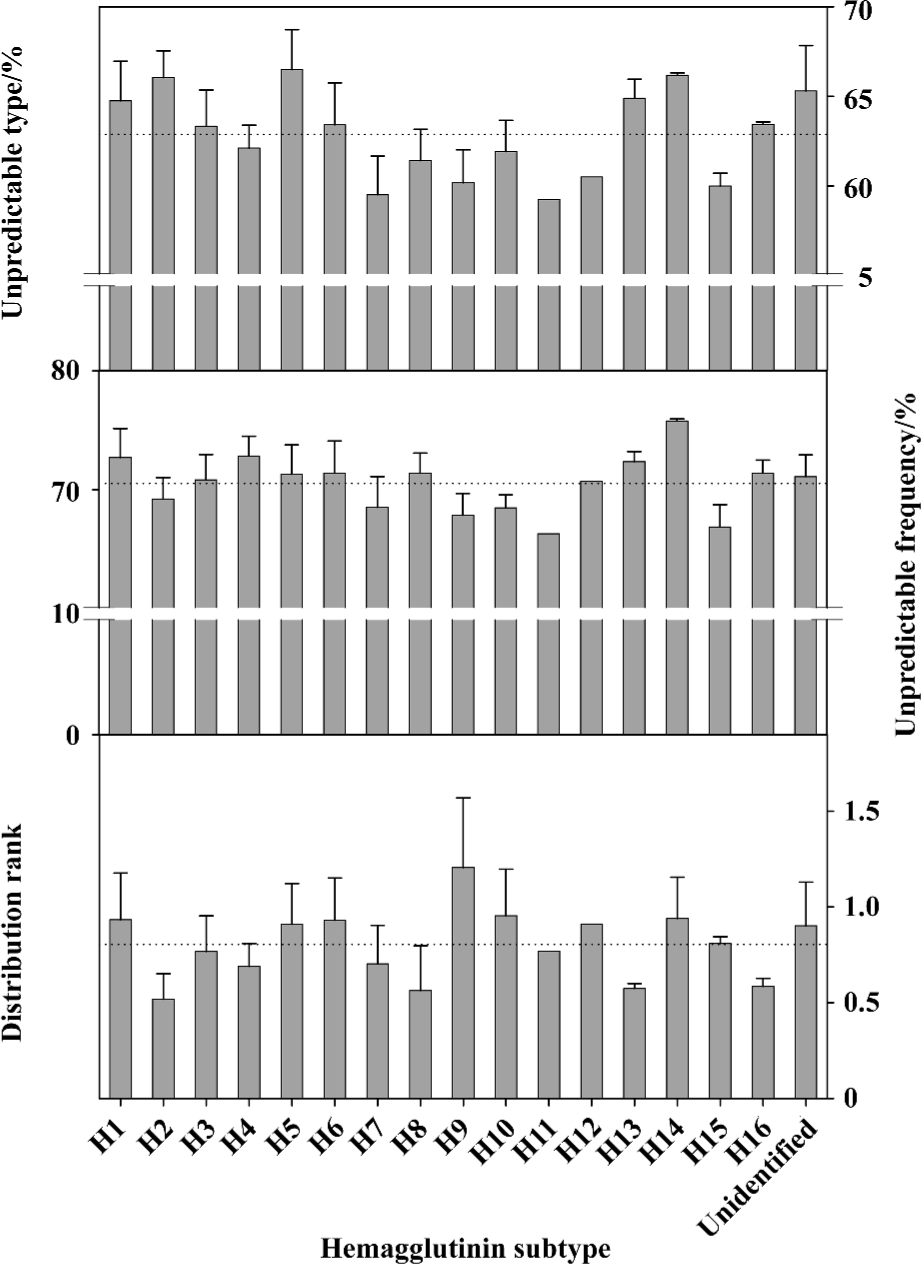
However, H5 hemagglutinins do not appear remarkably larger than the others in unpredictable frequency and distribution rank (the middle and bottom panels in Figure 4). As mentioned in the Appendix, the unpredictable type includes both absent and present types of amino-acid pairs, whereas the unpredictable frequency and distribution rank deal only with the amino acids present in a protein. Thus, the unpredictable type of amino-acid pair does indicate the mutation trend for the future, as some absent types can appear through mutations.
Mutation potency in different species
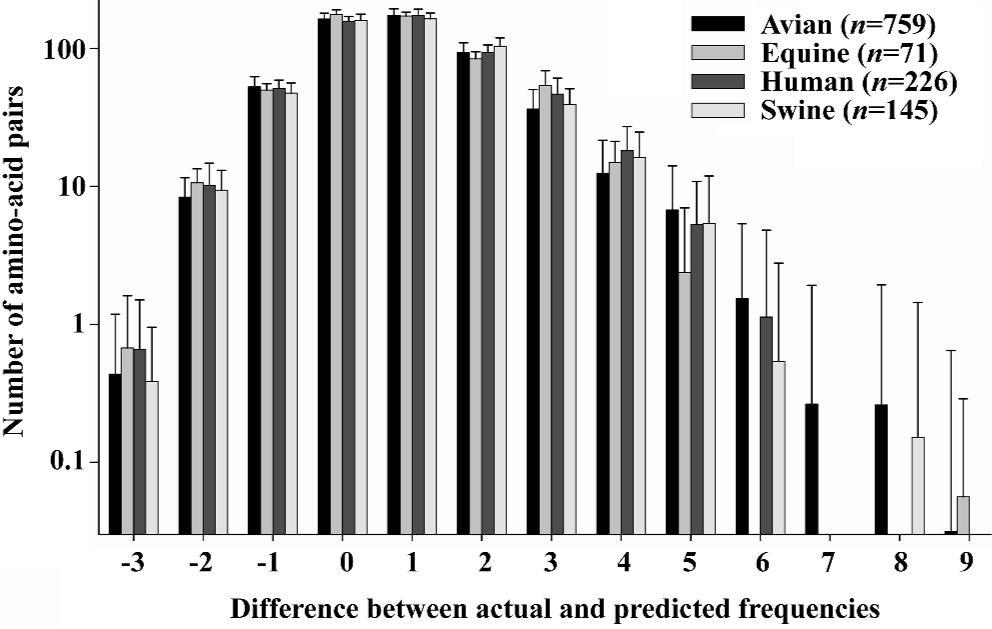
Although the percentage of unpredictable portions indicates the mutation trend, the unpredictable portions include a large number of amino-acid pairs, for example, the hemagglutinin of 1918 “Spanish” influenza virus contains 565 amino-acid pairs, of which 434 are unpredictable (76.81%). To search the amino-acid pair with big mutation potency, we use the difference between actual and predicted frequencies (Appendix) to determine the amino-acid pairs sensitive to mutations because this difference can serve as a measure of the structural stability of an amino-acid pair; that is, the smaller the difference the more stable the construction of the amino-acid pair. In particular, the larger the positive difference the more unpredictable the present amino-acid pair and, in contrast, the larger the negative difference the more unpredictable the absent amino-acid pair. In practice, the amino-acid pairs whose actual frequency is larger than their predicted one are likely to be targeted by mutations. In contrast, the amino-acid pairs whose actual frequency is smaller than their predicted one are more likely to be formed through mutation according to our previous studies[50–62].
Hence, the hemagglutinin containing a large number of amino-acid pairs with a big difference between actual and predicted frequencies is more sensitive to mutations than that with a large number of amino-acid pairs with a small difference between actual and predicted frequencies. Figure 5 gives us an idea of such an analysis, where two aspects can be seen. (i) The bars are not symmetric with respect to the zero difference (x-axis), indicating that there are more amino-acid pairs with a positive difference and less with a negative difference. In general, there are more amino-acid pairs being targeted by mutation than those formed through mutation. (ii) The avian hemagglutinins have more amino-acid pairs with larger positive differences than human ones. For instance, the largest positive difference is up to 9 in avian, but only 6 in humans. Seeing that the species vulnerability depends on the number of amino-acid pairs with larger differences, there would be more mutations in avian, this elucidates why so many mutations have been found in avian influenza viruses, and supports the notion that the avian species harbour a large reservoir of influenza virus strains[70–75].
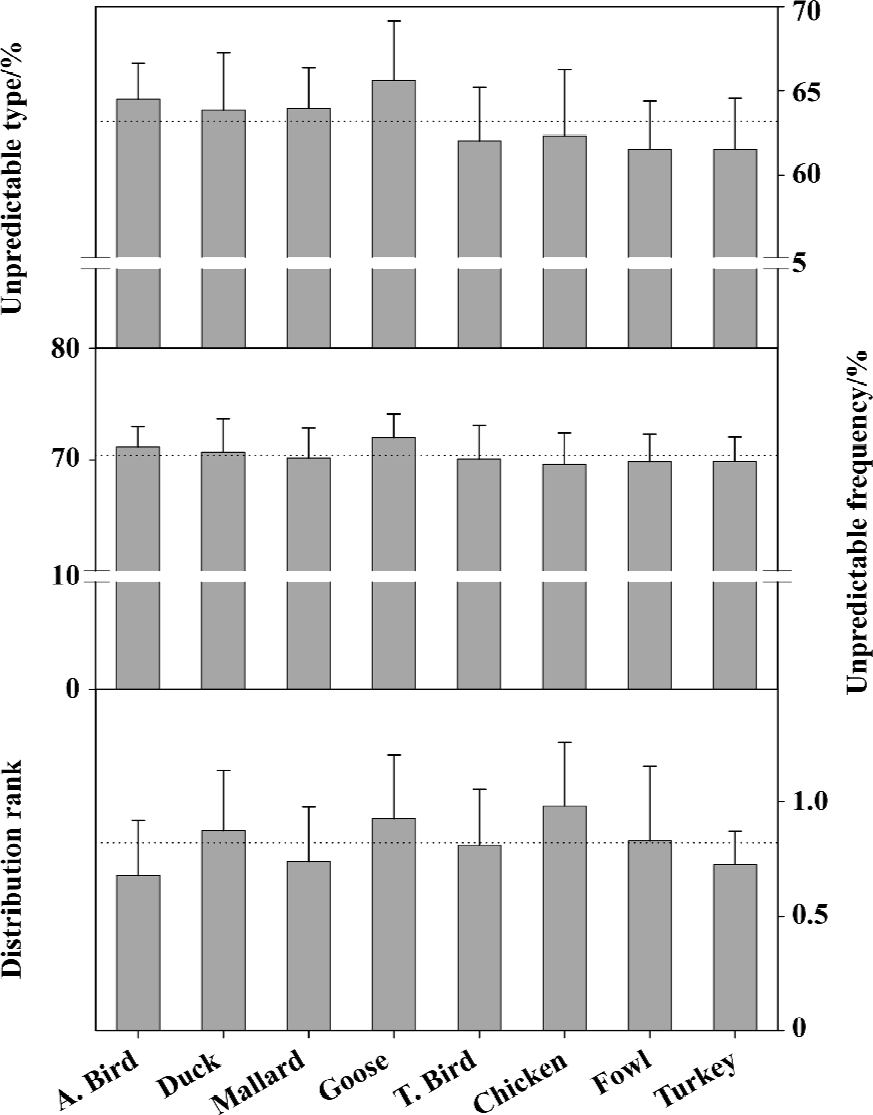
In addition, we can compare the mutation trend among different birds by reason that they are directly correlated to the occurrence of bird flu. Figure 6 shows that there are more unpredictable types in aquatic avian than in terraneous ones, thus water flock, especially aquatic birds and geese, are more sensitive to mutations[66]. These features provide the evidence supporting the hypothesis that aquatic birds are the primordial source of all influenza viruses in other species[1,76].
Outlook of hemagglutinin mutations for the future
Because unpredictable portions of amino-acid pairs and their fluctuation are becoming smaller along the time course (Figure 1), the trend line and channel clearly suggest the future of influenza virus hemagglutinins (Figure 7). Generally speaking, we would expect that the unpredictable portions and their fluctuation are continuing smaller along the trend line and channel although some fluctuations may go beyond the band. In such a case, there would be fewer pandemics in this century than in the last one. This presumption can be supported by the fact that there were four major influenza epidemics/pandemics recorded during the less than 20 years between 1830 and 1848[77]. It was quite the opposite, with only four influenza pandemics recorded in the last century.
These phenomena can be explained by our approach[44–62,66]. The unpredictable amino-acid pairs should deliberately be conserved for a certain purpose because their construction requires more time and energy, so that a protein maintains only absolutely necessary numbers of unpredictable amino-acid pairs. During the evolutionary process, nature is trying to minimize the unpredictable portion through mutations, which may bring about new unpredictable amino-acid pairs, and the newly introduced mutations result in the fluctuations[66].
Our position on the current cycle of hemagglutinin evolutionary process
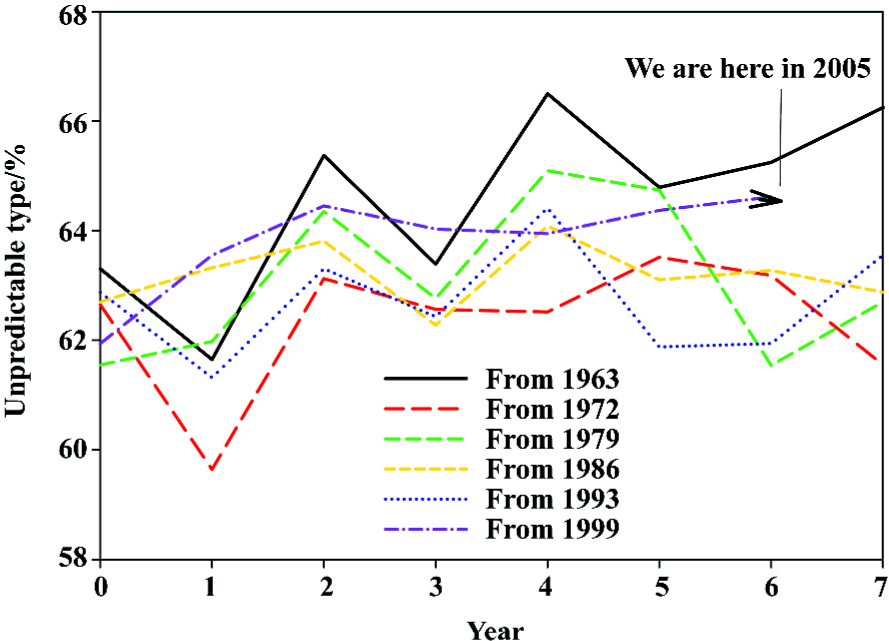
Based on the fast Fourier transform of unpredictable type of amino-acid pairs, we can approximately designate the hemagglutinin evolutionary process with a cycle of around 7 years, and furthermore we can estimate our position at the current cycle of hemagglutinin evolutionary process to determine how many years remain before the next spike, which may be related to severe mutations. Figure 8 demonstrates our position at the current cycle of hemagglutinin evolutionary process, and we are approaching the last year of the cycle. Compared with five historical lines, the unpredictable type of amino-acid pairs has a 3/5 chance of going up.
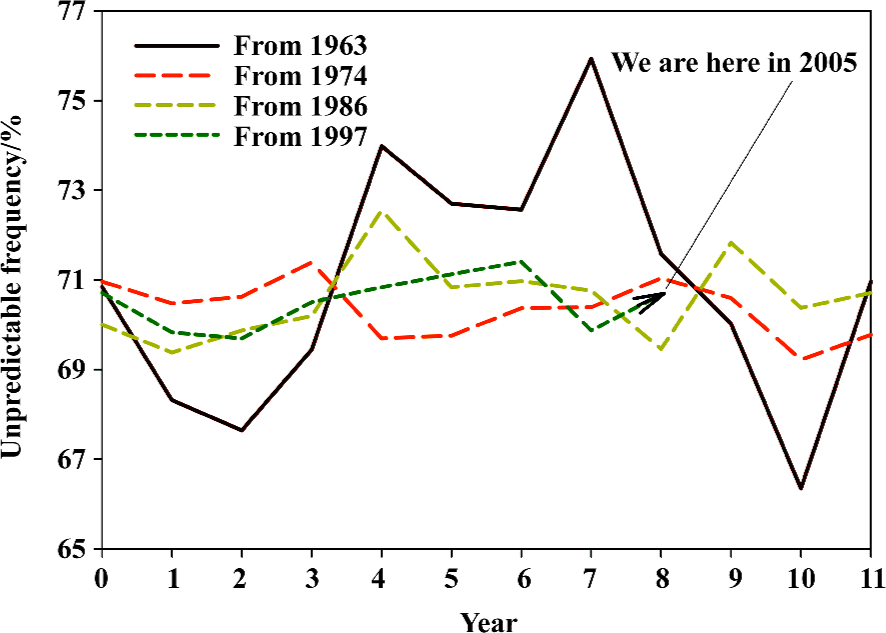
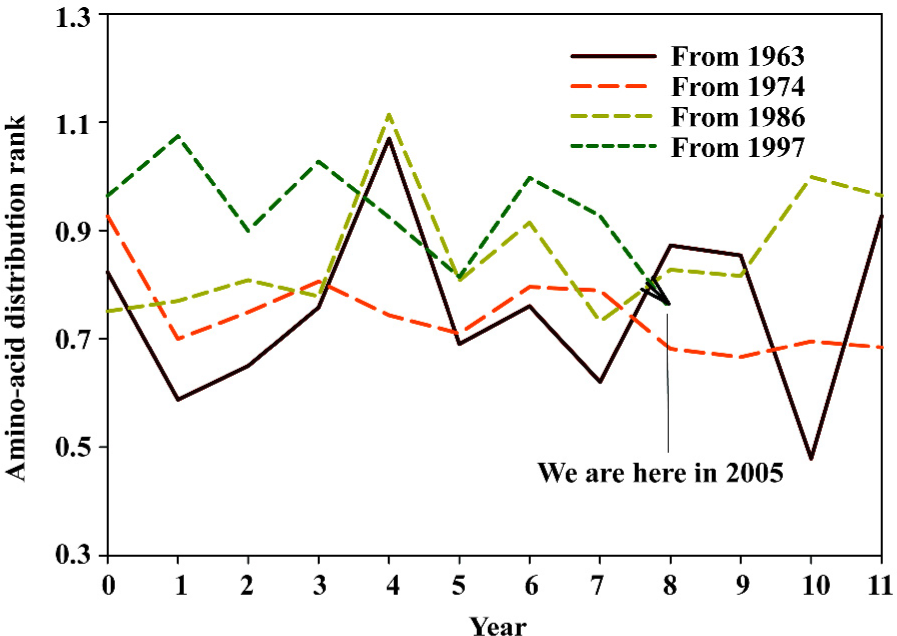
Figures 9 and 10 display our position at the current cycle of hemagglutinin evolutionary process based on the fast Fourier transform of unpredictable frequency of amino-acid pairs and amino-acid distribution rank, from which we can approximately elucidate the hemagglutinin evolutionary process with a cycle of around 11 years. We have three years before finishing this cycle, however the historical lines suggest the possibility of a spike.
Probability of occurring of mutation in hemag-glutinins
The undetermined factor for future mutation is the impact, which can either lead to the mutation or has no effect, meanwhile a mutation can occur without any impact (Appendix). Figure 11 shows the change in amino-acid distribution rank of different hemagglutinin subtypes from 1992 to 2002. Although we have yet to know what the impact was in 1997, the impact did interrupt the pattern of amino-acid distribution ranks in different subtypes of hemagglutinins along the time course.
Nevertheless, the hemagglutinin of influenza A virus must have the ability to mutate itself, otherwise no impact would have an effect on it. This ability is the probability of the occurrence of mutation, which can be determined using the cross-impact analysis with Bayesian equation (Appendix). Table 2 shows the probability of the occurrence of mutation in different subtypes of hemagglutinins and neuraminidases. As can be seen in Table 2, the H5 hemagglutinins have the maximal of 0.427 chance of occurrence of mutation without any impact, which is the largest probability of occurrence of spontaneous mutations among different hemagglutinin subtypes. Also, the chance of occurrence of spontaneous mutation is larger in N1 neuraminidases than in N2 ones[65]. Thus, the H5N1 viruses have the largest chance of simultaneous occurrence of mutations among different subtypes of hemagglutinins and neuraminidases, which can explain why there are so many mutations in H5N1 influenza viruses[72–76].
Full table
In fact, the mutation chance listed in the lower part of Table 2 is quite small if we consider that these probabilities represent the largest chance of simultaneous occurrence of mutation. This means that the impact does play an important role in the enhancement of the occurrence of mutation. Thus, we need to implement the probability of occurrence of mutation P(1) into a dynamic frame; that is, the chance of occurrence of mutation with different intensities of an impact. This is defined by the cross-impact analysis as the impacted probabilities P(1/2¯) and P(1/2) with equations 1 and 2 (Appendix).
Figure 12 illustrates the impacted probabilities with respect to the probability of occurrence of mutation P(1) and to the probability of occurrence of impact P(2) in different hemagglutinin subtypes from influenza A viruses, which can be read as follows. First, the left panels show these three probabilities in a 3-dementional configuration: the P(1) in x-axis, the P(2) in z-axis and the impacted probabilities in y-axis. Second, both impacted probabilities P(1/2¯) and P(1/2) are represented by two triangles ABC and ACD, respectively. Third, they are transferred into a 2-demensional figure (black and gray triangles in the right panels), so the dynamics of impact on the occurrence of mutation can be viewed easily and clearly[65].
Three clues to insights can be drawn from Figure 12: (i) as the intensity of the impact P(2) increases, probability of the occurrence of spontaneous mutations P(1|2¯) decreases(black triangle ABC), whereas the probability of the occurrence of P(1/2) induced mutations P(1/2) increases (gray triangle ACD); (ii) the impact can significantly enhance the probability of the occurrence of mutations P(1), whose range enlarges to the top-right corner from bottom-left; for example, the P(1) in H1 hemagglutinins changes to the range of 0.653–1 from the range of 0–0.347 (top panel); and (iii) among different hemagglutinin subtypes, the probability of the occurrence of mutations (both the black and gray triangles) is large in H5 hemagglutinins, which further supports the view that H5 hemagglutinins mutate more frequently. Thus, Figure 12 provides a quantitative way to predict the mutation trend of influenza virus hemagglutinins if we could predict an impact and define its intensity.
Direction of our future studies
In this review, we summarise the results at the first stage of our studies[46,48,65–67,78]; that is, we focus mainly on the general trend of hemagglutinin mutations. This is not only because we are still developing our methods, but also because at this stage the systematic trends are more important than the trends in an individual case, which is masked by numerous random and uncertain factors. We hope to understand how the principal average or trend arises before we are able to explain what is causing individual cases to depart from it.
In our future studies, one direction is to monitor the change in unpredictable portions and distribution rank with new available data, since we should be alert to a possible outbreak of influenza and bird flu if a significant change is recorded. The other direction is to predict future mutations, because given a mutation in a protein, our first approach reveals the mutation trend of an individual amino-acid pair; our second approach indicates the sensitive position, and our third approach, which is the translation probability between RNA and mutated amino acid[79], highlights the possible mutated amino acid. Together with these three approaches, we may predict the mutations at a specific amino acid in a particular region of influenza virus hemagglutinins in the future.
Appendix
Methodology
The rationale and detailed description of our approaches have been published in all of our previous publications[24–67,78]; however, as they are not yet familiar to many researchers, we describe our methods with the example of the hemagglutinin of 1918 “Spanish” influenza A virus (accession number AF117241), which is the earliest complete sequence documented in the data bank[80,81].
Amino-acid pair predictability
As we know that an amino-acid pair in a protein is composed of any 20 kinds of amino acids, so theoretically there are 400 possible types of amino-acid pairs. In terms of amino-acid pairs, the distinguishing of protein differs in the number of possible types of amino-acid pairs and/or in the frequency of each type. The 1918 hemagglutinin is composed of 566 amino acids, thus there are 565 amino-acid pairs. Of 400 possible types, 137 are absent and 263 present: 111 types appear once, 71 twice, 42 three, 24 four, 8 five, 5 six, 1 nine and 1 eleven times, respectively.
Randomly predictable present type of amino-acid pair with predictable frequency There are 44 glycines (G) and 37 threonines (T) in the 1918 hemagglutinin, the frequency of random presence of amino-acid pair GT is 3 (44/566×37/565×565=2.876); that is, GT would appear three times in the protein. In fact, we do find three GT in this hemagglutinin, so the actual frequency of GT is 3. In this case both the presence of the type GT and its frequency are predictable, and the difference between its actual and predicted frequencies is 0.
Randomly predictable present type of amino-acid pair with unpredictable frequency There are 51 leucines (L) in the 1918 hemagglutinin, the frequency of random presence of amino-acid pair LL is 5 (51/566×50/565×565=4.505); that is, there would be five LL in this hemagglutinin. But actually the LL appears eleven times, so the presence of LL is predictable, but its frequency is unpredictable, and the difference between its actual and predicted frequencies is 6.
It is also the case that the actual frequency is larger than the predicted one. Another case is that the actual frequency is smaller than predicted. For instance, there are 35 glutamic acids (E) in the protein, the predicted frequency of EG is 3 (35/566×44/565×565=2.721), while its actual frequency is only 1 and the difference between its actual and predicted frequencies is -2.
Randomly unpredictable present type of amino-acid pair
There are 13 histidines (H) in the 1918 hemagglutinin, and the predicted frequency of HH is 0 (13/566×12/565×565=0.276), so the type HH would not appear in this hemagglutinin. However it appears twice in the reality, thus the presence of HH is unpredictable. Naturally its frequency is unpredictable too, and the difference between its actual and predicted frequencies is 2.
Randomly predictable absent type of amino-acid pair There are 8 methionines (M) and 17 glutamines (Q) in the 1918 hemagglutinin. The predicted frequency of MQ is 0 (8/566×17/565×565=0.240); that is, the MQ would not appear in this hemagglutinin, which is true in the real situation. Thus the absence of MQ with its frequency is predictable, and the difference between its actual and predicted frequencies is 0.
Randomly unpredictable absent type of amino-acid pair There are 49 serines (S) and 37 alanines (A) in the 1918 hemagglutinin. The predicted frequency of SA is 3 (49/566×37/565×565=3.203); that is, there would be three SA in this hemagglutinin. However, in reality no SA appears, therefore the absence of SA from this hemagglutinin is unpredictable. Naturally its frequency is unpredictable too, and the difference between its actual and predicted frequencies is -3.
Predictable and unpredictable portions of amino-acid pairs After the calculations described above, the amino-acid pairs in a protein can be classified as predictable and unpredictable portions with respect to type and frequency, and the sum of both predictable and unpredictable portions is 100%. Of the amino-acid pairs in the 1918 hemagglutinin, the unpredictable type and frequency are 68.75% and 76.81%, respectively. Either the predictable or unpredict-able portions can serve as a quantitative measure to present a protein.
Difference between actual and predicted frequencies of amino-acid pairs The unpredictable amino-acid pairs can be further divided into two parts: one is the actual frequency smaller than predicted, while the other is the actual frequency larger than predicted. To compare the constructive stability of amino-acid pairs, we calculate the difference between actual frequency and predicted frequency of amino-acid pairs in a protein. Considering 400 theoretical amino-acid types of the 1918 hemagglutinin, 153 types (38.25%) have the actual frequencies smaller than predicted and the average difference is -1.183, while 122 types (30.50%) show the actual frequencies larger than predicted and the average difference is 1.492. Taking 565 amino-acid pairs of the 1918 hemagglutinin into account, 71 pairs (12.57%) contain actual frequencies smaller than predicted and the average difference is -1.197, whereas 363 pairs (64.25%) reveal the actual frequencies larger than predicted and the average difference is 1.846.
Type mutation and frequency mutation As there are 400 types of theoretically possible amino-acid pairs and we use the 100% to classify them as predicable and unpredictable types, thus 0.25% represents one of 400 types, so a 0.25% change indicates that one of 400 types mutates to an unpredictable type from a predictable type or vice versa. This is the type mutation. However, the situation related to the frequency of amino-acid pairs is dependent on the length of amino-acid sequence. Hence, approximately 0.18% (1/565) change can be regarded as a modification in an amino-acid pair in the 1918 hemagglutinin, as there are 565 amino-acid pairs in the protein. This is the frequency mutation.
Amino-acid distribution probability/rank
The position of any 20 kinds of amino acids in a protein can be determined by experimental approach, so each kind of amino acid has a certain distribution pattern in a protein with respect to its position. Furthermore a certain distribution pattern can be associated with a certain probability, which can be calculated according to the occupancy problems of subpopulations and partitions[82]. For a certain distribution of a kind of amino acid in a protein, its distribution probability is equal to r!/(q0!×q1!×...×qn!)×r!/(r1!×r2!×...×rn!)×n-r, where ! is the factorial function; that is, n!=n×(n - 1)×(n - 2)×...×1, 0!=1 by definition, r is the number of a type of amino acid, q is the number of parts with the same number of amino acids and n is the number of grouped parts in the protein for a type of amino acid.
For example, there are eight metheonines (M), the least abundant amino acid, in the 1918 hemagglutinin, how do these 8 M distribute among 566 amino acids in this hemagglutinin? We can imagine to group this hemagglutinin into 8 parts, and each one contains about 71 amino acids (566/8=70.75). Table 3 lists all 22 possible distribution patterns regarding 8 M in 8 parts and their distribution probabilities and ranks. The first eight columns in Table 3 show that the 1918 hemagglutinin is grouped into 8 parts, and the first eight cells in each row represent a possible distribution pattern of M, and the last two columns display the corresponding distribution probability and rank.
Full table
As different distribution patterns can have the same distribution probability, we rank the distribution probabilities according to a descending order, thus the largest distribution probability is ranked as one. Again in our example, there are 22 possible distributions for 8 M in 8 parts in Table 3, while there are only 18 distribution ranks. In general, the smaller the distribution rank is, the larger the distribution probability is. Although there are many possible distributions for a type of amino acids in a protein (such as 22 possible distributions for 8 M), the protein in question possesses only one distribution pattern, therefore there is only one distribution probability/rank for each kind of amino acid and a maximum of 20 distribution probabilities/ranks in a protein.
Similarly, we imagine to group 11 parts for 11 tryptophans (W), 13 parts for 13 histidines (H), 16 parts for 16 cysteines (C), 17 parts for 17 glutamines (Q), 19 parts for 19 phenylalanines (F) and prolines (P), 20 parts for 20 arginines (R), 25 parts for 25 aspartic acids (D), 26 parts for 26 tyrosines (Y), 32 parts for 32 isoleucines (I) and valines (V), 33 parts for 33 lysines (K), 35 parts for 35 glutamic acids (E), 37 parts for 37 alanines and threonines (T), 42 parts for 42 asparagines (N), 44 parts for 44 glycines (G), 49 parts for 49 serines (S), 51 parts for 51 leucines (L) in the hemagglutinin of 1918 “Spanish” influenza virus, and conduct the similar calculations.
As different kinds of amino acids have different contributions to a protein, we standardize them by means of the distribution rank per amino acid, which is calculated by dividing the rank of each kind of amino acids by the number of corresponding amino acids. In the 1918 hemagglutinin, the distribution rank of metheonines is 1/8=0.125, because these 8 metheonines distribute in the hemagglutinin with the largest probability (0.2523). Accordingly, the sum of ranks for all 20 kinds of amino acids is 22.8698, thus the distribution rank in this protein is 22.8698/20=1.1435. Naturally, the distribution rank can serve as a quantitative measure to present a protein.
Implication of our approaches
The construction of a protein with large predictable portions of amino-acid pairs and with small amino-acid distribution rank is certainly a way to adapt to the fast-changes in surroundings and environments, as the speed of construction of a protein might be crucial for its survival, this would require the least time and energy.
However, nature should deliberately construct the amino-acid pairs whose actual frequency differs from the predicted frequency and whose amino acids cluster somewhere of a protein with a larger amino-acid distribution rank. The functional amino-acid pairs should be deliberately evolved, so a protein keeps only absolutely necessary unpredictable amino-acid pairs. During the evolutionary process, nature is trying to minimize the unpredictable portion through mutations, which may bring about new unpredictable amino-acid pairs, so the evolutionary process is continuing.
Fast Fourier transform
One of important applications of Fourier analysis is to determine the periodicity in a chaotic fluctuating dataset, so we use it to analyze the potential periodicity of hemagglutinin mutations over time[66,67].
Cross-impact analysis
An impact can either lead to the mutation or has no effect, meanwhile a mutation can occur without any impact. In the context of our study, these relationships can be represented by means of the cross-impact analysis in Figure 13[83–88]. At the impact level, P(2¯) is the probability of not occurring of an impact, and the P(2) is the probability of occurring of an impact. At the mutation level, the P(1|2¯) is the impacted probability of occurring of mutation without an impact, the P(1¯|2¯) is the impacted probability of not occurring of mutation without an impact, the P(1¯|2) is the impacted probability of not occurring of mutation with an impact, and the P(1|2) is the impacted probability of occurring of mutation with an impact. At the influenza level, both P(1¯2¯) and P(1¯2) are the probabilities of not occurring of influenza without and with an impact, whereas both P(12¯) and P(12) are the probabilities of occurring of influenza without and with an impact.
The impact on mutation can be traced through Figure 13, for example, the probability P(12) will increase if an impact enhances the chance of the occurrence of mutation. Most importantly, Bayes’ law indicates that the probabilities of occurrences of two events can be related by
where P(1) is the probability of the occurrence of mutation. In the cross-impact analysis, both enhancement and inhibition have been defined with respect to coupled events. The enhancement is that the occurrence of the second event enhances the probability of occurrence of the first event; that is, P(1|2)>P(1), in our case, an impact increases the occurrence of mutation. The inhibition is that the occurrence of second event inhibits the probability of the occurrence of the first event; that is, P(1|2)<P(1), in our case, an impact decreases the occurrence of mutation. When we are dealing with the situation that the impact enhances the mutations, the following equations are used[87,88]:
What Figure 13 says is that each event has two complementary probabilities, namely, occurrence and non-occurrence, and influence and non-influence on the following event. In more complicated forms, the impact can be many, and each has its occurrence and non-occurrence, and influence and non-influence. However, we cannot directly use the analysis in Figure 13 and equations 1 and 2 because we know neither what is/are the impact/impacts leading to the mutations in proteins of influenza A viruses nor how large is the probability of spontaneous mutations in them. In order to predict the mutation trend in different hemagglutinin subtypes, we conducted a study with the combination of Bayes’ law[65].
References
- Baigent SJ, McCauley JW. Influenza type A in humans, mammals and birds: determinants of virus virulence, host-range and interspecies transmission. Bioessays 2003;25:657-71.
- Tognotti E. Scientific triumphalism and learning from facts: bacteriology and the “Spanish flu” challenge of 1918. Soc Hist Med 2003;16:97-110.
- Reid AH, Taubenberger JK. The origin of the 1918 pandemic influenza virus: a continuing enigma. J Gen Virol 2003;84:2285-92.
- Schafer JR, Kawaoka Y, Bean WJ, Suss J, Senne D, Webster RG. Origin of the pandemic 1957 H2 influenza A virus and the persistence of its possible progenitors in the avian reservoir. Virology 1993;194:781-8.
- Bean WJ, Schell M, Katz J, Kawaoka Y, Naeve C, Gorman O, et al. Evolution of the H3 influenza virus hemagglutinin from human and nonhuman hosts. J Virol 1992;66:1129-38.
- Lin YP, Shaw M, Gregory V, Cameron K, Lim W, Klimov A, et al. Avian-to-human transmission of H9N2 subtype influenza A viruses: relationship between H9N2 and H5N1 human isolates. Proc Natl Acad Sci USA 2000;97:9654-8.
- Katz JM. The impact of avian influenza viruses on public health. Avian Dis 2003;47:914-20.
- Perdue ML, Swayne DE. Public health risk from avian influenza viruses. Avian Dis 2005;49:317-27.
- de la Barrera CA, Reyes-Teran G. Influenza: forecast for a pandemic. Arch Med Res 2005;36:628-36.
- Hilleman MR. Realities and enigmas of human viral influenza: pathogenesis, epidemiology and control. Vaccine 2002;20:3068-87.
- Zambon MC. Epidemiology and pathogenesis of influenza. J Antimicrob Chemother 1999; 44 Suppl B: 3–9.
- Subbarao K, Katz J. Avian influenza viruses infecting humans. Cell Mol Life Sci 2000;57:1770-84.
- Yang P, Bansal A, Liu C, Air GM. Hemagglutinin specificity and neuraminidase coding capacity of neuraminidase-deficient influenza viruses. Virology 1997;229:155-65.
- Patriarca PA. New options for prevention and control of influenza. JAMA 1999;282:75-7.
- Donis RO, Bean WJ, Kawaoka Y, Webster RG. Distinct lineages of influenza virus H4 hemagglutinin genes in different regions of the world. Virology 1989;169:408-17.
- Hoffmann E, Stech J, Leneva I, Krauss S, Scholtissek C, Chin PS, et al. Characterization of the influenza A virus gene pool in avian species in southern China: was H6N1 a derivative or a precursor of H5N1? Virology 2000;74:6309-15.
- Bender C, Hall H, Huang J, Klimov A, Cox N, Hay A, et al. Characterization of the surface proteins of influenza A (H5N1) viruses isolated from humans in 1997–1998. Virology 1999;254:115-23.
- Gubareva LV, Novikov DV, Hayden FG. Assessment of hemagglutinin sequence heterogeneity during influenza virus transmission in families. J Infect Dis 2002;186:1575-81.
- Webster RG, Guan Y, Peiris M, Walker D, Krauss S, Zhou NN, et al. Characterization of H5N1 influenza viruses that continue to circulate in geese in southeastern China. J Virol 2002;76:118-26.
- Spackman E, Senne DA, Davison S, Suarez DL. Sequence analysis of recent H7 avian influenza viruses associated with three different outbreaks in commercial poultry in the United States. J Virol 2003;77:13399-402.
- Deem MW, Lee HY. Sequence space localization in the immune system response to vaccination and disease. Phys Rev Lett 2003;91:068101.
- Ferguson NM, Galvani AP, Bush RM. Ecological and immunological determinants of influenza evolution. Nature 2003;422:428-33.
- Lin J, Andreasen V, Casagrandi R, Levin SA. Traveling waves in a model of influenza A drift. J Theor Biol 2003;222:437-45.
- Wu G. The first and second order Markov chain analysis on amino acids sequence of human haemoglobin α-chain and its three variants with low O2 affinity. Comp Haematol Int 1999;9:148-51.
- Wu G. The first, second and third order Markov chain analysis on amino acids sequence of human tyrosine aminotransferase and its variant causing tyrosinemia type II. Pediatr Relat Top 2000;39:37-47.
- Wu G. The first, second, third and fourth order Markov chain analysis on amino acids sequence of human dopamine β-hydroxylase. Mol Psychiatry 2000;5:448-51.
- Wu G. Frequency and Markov chain analysis of amino-acid sequence of human glutathione reductase. Biochem Biophys Res Commun 2000;268:823-6.
- Wu G. Frequency and Markov chain analysis of amino-acid sequence of human tumor necrosis factor. Cancer Lett 2000;153:145-50.
- Wu G. Frequency and Markov chain analysis of the amino-acid sequence of sheep p53 protein. J Biochem Mol Biol Biophys 2000;4:179-85.
- Wu G. Frequency and Markov chain analysis of amino-acid sequences of mouse p53. Human Exp Toxicol 2000;19:535-9.
- Wu G. Frequency and Markov chain analysis of the amino-acid sequence of human alcohol dehydrogenase α-chain. Alcohol Alcohol 2000;35:302-6.
- Wu G, Yan SM. Frequency and Markov chain analysis of amino-acids sequence of human platelet-activating factor acetylhydrolase α-subunit and its variant causing the lissencephaly syndrome. Pediatr Relat Top 2000;39:513-26.
- Wu G, Yan SM. Prediction of two- and three-amino-acid sequences of Citrobacter Freundii β-lactamase from its amino acid composition. J Mol Microbiol Biotechnol 2000;2:277-81.
- Wu G, Yan SM. Prediction of two- and three-amino acid sequence of human acute myeloid leukemia 1 protein from its amino acid composition. Comp Haematol Int 2000;10:85-9.
- Wu G, Yan SM. Frequency and Markov chain analysis of amino-acid sequences of human connective tissue growth factor. J Mol Model 2001;5:120-4.
- Wu G, Yan SM. Prediction of presence and absence of two- and three-amino-acid sequence of human monoamine oxidase B from its amino acid composition according to the random mechanism. Biomol Eng 2001;18:23-7.
- Wu G, Yan SM. Prediction of presence and absence of two- and three-amino-acid sequence of human tyrosinase from their amino acid composition and related changes in human tyrosinase variant causing oculocutaneous albinism. Pediatr Relat Top 2001;40:153-66.
- Wu G, Yan SM. Random analysis of presence and absence of two- and three-amino-acid sequences and distributions of amino acids, two- and three-amino-acid sequences in bovine p53 protein. Mol Biol Today 2002;3:31-7.
- Wu G, Yan SM. Prediction of distributions of amino acids and amino acid pairs in human haemoglobin α-chain and its seven variants causing α-thalassemia from their occurrences according to the random mechanism. Comp Haematol Int 2000;10:80-4.
- Wu G, Yan SM. Analysis of distributions of amino acids, amino acid pairs and triplets in human insulin precursor and four variants from their occurrences according to the random mechanism. J Biochem Mol Biol Biophys 2001;5:293-300.
- Wu G, Yan SM. Analysis of distributions of amino acids and amino acid pairs in human tumor necrosis factor precursor and its eight variants according to random mechanism. J Mol Model 2001;7:318-23.
- Wu G, Yan SM. Analysis of distributions of amino acids in the primary structure of apoptosis regulator Bcl-2 family according to the random mechanism. J Biochem Mol Biol Biophys 2002;6:407-14.
- Wu G, Yan SM. Analysis of distributions of amino acids in the primary structure of tumor suppressor p53 family according to the random mechanism. J Mol Model 2002;8:191-8.
- Wu G, Yan SM. Randomness in the primary structure of protein: methods and implications. Mol Biol Today 2002;3:55-69.
- Wu G, Yan S. Prediction of amino acid pairs sensitive to mutations in the spike protein from SARS related coronavirus. Peptides 2003;24:1837-45.
- Wu G, Yan S. Fate of 130 hemagglutinins from different influenza A viruses. Biochem Biophys Res Commun 2004;317:917-24.
- Wu G, Yan S. Potential targets for anti-SARS drugs in the structural proteins from SARS related coronavirus. Peptides 2004;25:901-8.
- Wu G, Yan S. Mutation features of 215 polymerase proteins from different influenza A viruses. Med Sci Monit 2005;11:BR367-72.
- Wu G, Yan S. Reasoning of spike glycoproteins being more vulnerable to mutations among 158 coronavirus proteins from different species. J Mol Model 2005;11:8-16.
- Wu G, Yan S. Determination of amino acid pairs sensitive to variants in human low-density lipoprotein receptor precursor by means of a random approach. J Biochem Mol Biol Biophys 2002;6:401-6.
- Wu G, Yan SM. Estimation of amino acid pairs sensitive to variants in human phenylalanine hydroxylase protein by means of a random approach. Peptides 2002;23:2085-90.
- Wu G, Yan S. Analysis of amino acid pairs sensitive to variants in human collagen α5(IV) chain precursor by means of a random approach. Peptides 2003;24:347-52.
- Wu G, Yan S. Determination of amino acid pairs sensitive to variants in human β-glucocerebrosidase by means of a random approach. Protein Eng 2003;16:195-9.
- Wu G, Yan SM. Determination of amino acid pairs in human haemoglobulin α-chain sensitive to variants by means of a random approach. Comp Clin Pathol 2003;12:21-5.
- Wu G, Yan S. Determination of amino acid pairs sensitive to variants in human Bruton’s tyrosine kinase by means of a random approach. Mol Simul 2003;29:249-54.
- Wu G, Yan S. Determination of amino acid pairs sensitive to variants in human coagulation factor IX precursor by means of a random approach. J Biomed Sci 2003;10:451-4.
- Wu G, Yan S. Determination of amino acid pairs in human p53 protein sensitive to mutations/variants by means of a random approach. J Mol Model 2003;9:337-41.
- Wu G, Yan S. Determination of amino acid pairs in Von Hippel-Lindau disease tumour suppressor (G7 protein) sensitive to variants by means of a random approach. J Appl Res 2003;3:512-20.
- Wu G, Yan S. Determination of amino acid pairs sensitive to variants in human copper-transporting ATPase 2. Biochem Biophys Res Commun 2004;319:27-31.
- Wu G, Yan S. Susceptible amino acid pairs in variants of human collagen a1(III) chain precursor. EXCLI J 2004;3:20-8.
- Wu G, Yan S. Amino acid pairs sensitive to variants in human collagen a1(I) chain precursor. EXCLI J 2004;3:10-9.
- Wu G, Yan S. Amino acid pairs susceptible to variants in human protein C precursor. Protein Pept Lett 2005;10:491-4.
- Wu G, Yan S. Determination of sensitive positions to mutations in human p53 protein. Biochem Biophys Res Commun 2004;321:313-9.
- Gao N, Yan S, Wu G. Pattern of positions sensitive to mutations in human haemoglobin α-chain. Protein Pept Lett 2006;13:101-7.
- Wu G, Yan S. Prediction of mutation trend in hemagglutinins and neuraminidases from influenza A viruses by means of cross-impact analysis. Biochem Biophys Res Commun 2005;326:475-82.
- Wu G, Yan S. Timing of mutation in hemagglutinins from influenza A virus by means of unpredictable portion of amino-acid pair and fast Fourier transform. Biochem Biophys Res Commun 2005;333:70-8.
- Wu G, Yan S. Timing of mutation in hemagglutinins from influenza A virus by means of amino-acid distribution rank and fast Fourier transform. Protein Pept Lett 2006;13:143-8.
- Hope-Simpson RE, Golubev DB. A new concept of the epidemic process of influenza A virus. Epidemiol Infect 1987;99:5-54.
- Capua I, Alexander DJ. Avian influenza and human health. Acta Trop 2002;83:1-6.
- Matrosovich M, Tuzikov A, Bovin N, Gambaryan A, Klimov A, Castrucci MR, et al. Early alterations of the receptor-binding properties of H1, H2, and H3 avian influenza virus hemagglutinins after their introduction into mammals. J Virol 2000;74:8502-12.
- Hiromoto Y, Yamazaki Y, Fukushima T, Saito T, Lindstrom SE, Omoe K, et al. Evolutionary characterization of the six internal genes of H5N1 human influenza A virus. J Gen Virol 2000;81:1293-303.
- Zhou NN, Shortridge KF, Claas ECJ, Krauss SL, Webster RG. Rapid evolution of H5N1 influenza viruses in chickens in Hong Kong. J Virol 1999;73:3366-74.
- Guan Y, Poon LL, Cheung CY, Ellis TM, Lim W, Lipatov AS, et al. H5N1 influenza: a protean pandemic threat. Proc Natl Acad Sci USA 2004;101:8156-61.
- Govorkova EA, Rehg JE, Krauss S, Yen HL, Guan Y, Peiris M, et al. Lethality to ferrets of H5N1 influenza viruses isolated from humans and poultry in 2004. J Virol 2005;79:2191-8.
- Puthavathana P, Auewarakul P, Charoenying PC, Sangsiriwut K, Pooruk P, Boonnak K, et al. Molecular characterization of the complete genome of human influenza H5N1 virus isolates from Thailand. J Gen Virol 2005;86:423-33.
- Webster RG, Bean WJ, Gorman OT, Chambers TM, Kawaoka Y. Evolution and ecology of influenza A viruses. Microbiol Rev 1992;56:152-79.
- Patterson KD. Pandemic and epidemic influenza, 1830–1848. Soc Sci Med 1985;21:571-80.
- Wu G, Yan S. Fate of influenza A virus proteins. Protein Pept Lett accepted.
- Wu G, Yan S. Determination of mutation trend in proteins by means of translation probability between RNA codes and mutated amino acids. Biochem Biophys Res Commun 2005;337:692-700.
- Taubenberger JK, Reid AH, Krafft AE, Bijwaard KE, Fanning TG. Initial genetic characterization of the 1918 “Spanish” influenza virus. Science 1997;275:1793-6.
- Reid AH, Fanning TG, Hultin JV, Taubenberger JK. Origin and evolution of the 1918 “Spanish” influenza virus hemagglutinin gene. Proc Natl Acad Sci USA 1999;96:1651-6.
- Feller W. An introduction to probability theory and its applications. 3rd ed. Vol I. New York: Wiley; 1968.
- Gordon TG, Hayward H. Initial experiments with the cross-impact matrix method of forecasting. Futures 1968;1:100-16.
- Gordon TG. Cross-impact matrices – an illustration of their use for policy analysis. Futures 1969;2:527-31.
- Enzer S. Delphi and cross-impact techniques: an effective combination for systematic futures analysis. Futures 1970;3:48-61.
- Enzer S. Cross-impact techniques in technology assessment. Futures 1972;4:30-51.
- Sage AP. Methodology for large-scale systems. New York: McGraw-Hill; 1977. p 165–203.
- Wu G. Application of cross-impact analysis to the relationship between aldehyde dehydrogenase 2 allele and the flushing syndrome. Alcohol Alcohol 2000;35:55-9.