
Predictive model of blood-brain barrier penetration of organic compounds1
Introduction
The two barriers separating the central nervous system (CNS) from the periphery are the blood-brain barrier (BBB), located at the endothelial cells of the brain tissue capillaries, and the blood-cerebrospinal fluid barrier (B-CSF-B), at the choroids plexus and the circumventricular organs[1]. Formed by complex tight junctions of the brain capillary endothelial cells, the BBB segregates the circulating blood from interstitial fluid in the brain[2]. The capillary endothelial cells regulate the permeability property of the BBB. However, there are at least four kinds of cells that comprise the brain microvasculature, and all contribute to the regulation of the cerebral microvasculature and, indirectly, to the regulation of BBB permeability. The endothelial cell and the pericyte share a common capillary basement membrane. There is approximately one pericyte for every two to four endothelial cells[3]. Also, immunohistochemistry is a widely used research technique in BBB research for the cellular localization of proteins of interest in normal vessels and the documentation of altered expression following disease states, for the identification of cultured cells and for the spatial localization of novel gene products[4].
Although the BBB was thought to act as a static wall protecting the brain, application of recent advanced methodologies to study the BBB has led to the new concept that the BBB acts as a dynamic regulatory interface. Using primary cultured bovine brain capillary endothelial cells, Tsuji et al[5,6] have found that P-glycoprotein (ABCB1) acts as an efflux pump for the anti-cancer drugs, vincristine, at the BBB. Schinkel et al[7-9] have developed the mdr 1a gene knockout mouse and proved that P-glycoprotein (ie, mdr 1a gene products) plays a key role in restricting the apparent cerebral distributed vinblastine (a substrate of P-glycoprotein) across the BBB. However, several hydrophilic substrates such as metabolites of cerebral neurotransmitters are present in the brain, which reduce the cerebral concentration, and as a result, could play an important role in CNS detoxification.
To be effective, CNS therapeutic agents must have the ability to cross over the BBB whereas peripherally acting drugs should hardly be able to pass the BBB. The uptake of a compound into the brain is a complex process. The moderately lipophilic drugs can pass the BBB by passive diffusion and the hydrogen bonding properties of drugs significantly influence their particular CNS uptake profiles. Polar molecules are generally poor CNS agents unless they undergo active transport to pass the CNS. Size, ionization properties, and molecular flexibility are other factors observed to influence transport of an organic compound across the BBB[10-13]. Recently, there has been a surge in computational efforts to evaluate absorption, distribution, meta-bolism, excretion, and toxicity (ADME/T) properties of drugs. These new computational approaches remain to focus on modeling structurally diverse data sets by dealing with the properties of the solutes. These properties are limited to relative lipophilicity indices, solvation and hydrogen bond parameters, topological indices, and limited three-dimensional solute properties[14-19]. Iyer et al[20] have developed a methodology called membrane-interaction (MI)-QSAR analysis, where structure-based design methodology is combined with classic intramolecular QSAR analysis to model different compounds interacting with cellular membranes. They have also built a predictive model of BBB penetration of organic compounds by simulating the interaction of an organic compound with the phospholipide-rich region of cellular membranes. As a result, they indicated that BBB penetration of an organic compound depended upon PSA, ClogP, and the conformational flexibility of the compounds as well as the strength of their "blinding" to the model biologic membrane. The BBB penetration process can be reliably described for structurally diverse molecules whose interactions with the phospholipide-rich regions of cellular membranes are explicitly considered. There are other important applications of MI-QSAR analysis. For example, it can be used as a computational approach to estimate ADME properties such as the transport of organic solutes through biological membranes; and by this way, we can forecast intestinal absorption[21] of drugs and construct MI-QSAR model for skin irritation[22], and eye irritation[23]. However, as a prediction measure, the MI-QSAR computational model is itself somewhat inconvenient. It is quite easily susceptible to manipulation during the prediction process, and so models with more reliability can still have a reasonable-looking MI-QSAR model. Moreover, there are several non-MI-QSAR computational models including other descriptors besides PSA and ClogP reported to describe and predict BBB penetration. Lombardo and colleagues[17] reported about computing BBB penetration of organic solutes via free energy calculations. Keseru et al[24] clarified a high-throughput prediction of BBB penetration of organic molecules using a thermodynamic approach. Crivori et al[25] elucidated a method to predict BBB penetration from a three-dimensional molecular structure. Their research results showed that the BBB penetration only relies on one or two descriptors, which leads to the simplification of the prediction model of BBB.
In this article, we focus on constructing the predictive models of BBB penetration of organic compounds on the basis of QSAR analysis and MI-QSAR analysis.
Materials and methods
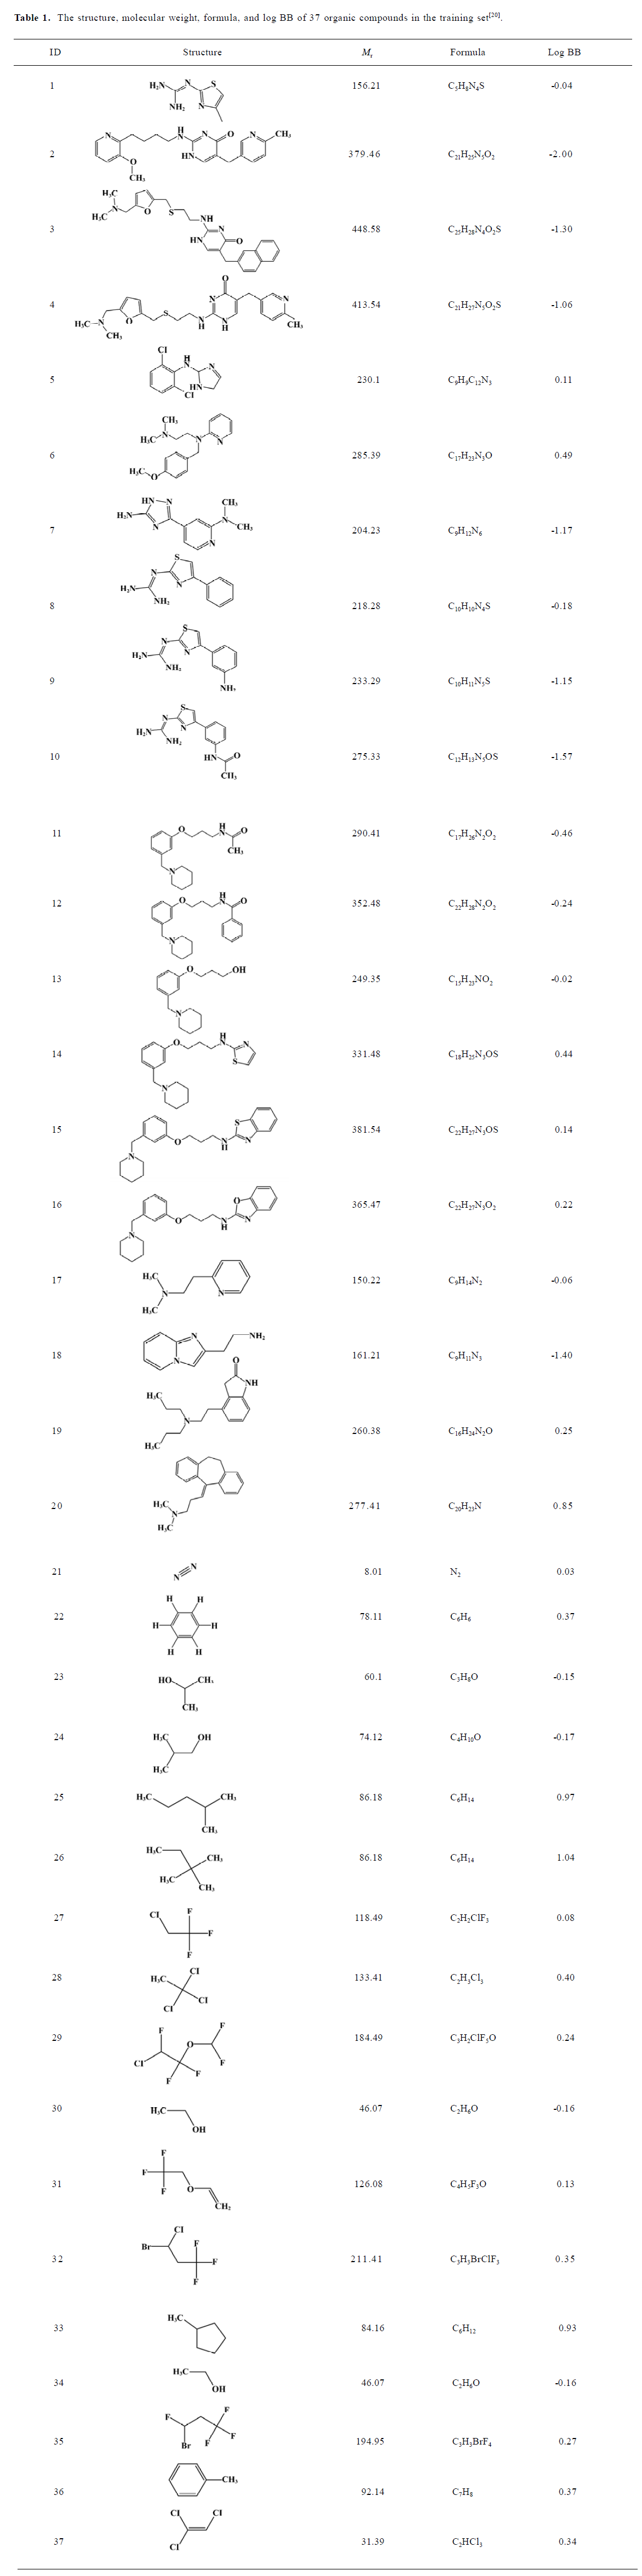
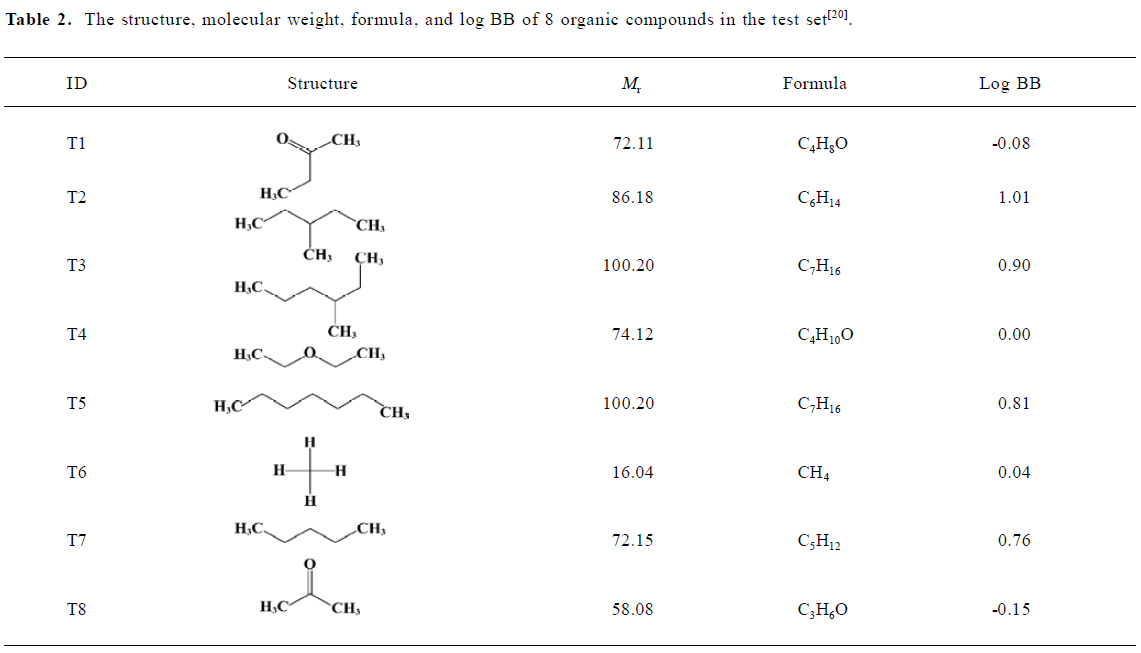
Building solute molecules A training set of 37 organic compounds[26,27] (Table 1) and a test set of 8 organic compounds (Table 2) were selected. These compounds had ranges in molecular weights from 16.03 to 448.58, whose concentrations in blood and brain (Cblood and Cbrain) were measured in units of mmol/L, and there were variations in net charge at pH 7.4[26]. The dependent variable used in this theoretical model was the logarithm of the BBB partition coefficient, log BB=log (Cbrain/Cblood)[27]. Experimental values of log BB published to date covered the range of about -2.00 to +1.04. Within this range, compounds with log BB>0.30 cross the BBB readily while compounds with log BB<-1.00 are poorly distributed to the brain[20,27]. All these compounds were built on a PC computer using the Build module of the commercial software packages Hyperchem 6[28]. First, the geometry of these compounds were opitimized using the Amber 94 force field in gas state. Second, they were placed in a periodic solvent box whose volume was X=16Å, Y=10Å, Z=18Å, which included 96 water molecules. Here, temperature was 300 K and pressure was 101.325 kPa. Then the compounds in water were minimized by the above method. Third, the compounds in water were simulated by the Monte Carlo method and minimized by the above method.
Full table
Full table
Molecular modeling of a DMPC membrane monolayer complex with a layer of water (DMPC-water model) A model of dimyristoylphosphatidylcholine (DMPC) membrane monolayer was constructed using the software Material Studio[29], and minimized for 200 steps with the smart minimizer. According to the work done by van der Ploeg and Berendsen[30], the DMPC monolayer was composed of 25 DMPC molecules (5×5×1).
Here, the unit cell parameters used for building the DMPC monolayer were a=8Å, b=8Å, and γ=96.0º, which yield an average surface area per phospholipid of 64Å2 that was similar to Stouch's research results[31]. Moreover, we added a layer of water (40×40×10) including 529 water molecules to the polar side of the DMPC monolayer.
Molecular dynamic simulation (MDS) of a solute-membrane-water complex In order to prevent unfavorable van der Waals interactions between a solute molecule and the membrane DMPC molecules, one of the "center" DMPC molecules was removed from the DMPC-water model and an organic compound (solute) was inserted in the space created by the missing DMPC molecule to form a solute-membrane-water complex. The solute was inserted at three different positions in the DMPC-water model and three corresponding MDS models were generated for each compound. MDS of the complex was performed for 1000 steps using Material Studios[29] with a Compass force field. Here, the three-dimensional volume was restricted to a boundary of X=40Å, Y=40Å, Z=91.76Å, and γ=96.0º.
Calculation of descriptors Most of the intramolecular solute descriptors were calculated by the commercial software packages CS Chem3D Ultra7.0[32], which included molecular mechanism (MM) parameters, quantum chemistry parameters, hydrophobic parameters (such as ClogP), stereo parameters (such as Es and Balaban Index) and so on. The MM parameters comprised bending energy, stretch-bend energy, torsion energy, total energy, van der Waals energy and others. The quantum chemistry parameters consisted of electronic energy, HOMO energy, LUMO energy, total energy, and so on. The data of molecular PSA (polar surface area) came from Iyer and colleagues[20].
The intermolecular solute-membrane interaction descriptors were extracted directly from the MDS trajectories in which the solute-membrane-water complex had the lowest energy geometry. These descriptors were mainly energy parameters. The total energy of a system could be expressed as follows[20]:
Here, the valence interactions include bond stretching (bond), valence angle bending (angle), dihedral angle torsion (torsion), and inversion, also called out-of-plane interactions (oop) terms, which are part of nearly all forcefields for covalent systems. In addition, a Urey-Bradley term (UB) may be used to account for interactions between atom pairs involved in 1, 3 configurations (ie, atoms bound to a common atom). Evalence=Ebond+Eangle+Etorsion+Eoop+Eup. Modern (second-generation) forcefields generally achieve higher accuracy by including crossterms to account for such factors as bond or angle distortions caused by nearby atoms. Crossterms can include the following terms: stretch-stretch, stretch-bend-stretch, bend-bend, torsion-stretch, torsion-bend-bend, bend-torsion-bend and stretch-torsion-stretch. The interaction energy between non-bonded atoms is accounted by van der Waals, electrostatic (Coulomb), and hydrogen bond terms in some older forcefields. Enon-bond= Evan-der-Waals+ECoulomb+Ehydrogen-bond. Restraints that can be added to an energy expression include distance, angle, torsion, and inversion restraints. Restraints are useful if you, for example, are interested in only part of a structure for information on restraints and their implementation, use, and also the documentation for the particular simulation engine.
Construction and testing of MI-QSAR models MI-QSAR models of some organic compounds through BBB were constructed by partial sum of squares for regression using software SPSS. A training set of 37 structurally diverse compounds whose BBB partition coefficients had been measured was used to construct MI-QSAR models. MDSs were used to determine the explicit interaction of each test compound with the DMPC-water model. An additional set of intramolecular solute descriptors were computed and considered in the trial pool of descriptors for building MI-QSAR models. The QSAR models were optimized using multidimensional linear regression fitting and stepwise method. A test set of 8 compounds was evaluated using the MI-QSAR models as part of a validation process.
Results
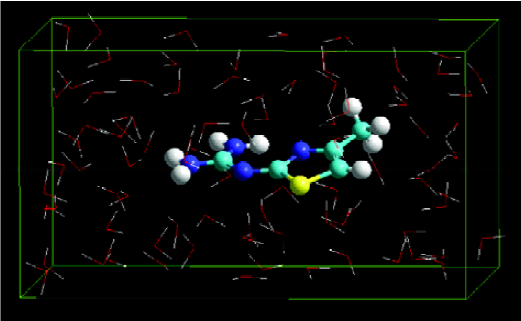
Building solute molecules A training set of 37 organic compounds and a test set of 8 organic compounds were built and minimized, dissolved in liquid, and optimized by Monte Carlo method and MM. Finally, the dominant conformations of these compounds were obtained (Figure 1).
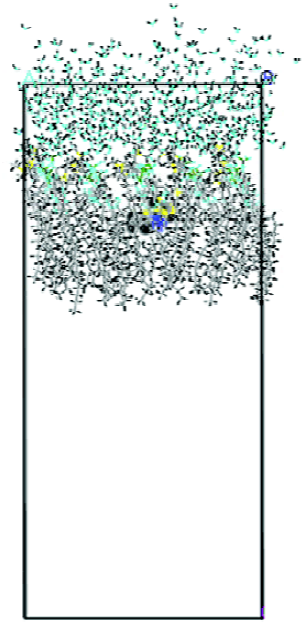
MDS of a solute-membrane-water complex The result revealed that the energy of a solute inserted at the middle position of the DMPC-water model was lower than that of the other two positions. Figure 2 shows the dominant conformation of a solute-membrane-water complex in the MDS.
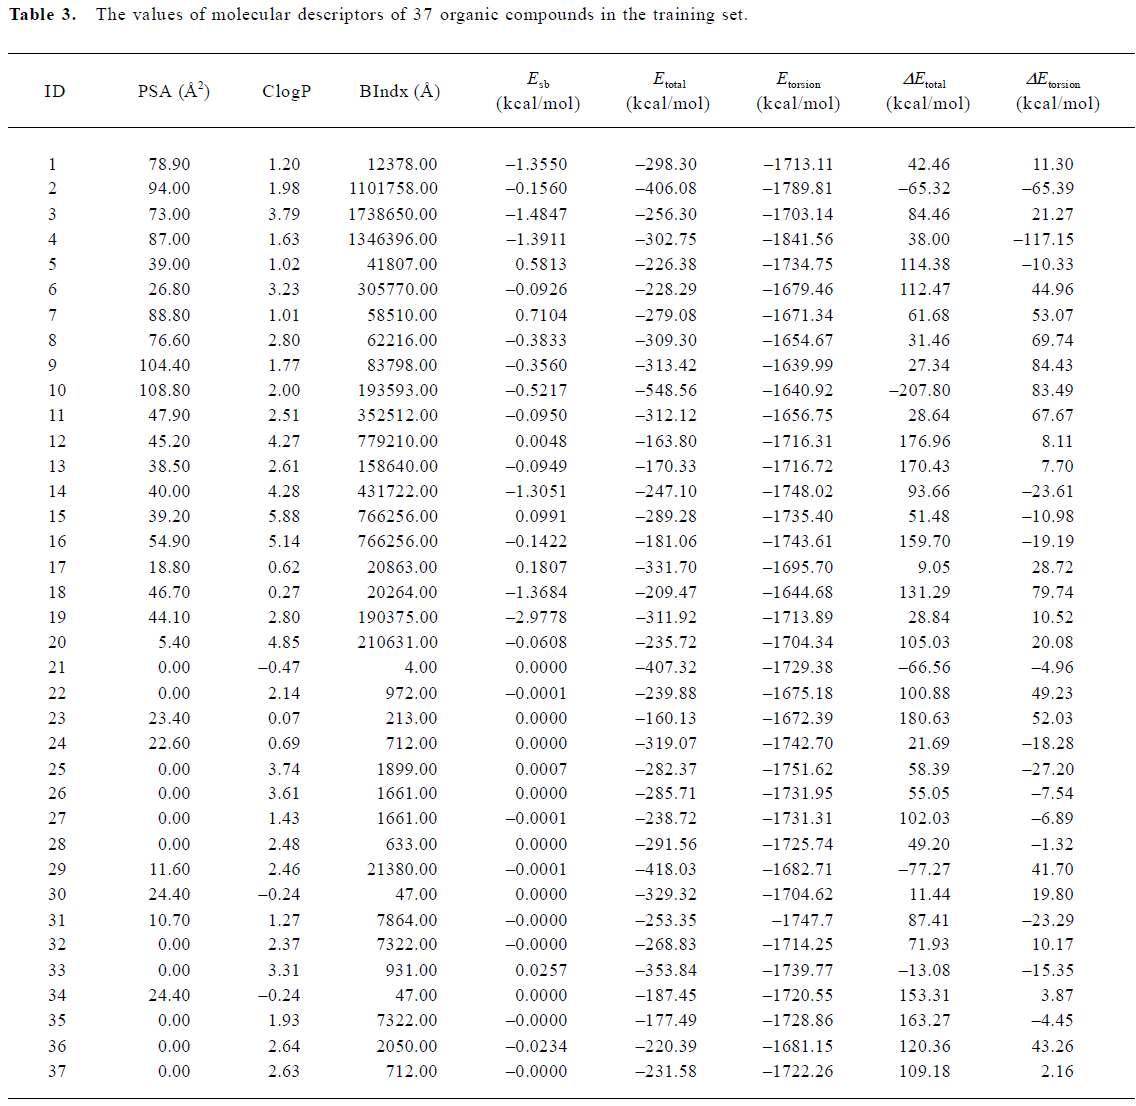
Construction and testing of MI-QSAR models MI-QSAR analysis was used to develop predictive models of some organic compounds through BBB and to simulate the interaction of a solute with the phospholipide-rich regions of cellular membranes surrounded by a layer of water. Molecular descriptors of 37 compounds in the training set were listed in Table 3. Six MI-QSAR equations were constructed based on Table 3 and were listed as follows:
Full table
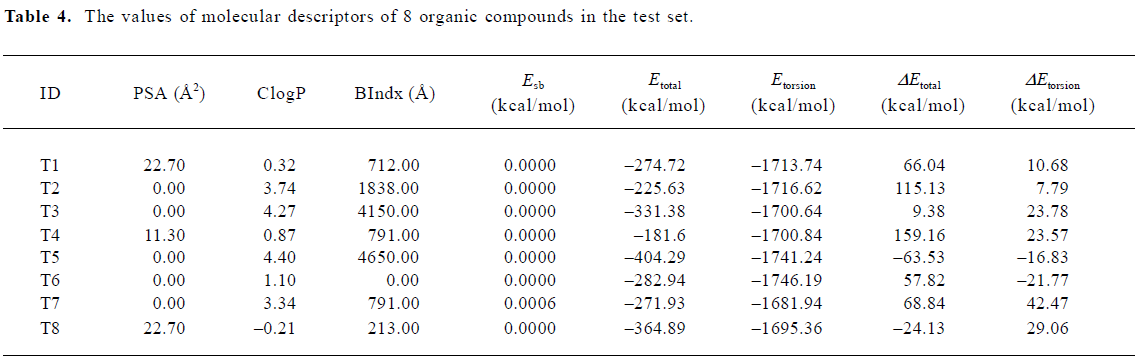
where PSA is the polar surface area, ClogP is the calculated logP (the logarithm of the partition coefficient for octanol/water), BIndx is the Balaban Index, namely connective index of molecular average total distance (relative covalent radius), and Esb is the stretch-bend energy of a molecule. These intramolecular solute descriptors came from CS calculation. In addition, calculated from the MDS, intermolecular descriptors ΔEtotal and ΔEtorsion are related to interactions between a solute and the DMPC-water model. They display the change in the total potential energy and the dihedral torsion energy of the solute-membrane-water complex comparing with that of the DMPC-water model, respectively. Here, n is the number of organic compounds, R is the correlation coefficient, and S is the standard deviation Table 4.
Full table
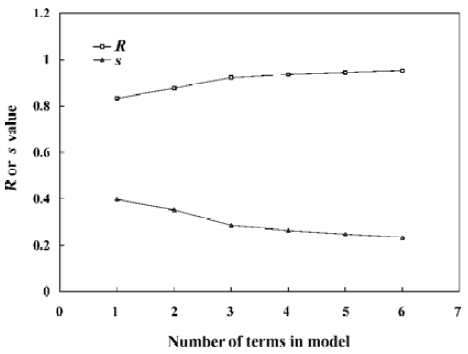
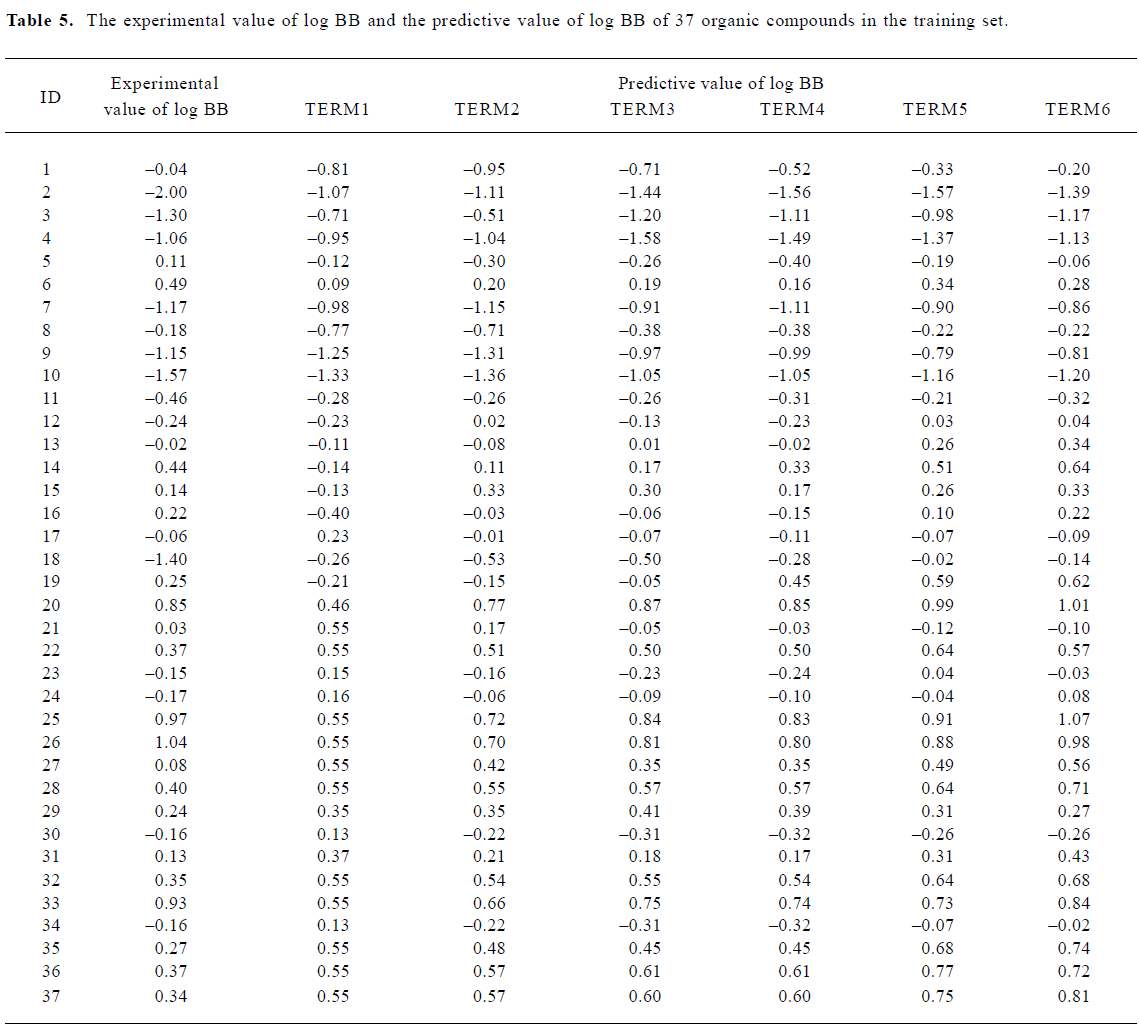
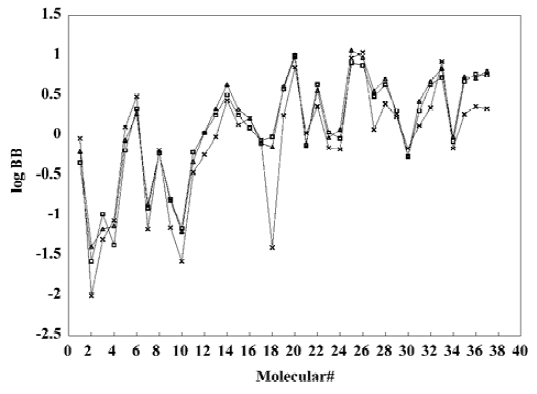
With the increase of the variable from one to six, the relativity of MI-QSAR equations was also improved, and the predictive ability of the models was enhanced. Figure 3 displaye a diagnostic plot of the MI-QSAR models. Here, equation 6 was the most significant, which means that the capability of an organic compound through BBB depends upon PSA, ClogP, BIndx, Esb, ΔEtotal, and ΔEtorsion. Moreover, the potential of an organic compound through BBB is directly proportional to ClogP and ΔEtotal, but inversely proportional to PSA, BIndx, Esb, and ΔEtorsion. The observed and predicted log BB values of the training set are listed in Table 5 and plotted in Figure 4. The predicted log BB value of compound 18 in the training set was much higher than observed, and this molecule has also been identified as an outlier in other studies[20]. Protonation of the molecule could account for its low log BB value.
Full table
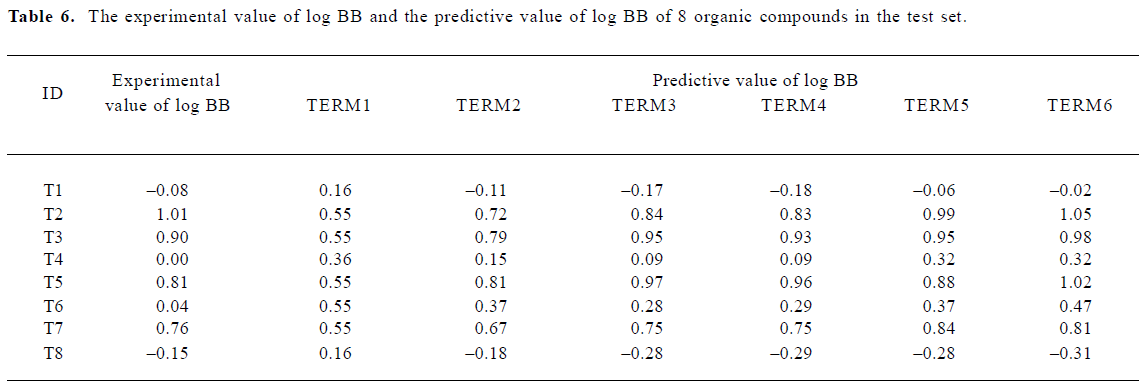
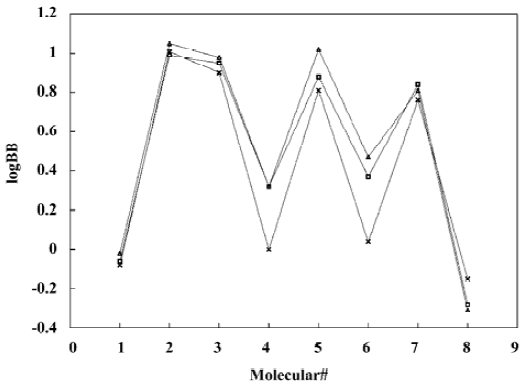
A test set of 8 organic compounds was constructed as a way to attempt to validate the MI-QSAR models given by the six equations mentioned. The compounds of the test set were selected so as to span almost the entire range in BBB penetration. The observed and predicted log BB values for this test set are given in Table 6 and plotted in Figure 5. It seems that the 5?6 terms MI-QSAR models could predict log BB for other compounds in drug design.
Full table
Discussion
We have built up a theoretical model of BBB penetration of organic compounds by simulating the interaction of an organic compound with the phospholipid-rich regions of cellular membranes. The family of these MI-QSAR models reveal that the capability of an organic compound through BBB focus on six significant features, which are PSA, ClogP, BIndx, Esb, ΔEtotal, and ΔEtorsion. The descriptor PSA is found as a dominant descriptor in these MI-QSAR models, which is related to the aqueous solubility of the solute and can be used as a direct lipophilicity descriptor[19]. When the value of PSA lessens within the range from 0 to 108.80Å2, the value of log BB will increase. This is consistent with the experimental result that the higher polarity it possesses, the more difficultly a molecule enters the hydrophobic environment of BBB[31]. Along with PSA, many descriptors can display various other kinds of the hydrophobic parameters of compounds, such as ClogP. In some cases it may be appropriate to display the parameter in the form of meshes, such as PSA. The higher the hydrophobic property, the greater the value of ClogP is. And the value of log BB of a molecule increases with the increase of ClogP. It means that the hydrophobic molecule can pass through BBB more easily than the hydrophilic molecule does, which is supported by the experimental results[33]. As stated, BIndx is the connective index of molecular average total distance, which pertains to the volume parameter. Our research result reveals that with the accretion of its bulk, a molecule becomes more and more difficult to cross over BBB by diffusion. The presence of the descriptor Esb suggests that with the decrease of the stretch-bend energy the value of log BB increases.
Interestingly, the other two descriptors,ΔEtotal, andΔEtorsion, reflect the interaction of the solute with the membrane and the behavior of the entire membrane-solute complex. Here, the more the value ofΔEtotal changes, the more the value of log BB increases. This is because that small molecule acrossing the BBB membrane leads to the change in the structure of the complex, which therefore, results in a greater change of total potential energy, and the accretion of the energy change is the most important cause for the increase of BBB penetration of small molecules. In contrast, the less the difference in the torsion energy is, the larger the value of log BB is. It displays that a small molecule tightly combined with the membrane-water complex has a higher value of log BB. The relationship suggests that as the solute becomes more flexible within the membrane-water complex, its log BB value would increase, which is in agreement with the research results by Iyer et al[20].
As an extra bonus of our work, we have developed an extension of traditional computational approaches that combines QSAR with solute-membrane-water complex. There is an obvious difference between our method and Iyer's method, which is the addition of a layer of water on the hydrophilic side of the DMPC membrane monolayer. So it is more analogous to the true BBB environment. Our results revealed that the distribution of organic molecules through BBB was not only influenced by the properties of organic solutes, but also related to the property of the solute-membrane-water complex. The former involves the polarity, hydrophobicity, size, and conformational freedom degree of organic molecules. The latter deals with the strength of an organic molecule to combine with the BBB membrane and the structural changeability of a solute-membrane-water complex. Moreover, the capability of a small molecule across BBB is mainly related to four physicochemical factors, which are the relative polarity of a small molecule, the molecular volume, the strength of a small molecule to combine with DMPC-water model, and the changeability of the structure of a solute-membrane-water complex. The MI-QSAR model shows that, relatively, less polar and more hydrophobic small molecules, which tightly combine with the membrane-water complex and are more flexible within the complex, can easily pass through BBB and enter the brain to be effective. In drawing conclusions from our model, it seldom matters if one or two parameters are slightly off (eg, BIndx), but it is often critical if some parameters are actually in the wrong value (eg, ClogP, PSA, or Esb): that will change which molecules are in a position to penetrate through BBB.
Incidentally, since the molecular structures in the training set are not very comparable, our MI-QSAR equations possess universal significance. Nevertheless, the precision of the MI-QSAR equation is so low that there is still some time before it can be applied. If a series of organic compounds with similar structures were chosen to construct a training set, the precision of MI-QSAR simulation may be largely increased, while the prediction of the analogues through BBB will be greatly improved.
In conclusion, we have developed an extension of traditional computational approaches that combines QSAR with solute-membrane-water complex to simulate the BBB environment, which resembles Iyer's method, but differs from it by adding a layer of water on the hydrophilic side of the DMPC membrane monolayer. Our modified MI-QSAR method is more approximate to the body condition than Iyer's MI-QSAR analysis and possesses higher ability to predict organic compounds across BBB. Moreover, while still applying the structural information in a two-dimensional, "structure-function relationship" fashion, this method also takes into account the powerful three-dimensional information displayed by membrane structures, and thus improves existing MI-QSAR method. The MI-QSAR models indicate that the distribution of organic molecules through BBB was not only influenced by organic solutes themselves, but also related to the properties of the solute-membrane-water complex, that is, interactions of the molecule with the phospholipid-rich regions of cellular membranes.
References
- Bickel U, Yoshikawa T, Pardridge WM. Delivery of peptides and proteins through the blood-brain barrier. Adv Drug Deliv Rev 2001;46:247-79.
- Hosoyo K, Ohtsuki S, Terasaki T. Recent advances in the brain-to-blood efflux transport across the blood/brain barrier. Int J Pharm 2002;248:15-29.
- Pardridge WM. Molecular biology of the blood-brain barrier. Methods Mol Med 2003;89:385-99.
- Nag S. Immunohistochemical detection of endothelial proteins. Methods Mol Med 2003;89:489-502.
- Tsuji A, Tamai I. Carrier-mediated or specialized transport of drugs across the blood-brain barrier. Adv Drug Deliv Rev 1999;36:277-90.
- Tamai I, Tsuji A. Drug delivery through the blood-brain barrier. Adv Drug Deliv Rev 1996;19:401-2.
- Jette L, Murphy GF, Leclerc JM, Beliveau R. Interaction of drugs with P-glycoprotein in brain capillaries. Biochem Pharmacol 1995; 50: 1701?9.
- Chen W, Mehta SC, Lu DR. Selective boron drug delivery to brain tumors for boron neutron capture therapy. Adv Drug Deliv Rev 1997;26:231-47.
- Friden PM. Utilization of an endogenous cellular transport system for the delivery of therapeutics across the blood-brain barrier. J Control Release 1997;46:117-28.
- Begley DJ. The blood-brain barrier: Principles for targeting peptides and drugs to the central nervous system. J Pharm Pharmacol 1996;48:136-46.
- Anderson BD. Prodrugs for improved CNS delivery. Adv Drug Deliv Rev 1996;19:171-202.
- Pardridge WM. CNS drug design based on principles of blood-brain barrier transport. J Neurochem 1998; 70: 1781?92.
- Cornford EM, Hyman S. Blood-brain barrier permeability to small and large molecules. Adv Drug Deliv Rev 1999;36:145-63.
- Liu R, Sun H, So SS. Development of quantitative structure-property relationship models for early ADME evaluation in drug discovery. 2. Blood-brain barrier penetration. J Chem Inf Comput Sci 2001; 41: 1623?32.
- Rogers D, Hopfinger AJ. Applications of genetic function approximation to quantitative structure-activity relationships and quantitative structure-property relationships. J Chem Inf Comput Sci 1994;34:854-66.
- Abraham MH, Chadha HS, Mitchell RC. Hydrogen bonding factors that influence the distribution of solutes between blood and brain. J Pharm Sci 1994;83:1257-68.
- Lombardo F, Blake JF, Curatolo WJ. Computation of brain-blood partitioning of organic solutes via free energy calculations. J Med Chem 1996;39:4750-5.
- Luco JM. Prediction of brain-blood distribution of a large set of drugs from structurally derived descriptors using partial least squares (PLS) modeling. J Chem Inf Comput Sci 1999;39:396-404.
- Clark DE. Rapid calculation of polar molecular surface area and its application to the prediction of transport phenomena. 2. Prediction of blood-brain barrier penetration. J Pharm Sci 1999;88:815-21.
- Iyer M, Mishra R, Han Y, Hopfinger AJ. Predicting blood-brain barrier partitioning of organic molecules using membrane-interaction QSAR analysis. Pharm Res 2002; 19: 1611?21.
- Kulkarni A, Han Y, Hopfinger AJ. Predicting Caco-2 cell permeation coefficients of organic molecules using membrane-interaction QSAR analysis. J Chem Inf Comput Sci 2002;42:331-42.
- Kodithala K, Hopfinger AJ, Thompson ED, Robinson MK. Prediction of skin irritation from organic chemicals using membrane-interaction QSAR analysis. Toxicol Sci 2002;66:336-46.
- Kulkarni A, Hopfinger AJ, Osborne R, Bruner LH, Thompson ED. Prediction of eye irritation from organic chemicals using membrane-interaction QSAR analysis. Toxicol Sci 2001;59:335-45.
- Keseru GM, Molnar L. High-throughput prediction of blood-brain partitioning: A thermodynamic approach. J Chem Inf Comput Sci 2001;41:120-8.
- Crivori P, Cruciani G, Carrupt PA, Testa B. Predicting blood-brain barrier permeation using three-dimensional molecular structure. J Med Chem 2000;43:2204-16.
- Abraham MH, Chadha HS, Mitchell RC. Hydrogen bonding. Part 36. Determination of blood-brain barrier distribution using octanol-water partition coefficients. Drug Des Discov 1995;13:123-31.
- Abraham MH, Takacs-Novak K, Mitchell RC. On the partition of ampholytes: Application to blood-brain distribution. J Pharm Sci 1997;86:310-5.
- Hyperchem HyperChem. Release 6.0 for MS Windows. Waterloo, Ontario, Hypercube Inc, 2001.
- Materials Studios. San Diego, USA, Accelrys Inc, 2001
- van der Ploeg P, Berendsen HJC. Molecular dynamics simulation of a bilayer membrane. J Chem Phys 1982;76:3271-6.
- Stouch TR. Lipid membrane structure and dynamics studied by all atom molecular dynamics simulations of hydrated phosphatidylcholine vesicles. Mol Simulation 1993;1:335-62.
- Chemoffice 2002 CS Chem3D Ultra7.0. Cambridge, USA, Cambri-dgesoft Inc, 2002
- Kaliszan R, Markuszewski M. Brain-blood distribution described by a combination of partition coefficients and molecular mass. Int J Pharm 1996;45:9-16.