
Modulating effect of adenosine deaminase on function of adenosine A1 receptors1
Introduction
Adenosine is a ubiquitous physiological regulator and neuromodulator capable of ultiple physiological actions in various systems[1]. Adenosine receptors are members of the G-protein-coupled receptor superfamily, and comprise A1, A2a, A2b, and A3 adenosine receptors, identified by convergent data from molecular, biochemical, and pharmacological studies[2]. A1R is widely expressed in the brain, adipose tissue,the testis, and the spinal cord[3]. Via A1R, adenosine reduces heart rate[4], glomerular filtration rate, and renin release in the kidney[5], induces bronchoconstriction[6,7] and inhibits lipolysis. A1R can be coupled to different pertussis toxin-sensitive G proteins[8–10], which mediate the inhibition of adenylyl cyclase[11 ] and regulate Ca2+ and K+ channels and inositol phosphate metabolism[12]. A1R present two different affinities for agonists, which have classically been attributed to a different coupling to heterotrimeric G proteins[13], coupled receptor-G protein complexes display high affinity for A1R agonists, whereas uncoupled receptors display low affinity[13,14].
Adenosine deaminase (ADA, E.C.3.5.4.4) is an enzyme which catalyzes the hydrolytic deamination of adenosine to inosine. ADA is located both in the cytosol and on the cell membrane. Recent evidence suggest that ecto-ADA had extra-enzymatic and co-stimulatory functional roles. ADA modulates ligand binding and signaling through A1R on DDT1MF-2 cells, a smooth muscle cell line[15]. ADA seems to be necessary for the high affinity binding of agonists to A1R[16,17]. In the present study, the effect of ADA on the ligand-mediated regulation of A1R in HEK293 cells stably expressing human A1R has been studied.
Materials and methods
Materials High glucose Dulbecco’s modified Eagle’s medium (DMEM), fetal calf serum, G418, benzylpenicillin and streptomycin were obtained from Gibco. Restricted enzyme (HindIII, EcoRI, XhoI), T4 DNA ligase, reverse transcriptase enzyme and buffer were purchased from Promega (USA). Pyrobest DNA polymerase and PCR buffer were obtained from TaKaRa (Dalian, China). N6-cyclopentyladenosine (CPA), 8-cyclopentyl-1,3-dipropylxanthine (DPCPX), and 2-Chloro-N6-cyclopentyladenosine (CCPA) were obtained from RBI (Natick, MA, USA). Adenosine deaminase was obtained from Roche Biochemicals (Mannheim, Germany). Fluo-3/AM, p-(dipropylsulfamoyl)benzoic acid, pluronic F-127, HEPES, Triton X-100, bovine serum albumin, leupeptin, pepstatin A, aprotinin and PMSF were purchased from Sigma (USA). [3H]DPCPX was purchased from Amersham (USA). Plasmids pcDNA3, pcDNA3.1(+), and Lipofectamine2000 were purchased from Invitrogen (USA). Human embryo brain tissue was donated by Huashan Hospital (Shanghai, China). PCR primers were synthesized by Shenyou (Shanghai, China).
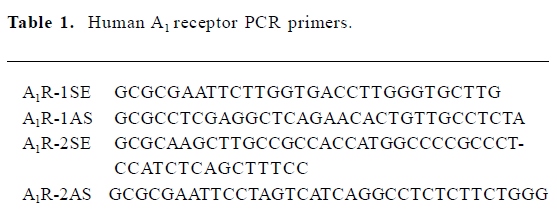
Cloning of the human A1R cDNA Human brain total RNA was obtained from human embryo brain tissue. The total RNA was reverse-transcribed using oligo-dT18 as a primer. With the cDNA, PCR was carried out using the primers A1R-1SE and A1R-1AS (Table 1). Gel-purified PCR product was treated with EcoRI/XhoI and subcloned into the EcoRI/XhoI site of the mammalian expression vector pcDNA3. With the subcloned A1R-pcDNA3 plasmid as template, PCR was carried out using the primers A1R-2SE and A1R-2AS (Table 2), which resulted in full length codon sequence cDNA. Gel-purified PCR product was treated with HindIII/EcoRI and cloned into the HindIII/EcoRI site of the mammalian expression vector pcDNA3.1(+).
Production of HEK293 cell lines stably expressing human A1R HEK293 Cells were transfected with the A1R-pcDNA3.1(+) expression vector, using the Lipofectamine2000 reagent. Cells were treated with selection medium containing G418 (1 g/L) for 3 weeks to select stably transfected cells displaying neomycin resistance. Between 2 and 3 weeks in the selection process, resistant cells began to appear. They were sought out by serial dilutions and allowed to grow from single cells. Receptor expression of single cell-derived colonies was tested by radioligand binding assay.
Cell culture Human embryonic kidney (HEK293) cells were cultured in DMEM containing streptomycin (100 mg/L), benzylpenicillin (1000 kU/L) and fetal bovine serum (10%). Cells were incubated at 37 °C in 5% CO2. Stably transfected HEK293 cell lines were cultured in DMEM high glucose medium containing streptomycin (100 mg/L), benzylpenicillin (1000 kU/L), G-418 (200 mg/L), and fetal bovine serum (10%). Cells were incubated at 37 °C in 5% CO2. For passaging, the cells were detached from the cell culture flask by washing with phosphate-buffered saline (PBS) and brief incubation with trypsin (0.5 g/L)/EDTA (0.2 g/L). The cells were passaged every 3 d.
Membrane preparation The A1R cells (HEK293 cells stably expressing human A1R) were lifted from Petri dishes with a cell scraper. Harvested cells were washed twice with ice-cold PBS and centrifuged at 420×g for 5 min at 4 °C. The cell pellet was resuspended with hyponic buffer (Tris-HCl 5 mmol/L, EDTA 2 mmol/L, pH 7.4, leupeptin 1 mg/ L, pepstatin A 1 mg/L, aprotinin 1 mg/L, PMSF 1 mmol/ L) and sonicated (18 s) three times on ice. The homogenate was centrifuged at 960×g for 10 min at 4 °C. The precipitated nucleic fraction was discarded and the supernatant was centrifuged at 40 000×g for 30 min at 4 °C. The pellet was washed with 50 mmol/L Tris-HCl buffer (pH 7.4) and centrifuged again under the same conditions. Finally, the pellet was resuspended in the same buffer, and protein concentration was determined by using the BCA Kit (Pierce) as described previously[18].
[3H]DPCPX binding assays in intact cells and membranes Binding assays in intact cells were performed in a reaction tube at a density of 2.0×10⁵ cells per tube, using [3H]DPCPX as a radioligand. Cells were resuspended in 50 mmol/L Tris-HCl (pH 7.4) and treated with ADA 65 nmol/L at 4 °C for 30 min[17]. After this treatment, cells were incubated for 1 h at 37 °C with [3H]DPCPX 0.5 nmol/L for competition assays. Different concentrations of the A1R agonist CCPA or CPA were used in the competition curves.
Membranes (30–50 µg proteins) from A1R cells were resuspended in Tris-Cl 50 mmol/L (pH 7.4) and treated with ADA 65 nmol/L at 4 °C for 30 min. Saturation assays were performed at different concentrations of [3H]DPCPX (0.05–10 nmol/L) using unlabeled DPCPX (20 µmol/L) to obtain nonspecific binding. Competition curves were carried out by using [3H]DPCPX 0.5 nmol/L and different concentrations of A1R agonists CCPA or CPA.
After incubation for 1 h, the binding assays were stopped by rapid filtration through Whatman GF/B filters, and the filters were immediately washed three times with ice-cold buffer. Filters were then transferred to Eppendoff tubes, and scintillation liquid was added to measure the radioactivity.
Intracellular Ca2+ measurements Ca2+ fluorescence measurements were performed using a NOVOstar plate reader with a pipettor system (BMG labtechnologies, Offenburg, Germany). A1 cells were harvested with 0.05% trypsin/0.02% EDTA and rinsed with high glucose DMEM containing 10% fetal bovine serum, streptomycin 100 mg/L, and benzylpenicillin 1000 kU/L. Pelleted cells were resuspended in fresh medium and kept under 5% CO2 at 37 °C for 1 h and vortexed every 15 min. After two washes with Krebs-HEPES buffer, cells were loaded with Fluo-3/AM 5 µmol/L for 30 min containing 1% pluronic F-127 and p-(dipropyl-sulfamoyl)benzoic acid 2.5 mmol/L. Then cells were rinsed 3 times with Krebs-HEPES buffer containing 0.5% bovine serum albumin, the diluted, and evenly plated into 96-well plates at a density of 1×10⁴ cells/well. Microplates were kept at 37 °C for 15 min[19,20]. Buffer alone or different concentrations of CPA were then injected sequentially into separate wells, and fluorescence intensity was measured at 520 nm for 50 s at 0.2 s intervals. The excitation wavelength was 485 nm.
[Ca2+]i was calculated as follows: [Ca2+]i=Kd (F-Fmin)/(Fmax-F). Fmax refers to fluorescence intensity measured after permeabilization of the cells with 1% Triton X-100. Ten mmol/L EDTA was added to chelate Ca2+ and minimum fluorescence intensity was obtained (Fmin). A Kd value of 324 nmol/L was used for Fluo-3.
Data analysis Experiments were performed in triplicate. All data were expressed as mean±SD and data were analyzed with the GraphPad Prism 4.0 program (GraphPad Software, San Diego, CA, USA). Student’s t-test was used for statistical analysis.
Full table
Full table
Results
Cloning of the human adenosine A1R cDNA To obtain the cDNA with the full length codon sequence of human A1R, a reverse transcription reaction was carried out using the total RNA extracted from human embryo brain tissue. Using cDNA with full length codon sequence of A1R, a PCR product (1332 bp) was obtained using primers described previously. The PCR product subcloned into a pcDNA3 plasmid and cDNA (981 bp) containing the full A1R codon sequence was obtained using this subcloned vector as a template. The cDNA was then cloned into the mammalian expression vector pcDNA3.1. Sequence analysis demonstrated that the sequence of the constructed A1R-pcDNA3.1 expression vector was identical to that of human A1R cDNA in the gene bank.
Selection of cell clones Colonies of the selected stable integrants were initially analyzed for human A1R expression by using a receptor binding assay using [3H]DPCPX. From the transfected HEK293 cell clones, one cell line was obtained with specific [3H]DPCPX binding.
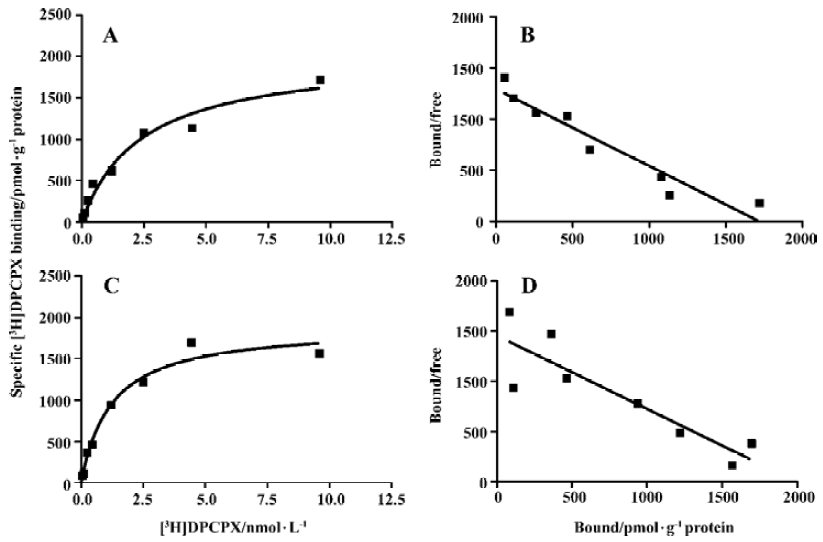
Saturation experiments with the adenosine A1 receptor antagonist [3H]DPCPX As Figure 1 shown, no significant difference was found between the A1R cells in the absence and presence of ADA with respect to the Bmax and KD values for the A1R binding sites labeled with [3H]DPCPX. The Bmax values for the A1R cells were 1.819±0.215 and 1.992±0.130 nmol/g of protein (n=3) in the absence and presence of ADA, respectively. The KD values for the A1R cells were 1.6±0.2 and 1.3±0.2 nmol/L (n=3) in the absence and presence of ADA, respectively. The nonspecific binding was <5% of the total binding.
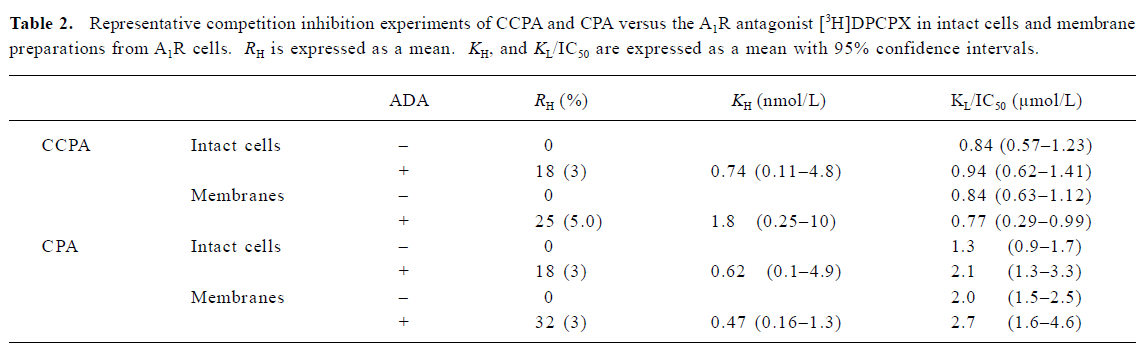
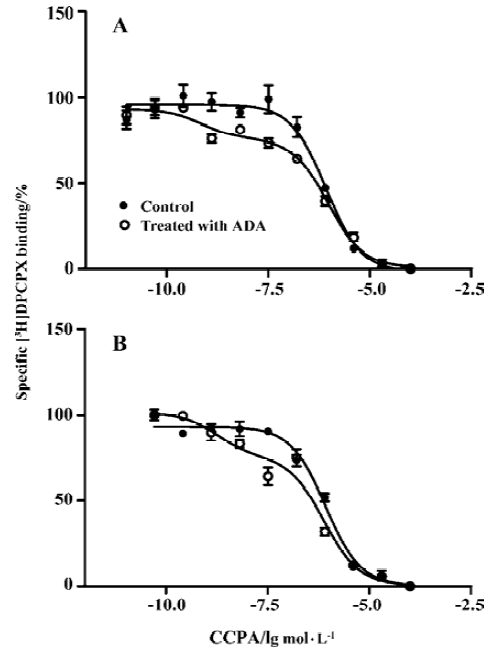
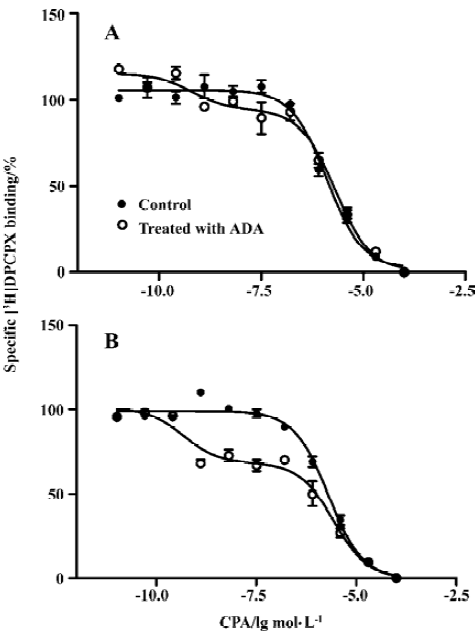
Competition experiments of A1R agonist CCPA or CPA versus the A1R antagonist [3H]DPCPX Competition experiments with CCPA versus the A1R antagonist [3H]DPCPX in intact A1R cells or membrane preparations from A1R cells incubated previously with ADA showed a significantly better fit with the 2 binding sites model than that with the 1 binding site model (F test, P<0.05). Similar KH and KL values were obtained in intact cells or membrane preparations from A1R cells incubated previously with ADA, and the proportions of the A1R in the high affinity state (RH values) were 18%±3% and 20%±5%, respectively (Figure 2 and Table 2). In intact A1R cells or membrane preparations from A1R cells in the absence of ADA, a significant better fit for one binding site (RH =0) was obtained, with the IC50 values very similar to the KL value obtained in intact cells or membrane preparations previously treated with ADA. Similar results were obtained from competition experiments with CPA versus the adenosine A1R antagonist [3H]DPCPX in intact A1R cells or membrane preparations from A1 cells in the absence of ADA (Figure 3, Table 2).
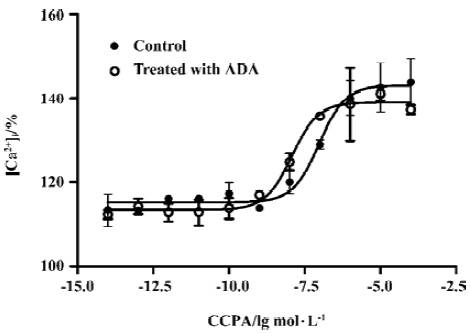
Effects of A1R agonist CPA on intracellular calcium level in the presence or absence of ADA An increase in intracellular Ca2+ appears to be a universal second messenger signal for a majority of recombinant GPCRs[20]. A1R agonists evoked a concentration-dependent and reproducible Ca2+ signal at A1R[22]. To assess the effect of the presence of ADA on A1R signal transduction, we performed an intracellular calcium assay. A significant difference was found between the A1R cells in the absence and presence of ADA with respect to the EC50 values of A1R agonist CPA. A1R agonist CPA induced an intracellular [Ca2+] increase. The EC50 values for the A1R cells in the absence and presence of ADA were 94 (38–229) and 10 (5–29) nmol/L, respectively. CPA appears more potent at the A1 cells in the presence of ADA compared with the A1R cells in the absence of ADA (Figure 4).
Discussion
Recently, several evidences demonstrated that cell-surface ADA interacted with A1 receptors in brain cortex and DDT1MF-2 cells and that the enzyme was able to modulate ligand binding and signaling through A1R[16,21–23]. By immunoprecipitation and affinity chromatography, it was found that ADA and A1R interacted in pig brain cortical membranes. By means of this interaction ADA led to the appearance of the high-affinity site of the receptor. Thus, it seems that ADA is necessary for coupling A1R to heterotrimeric G proteins[16]. In Chinese hamster ovary (CHO) cells, stably transfected with the human adenosine A1R, it was found that in the presence of ADA, the [3H]DPCPX/cyclohexyladenoine competition curve could be analysed by a two-site model with 93% of the sites having high affinity and the remainder having low affinity. In the absence of ADA, the [3H]DPCPX/cyclohexyladenosine competition curve was well described by a two-site model. Under these conditions, 70% of the binding of [3H]DPCPX was associated with a high-affinity site with the remaining sites having low affinity. Thus there is a clear difference in the potency of cyclohexyladenosine at the high-affinity state[24]. In the present study, human adenosine A1R were cloned and stably expressed in the HEK293 cells and the effects of ecto-ADA on adenosine A1R were studied. By using competitive inhibition assay of adenosine A1R agonists CCPA or CPA against [3H]DPCPX, we found that A1R displayed two different affinities for agonists in the presence of ADA. However, A1R only displayed a low affinity for agonists in the absence of ADA, suggesting that most of the binding of [3H]DPCPX was associated with the low-affinity site under these conditions and that the interaction of ADA with A1 adenosine receptors led to the appearance of the high-affinity site of the receptor.
To further demonstrate possible interaction between A1R and ADA, intracellular calcium assay was carried out in the present studies. The results demonstrated that the EC50 value of CPA for inducing increase of intracellular calcium level was lower in the presence of ADA than that in the absence of ADA, suggesting that the presence of ADA may promote signaling through A1 receptors in the stably transfected HEK293 cells. Our results further support the notion that ADA may promote the signaling through A1 receptors.
Footnote
Project supported by the National Natural Science Foundation of China (N
References
- Wlliams M. Purine receptors in mammalian tissues:pharmacology and functional significance. Annu Rev Pharmacol Toxicol 1987;27:315-45.
- Ralevic V, Burnstock G. Receptors for purines and pyrimidines. Pharmacol Review 1998;50:413-92.
- Ren H, Stiles G L. Characterization of the human A1 adenosine receptor gene: evidence for alternative splicing. J Biol Chem 1994;269:3104-10.
- Amoah-Apraku B, Xu J, Lu JY, Pelleg A, Bruns RF, Belardinelli L. Selective potentiation by an A1 adenosine receptor enhancer of the negative dromotropic action of adenosine in the guinea pig heart. J Pharmacol Exp Ther 1993;266:611-7.
- Spielman WS, Arend LJ. Adenosine receptors and signaling in the kidney. Hypertension 1991;17:117-30.
- el-Hashim AD, Agostino B, Matera MG, Page C. Characterization of adenosine receptors involved in adenosine-induced bronchoconstriction in allergic rabbits. Br J Pharmacol 1996;119:1262-8.
- Nyce JW, Metzger WJ. DNA antisense therapy for asthma in an animal model. Nature 1997;385:721-5.
- Munshi R, Pang IH, Sternweis PC, Linden J. A1 adenosine receptors of bovine brain couple to guanine nucleotide-binding proteins Gi1, Gi2 and Go. J Biol Chem 1991;266:22285-9.
- Jockers R, Linder ME, Hohenegger M, Nanoff C, Bertin B, Strosberg AD, et al. Species difference in the G protein selectivity of the human and bovine A1-adenosine receptor. J Biol Chem 1994;269:32077-84.
- Figler RA, Graber SG, Lindorfer MA, Yasuda H, Linden J, Garrison JC. Reconstitution of recombinant bovine A1 adenosine receptors in Sf9 cell membranes with recombinant G proteins of defined composition. Mol Pharmacol 1996;50:1587-95.
- Londos C, Cooper DM, Wolff J. Subclasses of external adenosine receptors. Proc Natl Acad Sci USA 1980;77:2551-4.
- Palmer TM, Stiles GL. Adenosine receptors. Neuropharmacology 1995;34:683-94.
- Lohse MJ, Lenschow V, Schwabe U. Two affinity states of Ri adenosine receptors in brain membranes. Analysis of guanine nucleotide and temperature effects on radioligand binding. Mol Pharmacol 1984;26:1-9.
- Casado V, Canti C, Mallol J, Canela EI, Lluis C, Franco R. Solubilization of A1 adenosine receptor from pig brain: characterization and evidence of the role of the cell membrane on the coexistence of high- and low-affinity states. J Neurosci Res 1990;26:461-73.
- Ciruela F, Casado V, Mallol J, Canela EI, Lluis C, Franco R. Immunological identification of A1 adenosine receptors in brain cortex. J Neurosci Res 1995;42:818-28.
- Saura C, Ciruela F, Casado V, Canela EI, Mallol J, Lluis C, et al. Adenosine deaminase interacts with A1 adenosine receptors in pig brain cortical membranes. J Neurochem 1996;66:1675-82.
- Saura CA, Mallol J, Canela EI, Lluis C, Franco R. Adenosine deaminase and A1 adenosine receptors internalize together following agonist-induced receptor desensitization. J Biol Chem 1998;273:17610-7.
- Sorensen K, Brodbeck U. Assessment of coating-efficiency in ELISA plates by direct protein determination. J Immunol Methods 1986;95:291-3.
- Sun WC, Jin L, Cao Y, Wang LZ, Meng F, Zhu XZ. Cloning, expression, and functional analysis of human dopamine d1 receptors. Acta Pharmacol Sin 2005;26:27-32.
- Kassack MU, Hofgen B, Lehmann J, Eckstein N, Quillan JM, Sadee W. Functional screening of G protein-coupled receptors by measuring intracellular calcium with a fluorescence microplate reader. J Biomol Screen 2002;7:233-46.
- Franco R, Casado V, Ciruela F, Saura C, Mallol J, Canela EI, et al. Cell surface adenosine deaminase: much more than an ectoenzyme. Prog Neurobiol 1997;52:283-94.
- Ciruela F, Saura C, Canela EI, Mallol J, Lluis C, Franco R. Adenosine deaminase affects ligand-induced signalling by interacting with cell surface adenosine receptors. FEBS Lett 1996;380:219-23.
- Escriche M, Burgueno J, Ciruela F, Canela EI, Mallol J, Enrich C, et al. Ligand-induced caveolae-mediated internalization of A1 adenosine receptors: morphological evidence of endosomal sorting and receptor recycling. Exp Cell Res 2003;285:72-90.
- Cohen FR, Lazareno S, Birdsall NJ. The affinity of adenosine for the high- and low-affinity states of the human adenosine A1 receptor. Eur J Pharmacol 1996;309:111-4.