
Osteogenic-related gene expression profiles of human dental follicle cells induced by dexamethasone1
Introduction
Considerable attention has been paid to dental follicle cells originating from the dental follicle surrounding the developing tooth germ, because they harbor progenitor cells which play a crucial role in the development of the periodontium structure. Substantial evidence exists indicating that dental follicle cells are progenitors of periodontal cells, including cementoblasts, periodontal ligament (PDL) fibroblasts, and alveolar osteoblasts[1,2]. When triggered appropriately, dental follicle cells are considered to be able to differentiate toward a cementoblast/osteoblast phenotype. The differentiation capacity of these follicle cells was proven by in vivo tests with severe combined immunodeficient mice in which dental follicle cells formed a cementum-like matrix as opposed to bovine PDL fibroblasts or bovine alveolar osteoblasts[3,4].
Many studies have been variably successful in developing systems that can promote the osteo/cementoblast lineage differentiation of dental follicle cells[5–10]. Morsczeck and colleagues documented the isolation of dental follicle cells from 2 individual human dental follicles by their ability to adhere on a plastic surface and established osteogenic differentiation protocols with dexamethasone (DEX) and insulin[11]. Although the expression of several critical transcripts like osteocalcin (OCN) and bone morphogenic protein (BMP) 2 have been shown to increase during osteogenic differentiation of human dental follicle cells (hDFC), more multifactorial evaluations based on the high-throughput screening of osteogenic-related genes may better elucidate the molecular mechanisms characterizing this process. DNA microarray represents more advantageous molecular technology that enables the analysis of gene expression on a very large number of genes, spanning a significant fraction of the human genome[12]. It can be applied to carry out qualitative and quantitative analyses of gene expression since it has the sensitivity to detect a change of expression level in the investigated cells when compared to normal samples. However, no such analysis has been performed to elucidate the changes in the molecular level in osteogenic differentiation of hDFC to date.
In the present study, we successfully induced hDFC into mineralized cells by DEX treatment, as indicated by elevated alkaline phosphatase (ALP) activity and calcified nodule formation. Then we described large-scale gene expression analyses in hDFC by using GEArray Q series human osteogenesis gene array (Superarray Bioscience, Bethesda, MD, USA), which identified differentially-regulated genes responsible for osteogenic differentiation. Then 7 critical transcripts closely related to osteogenic differentiation revealed by microarray analysis were confirmed by real-time RT–PCR. It can be supposed from the present study that differentially-regulated genes and their interactions contribute to the osteogenic differentiation of hDFC.
Materials and methods
Cell culture Healthy human (12–15 years) impacted third molars extracted for orthodontic reasons with informed consent were used. The study protocol was approved by the medical ethic committee of the Fourth Military Medical University (Xi-an, China). Material from 2-4 tooth explants was pooled and supported 1 hDFC culture. The mineralized teeth, including any dental hard tissues and alveolar bone fragments, were separated from the dental follicle tissue. The surfaces of the follicle tissues were cleaned, rinsed in Dulbecco’s modified Eagle’s medium (DMEM; Gibco-BRL, Grand Island, NY, USA), and minced. The dental papilla tissue was discarded. The follicles were then incubated in 0.25% trypsin/1 mmol/L EDTA solution for 10 min at 37 °C to dissociate the follicle cells. Cells were seeded at a density of 5000 cells/cm2 and incubated in DMEM/F12 (Gibco-BRL, USA) containing 15% fetal calf serum, 0.1 g/L sodium pyruvate, 100 µg/mL streptomycin, and 100 U/mL penicillin, and cultured at 37 ℃ in a humidified atmosphere of 5% CO2. Non-adherent cells were removed 24 h later and replaced with fresh medium. Adherent cells were continuously propagated until confluence. Third passage hDFC were used for the experiments.
Osteogenic induction of hDFC by DEX DEX (Sigma, St Louis, MO, USA) was dissolved in DMEM media with 10% fetal bovine serum at a final concentration of 1×10⁻⁸ mol/L and applied to third passage hDFC for up to 4 weeks with medium change every 3 d. Then the culture medium was removed from the cells. The cells were washed twice with 0.01 mol/L phosphate-buffered saline (PBS) and then fixed with 4% formaldehyde/0.1 mol/L PBS at 4 ℃ for 30 min. After 1 week of culture, treated and untreated third passage hDFC were routinely observed and photographed under phase-contrast inverted microscopy (Olympus, Tokyo, Japan) to evaluate their morphology.
Analysis of ALP activity of induced hDFC To investigate the effect of osteogenic differentiation induced by DEX, ALP activity was analyzed. Third passage hDFC were seeded onto 24-well plates (5×10³ cells/well) and cultured under DEX conditioned or routine medium, as described earlier. The quantitative ALP activity analysis was determined according to the detailed description in a previous report[13]. ALP activity was measured d 1, 7, and 14. Three samples were taken at each measurement. The amount of p-nitrophenyl released by the enzyme reaction was measured at 405 nm using a microplate reader (Bio Tek, winooski, vermemt, USA). ALP activity was always expressed relative to the amount of DNA assessed with a PicoGreen dsDNA quantitation kit (Molecular Probes, Eugene, OR, USA).
Alizarin red S staining After 4 weeks of treatment, the calcium deposition of hDFC was studied using 0.1% alizarin red S staining solution (Sigma, USA). When nodule formation was detected at d 14, the samples were fixed with 4% polyoxymethylene for 15 min, rinsed twice with PBS, and stained with 0.1% alizarin red solution at 37 ℃ for 30 min. The amount of alizarin red that had bound to the mineral in each dish was quantified according to a reported method[14].
Expression profiling and data analysis Parallel batches of treated and untreated third passage hDFC were used for the hybridization studies. In the treated group, hDFC were induced by DMEM with DEX at concentration of 1×10⁻⁸ mol/L for 4 weeks. Total RNA was extracted from the treated and non-treated hDFC with Trizol. The pellet of total RNA was washed briefly with 75% ethanol, and resuspended in 20 µL diethylpyrocarbonate (DEPC)-treated water. The total RNA was then treated with DNase I (Gibco-BRL, USA) for removal of any DNA contamination. The quantity and purity of the RNA were measured by a spectrophotometer. Expression profiling was performed with the use of the GEArray Q series human osteogenesis gene array containing 96 genes correlating with bone formation. DEX-treated and control RNA (1.5 µg total) were used as a template to generate biotin-16-dUTP-labeled cDNA probes, according to the manufacturer’s instructions. The cDNA probes were denatured and hybridized at 60 ℃ with the osteogenesis SuperArray membrane. The membrane was then washed, exposed using a chemiluminescent substrate, and analyzed by scanning the X-ray film and importing the image into Adobe Photoshop (Adobe Systems Inc, San Jose, California, USA). The image file was inverted, and spots were digitized using ScanAlyze software version 2.51 (http://rana.lbl.gov/EisenSoftware.htm), and normalized by subtracting the background as the average intensity value of 3 spots containing plasmid DNA (PUC18). The average of 2 GAPDH spots were used as positive controls and set as baseline values to which the signal intensity of other spots was compared. Using this normalized data, the signal intensity from the membranes was compared using the GEArray analyzer program. To assess the reliability and repeatability of the methods, the probes from original total RNA were respectively synthesized from the same batch of cells of 3 parallel groups, and hybridization experiments were repeated 3 times with membranes stripped by boiling in a 0.5% SDS solution. Data were presented as mean±SD. In the present study, a significant change in the gene expression level was defined to be not less than a 2-fold change or not more than one-half of the change in signal density. All differentially expressed spots on filters were confirmed visually, and representative images were chosen.
Quantitative real-time RT–PCR To confirm the gene expression data of DNA microarrays, we selected 7 important transcripts and subjected them to reverse real-time RT–PCR analysis. In brief, total RNA, which were identical to that used as targets for array hybridization, were treated by DNase I to remove genomic DNA contamination and then reverse transcribed using the iScript cDNA synthesis kit (Bio-Rad Laboratories, Hercules, CA, USA). Human GAPDH was used as the normalization control in the quantitative analysis. The sequences for the primers were as follows: GAPDH forward: 5´-GAA GGT GAA GGT CGG AGT C-3´, reverse: 5´-GAA GAT GGT GAT GGG ATT TC-3´; collagen 1 (COL1) α1 forward 5´-AGG GCC AAG ACG AAG ACA TC-3´, reverse 5´-AGA TCA CGT CAT CGC ACA ACA-3´; OCN forward 5´-ATG AGA GCC CTC ACA CTC CTC-3´, reverse 5´-GCC GTA GAA GCG CCG ATA GGC-3´; BMP2 forward: 5´-ACC TTT ATG GAG GGA AAC CCA-3´, reverse: 5´-CCG GAT CTG GTT CAA GCA TGA-3´; ALP forward: 5´-CCC AAA GGC TTC TTC TTG-3´, reverse: 5´-CTG GTA GTT GTT GTG AGC-3´; transforming growth factor (TGF)-β1 forward: 5´-GCG TGC TAA TGG GTG GAA AC-3´, reverse: 5´-CGG TGA CAT CAA AAg ATA ACC AC-3´; small mothers against decapentaplegic (Smad) 6 forward: 5´-GGC AAA CCC ATA GAG ACA CAA-3´, reverse: 5´-TGG AAT CGG ACA GAT CCA GTG-3´; And fibroblast growth factor receptor (FGFR)-1 forward: 5´-GTG GAG CCT TGT CAC CAA CC-3´, reverse: 5´-TCC ATC TCT TTG TCG GTG GTA T-3´. Quantitative real-time PCR was performed using approximately 200 ng cDNA and SYBR green PCR master mix together with the primer pairs in an ABI Prism 7100 system (Applied Biosystems Foster City, CA, USA) according to the standard protocol. Transcript quantification was performed in triplicate for every sample and reported to be relative to GAPDH.
Statistical analysis For the histomorphological analyses of implantation, all of the slides were examined by a single masked and calibrated examiner. The data in the ALP activity and quantitative PCR analysis were presented as mean±SD for each group. Student’s t-test was used for the variance analysis among the test groups. SPSS12.0 software package (SPSS, Chicago, IL, USA) was used for the statistical tests. P-values of less than 0.05 were considered to be statistically significant.
Results
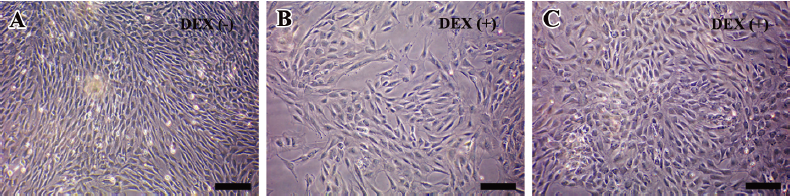
Morphological changes of hDFC after DEX treatment Representative phase-contrast micrographs of hDFC in standard and osteogenic monolayer culture conditions are shown in Figure 1. Although appearing polymorphic, the predominant cells were fibroblastic in shape, elongated with processes at each pole. It was evident from Figure 1A that hDFC cultured in the standard medium showed little difference in terms of morphology from previous reports[15]. In the DEX-treated group, some cells lost their fibroblastic morphology and became flatter and polygonal as early as the first week of induction (Figure 1B). The proportion of these round-shaped cells to fibroblasts continued to increase throughout the entire culture period and constituted the majority of the whole population at confluence (Figure 1C).
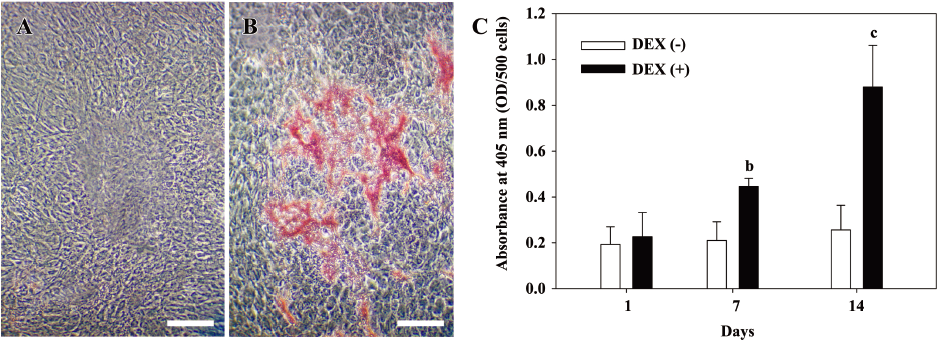
DEX treatment promoted the mineralization ability of hDFC The deposition of calcium, an indicator of osteogenic differentiation, was determined by alizarin red S staining. While no alizarin red-positive grains were detected in the control group at d 14 (Figure 2A), obvious nodules appeared in DEX-treated cells (Figure 2B) and increased remarkably with culture time. ALP activity was continuously assessed from initiation of DEX treatment to d 14 (Figure 2C). ALP activity was obviously higher under the induction of DEX compared with the non-induced group at d 7 and 14, and there were significant difference between the 2 groups (P<0.05 at 7 d and P<0.01 at 14 d).
Gene expression profile by microarray Using the GEArray analyzer software settings, a global expression analysis of genes associated with osteogenic differentiation was performed. The representative array image of the overall expression of the 96 genes in the DEX-treated cells and control group was shown (Figure 3). We obtained evidence that there were significant changes in the expression of 28 genes by hDFC cultured in the presence of DEX (Table 1). The results were expressed as a ratio of relative expression in DEX (+)/DEX (–). Among the 28 genes, the expression of 20 genes was identified as DEX-promoted genes, which were upregulated at least 2-fold in DEX-treated cells than the control. The expression of 8 genes was identified as DEX-downregulating genes, which showed a decrease of over 50% expression in DEX-treated cells than the control. In Table 1, the expression changes are expressed as the ratio of relative expression in DEX (+)/ DEX (–) in the form of mean±SD and the genes are ordered by the ratio. Collagen (COL) 1 α1 was the most increased gene (>10-fold). ALP, BMP, and most types of collagen expression were variably elevated, while different types of TGF-β and fibroblast growth factors (FGF) showed a differential expression trend. As inhibitors of TGF-β, Smads 6 and 7 were significantly decreased.

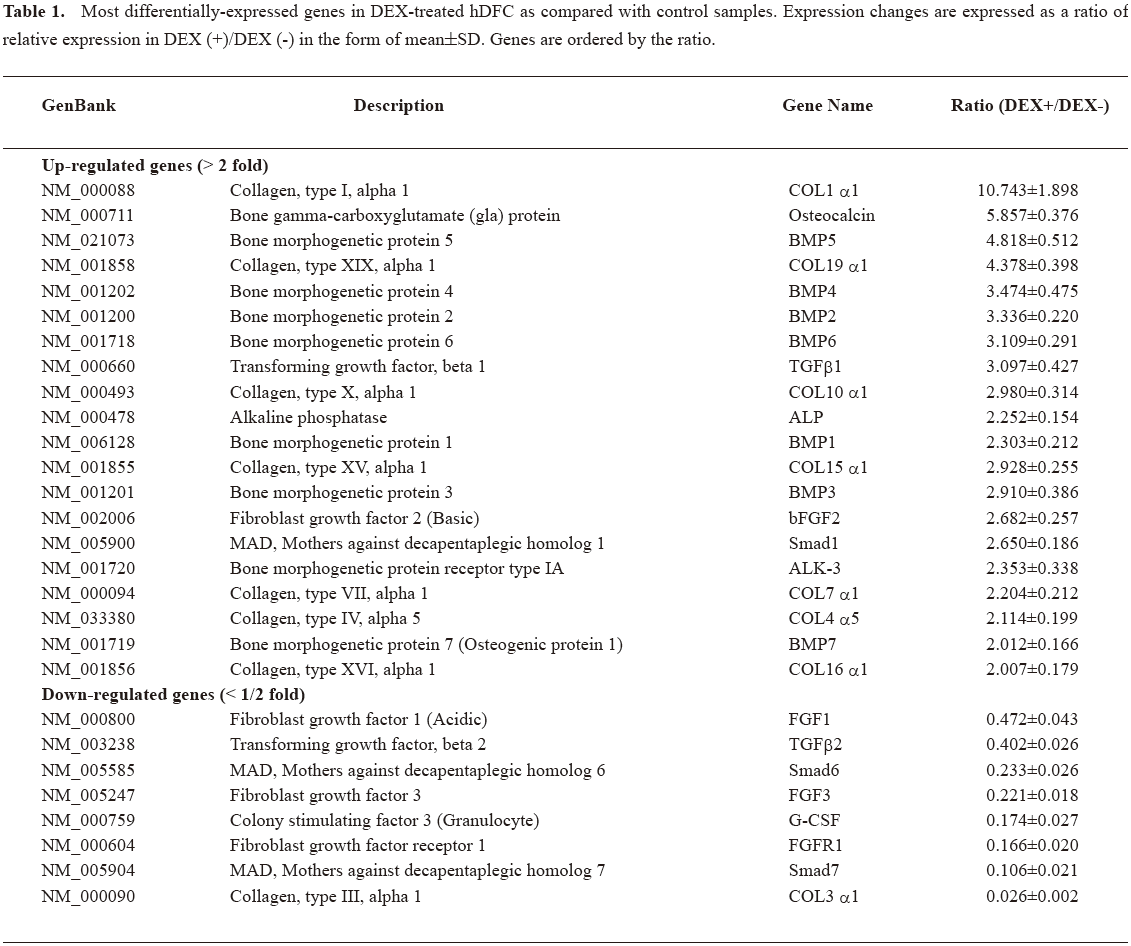
Full table
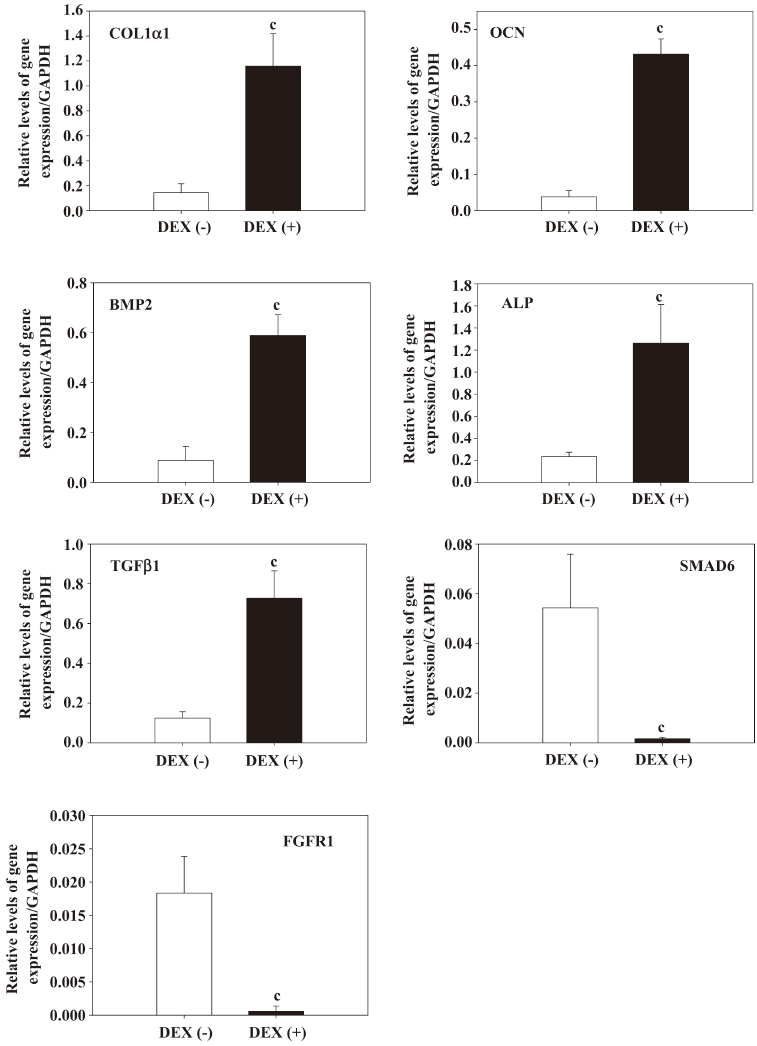
Quantitative real-time RT–PCR To verify the molecular signature of the osteogenic differentiation of hDFC revealed by the microarray result, we selected 7 representative genes for validation by real-time RT–PCR. The data showed that these 7 genes have significant differences between DEX (+) and the control group (Figure 4; P<0.01), corroborating the expression patterns obtained in the microarray experiments. Although variations in the changing expression levels of these genes existed, these results of the microarray enabled us to measure gene expression profiles of the hDFC in an authentic way.
Discussion
A number of studies have supported the suitability of the dental follicle cells for tissue regeneration on the basis of its capability to differentiate into cementum, periodontal ligament, and alveolar bone following stimulation with growth factors and extracellular matrix proteins[15,16]. The fact that dental follicle cells finally generate the 3 types of periodontal structure in a concomitant manner renders it as a good model for study of mineralization process. The DEX or insulin-based osteogenic induction protocols proposed by previous reports effectively drove hDFC towards osteogenic lineage[11]. Starting from these points, we decided to analyze the effect of DEX treatment on the osteogenic gene expression of hDFC by using high-throughput microarray-based technology in an in vitro system. With the confirmed effect of DEX on hDFC in terms of promotion of the mineralization activity, the hybridization of mRNA-derived probes to cDNA microarrays helped us to perform a systemic analysis of expression profiles for genes specifically related to osteogenic differentiation simultaneously, and to provide primary information on transcriptional changes during the induction course. Seven critical transcripts were confirmed to present a similar changing pattern of expression by quantitative real-time RT–PCR analysis. Our data provide the detailed objective evidence for several batches of genes whose expressions were remarkably upregulated or downregulated.
It has been postulated that the osteogenic lineage differentiation comprises several steps representative of cell proliferation, extracellular matrix synthesis, maturation, and mineralization[17]. The process is complex and the participating regulators consist of growth factors, matrix and its associated protein, and cell adhesion molecules. COL1, OCN gene expression, and mineralized nodule formation are classic indicators for osteogenic differentiation in cell culture[6]. The expressions of COL1 α1 and OCN were the most upregulated during in vitro DEX treatment, concerted with distinctly increased calcified nodule formation revealed by alizarin red S staining. ALP activity and gene expression after induction were both remarkably elevated and strongly indicative of mineralization events. Also, most types of collagen showed significant increase after DEX induction. These results confirmed that we succeeded in promoting osteogenic differentiation of hDFC by using DEX on a persuasive basis.
BMP and TGF-β1 as members of the TGF-β superfamily seem to be key regulatory molecules involved in bone formation and remodeling[18–20]. Both TGF-β and various BMP have been detected in fracture callus of both human and animal fracture models. Intensive bone formation was associated with a persistent increase in TGF-β1 and BMP2 expressions, suggesting both growth factors were active in promoting bone formation. The fact that BMP2 secreted at basal level in mouse dental follicle cells commits them to differentiate toward the osteo-cementoblastic phenotype supported that BMP are involved in osteo-cementoblast differentiation, periodontal development, and wound healing. Long-term stimulation with rhBMP2/7 or enamel matrix derivative (EMD) induced the expression of BMP2 and BMP7 by hDFC and increased the mineralization ability[8]. We performed microarray as well as quantitative PCR analysis on hDFC in which BMP1–BMP8 were included to obtain more insight into the mechanisms that govern DEX-induced differentiation of dental follicle cells. In the present study, we observed BMP1, BMP2, BMP3, BMP4, BMP5, BMP6, and BMP7 transcripts were upregulated, and only BMP8 not in dental follicle cells treated with DEX for 4 weeks. Morsczeck and colleagues[11] also reported the upregulation of the expression of BMP2 within osteoblast differentiation, followed by commitment and establishment of the bone phenotype in hDFC of DEX treatment. It was reported that BMP3 is a negative determinant of bone density[21]. However, in our experiment, BMP3 was also upregulated. While in vitro studies on TGF-β2 and TGF-β3 expressions have been poorly documented, TGF-β1 has been proposed as a central growth factor produced during bone healing and as an adjuvant therapy for bone induction in orthopedic surgical situations[18,22–24]. DEX not only increased the gene expression of TGF-β1 in our experiments, but as demonstrated by Morsczeck and colleagues, enhanced the expression of the fibronectin in similar conditions[11]. Our results suggest that TGF-β1 plays an important role in the process of differentiation of dental follicle cells to osteoblast-like cells. Using the microarray technique, we found that DEX upregulated TGF-β1 and downregulated TGF-β2 of hDFC, which partly resembled the pattern that different isoforms of TGF-β were differentially regulated by external stimulation as hypoxia or anoxia.
It is generally accepted that Smad proteins are primarily mediated the TGF/BMP signaling pathways[25,26]. Smads 6 and 7 are inhibitors of TGF-β, activin, and BMP signaling. One of the mechanisms proposed to explain the inhibitory effects of Smads 6 and 7 is that each of these Smads can bind to diverse TGF-β family receptors and interfere with the phosphorylation of receptor regulated Smads (R-Smads)[27]. For instance, Smad 7 associates stably with the TGF-β receptor complex and inhibits the TGF-β-mediated phosphorylation of Smads 2 and 3. Alternatively, another mechanism which may help to explain the selective inhibition of BMP signaling by Smad 6 suggests that at low concentrations, Smad 6 can compete with Smad 4 for binding to activated Smad 1 and block the BMP signaling pathway[28]. In our experiments, a significant increase in BMP, BMP receptor (BMPR), and Smad 1 expressions occurred concomitantly with a decreased expression of Smads 6 and 7 of DEX-treated dental follicle cells than the controls. Based on these observations we proved that Smads are involved in the differentiation of hDFC to osteoblasts under DEX induction. These results add weight to the notion that these transcripts may form a network of synergistic and antagonistic interactions to maintain an equilibration of differentiation state or towards osteogenic lineage.
Besides BMP, FGF are expressed in dental follicle cells involved in root- and ligament-forming stages and display synergistic effects with BMP proven by a synchronicity of expression levels in development and osteogenetic differentiation in vitro and in vivo[29,30]. Precursor cells from human dental follicles showed a positive expression of FGF receptor variants, including FGFR1, FGFR2, and FGFR3[31]. The results of our experiment revealed that DEX downregulated the expression of FGF1, FGF3, and FGFR1 and upregulated the expression of osteogenic growth factor basic fibroblast growth factor (bFGF)-2. This was in accordance with the findings that proved that FGF was variably expressed in different subpopulations constituting heterogeneous dental follicle cells.
In conclusion, we have identified a number of genes that are associated with the process of hDFC differentiation using a microarray approach for the first time. Our results demonstrated undoubtedly that hDFC display osteoblastic features in both phenotypic and genotypic traits after treatment with DEX. It might be highly interesting in future studies to determine the fine-tuned regulation of the genes responsible for osteogenic or non-osteogenic differentiation of hDFC in a more multifactorial evaluation.
References
- Ten Cate AR. The development of the periodontium-a largely ectomesenchymally derived unit. Periodontol 2000 1997;13:9-19.
- Bosshardt DD, Selvig KA. Dental cementum: the dynamic tissue covering of the root. Periodontol 2000 1997;13:41-75.
- Handa K, Saito M, Tsunoda A, Yamauchi M, Hattori S, Sato S, et al. Progenitor cells from dental follicle are able to form cementum matrix in vivo. Connect Tissue Res 2002;43:406-8.
- Handa K, Saito M, Yamauchi M, Kiyono T, Sato S, Teranaka T, et al. Cementum matrix formation in vivo by cultured dental follicle cells. Bone 2002;31:606-11.
- Hakki SS, Berry JE, Somerman MJ. The effect of enamel matrix protein derivative on follicle cells in vitro. J Periodontol 2001;72:679-87.
- Zhao M, Xiao G, Berry JE, Franceschi RT, Reddi A, Somerman MJ. Bone morphogenetic protein 2 induces dental follicle cells to differentiate toward a cementoblast/osteoblast phenotype. J Bone Miner Res 2002;17:1441-51.
- Morsczeck C. Gene expression of runx2, Osterix, c-fos, DLX-3, DLX-5, and MSX-2 in dental follicle cells during osteogenic differentiation in vitro. Calcif Tissue Int 2006;78:98-102.
- Kémoun P, Laurencin-Dalicieux S, Rue J, Farges JC, Gennero I, Conte-Auriol F, et al. Human dental follicle cells acquire cementoblast features under stimulation by BMP-2/-7 and enamel matrix derivatives (EMD) in vitro. Cell Tissue Res 2007;329:283-94.
- Chen XP, Qian H, Wu JJ, Ma XW, Gu ZX, Sun HY, et al. Expression of vascular endothelial growth factor in cultured human dental follicle cells and its biological roles. Acta Pharmacol Sin 2007;28:985-93.
- Wu J, Jin F, Tang L, Yu J, Xu L, Yang Z, et al. Dentin non-collagenous proteins (dNCPs) can stimulate dental follicle cells to differentiate into cementoblast lineages. Biol Cell 2008;100:291-302.
- Morsczeck C, Moehl C, Götz W, Heredia A, Schäffer TE, Eckstein N, et al. In vitro differentiation of human dental follicle cells with dexamethasone and insulin. Cell Biol Int 2005;29:567-75.
- van Hal NL, Vorst O, van Houwelingen AM, Kok EJ, Peijnenburg A, Aharoni A, et al. The application of DNA microarrays in gene expression analysis. J Biotechnol 2000;78:271-80.
- Zhang W, Walboomers XF, Wolke JG, Bian Z, Fan MW, Jansen JA. Differentiation ability of rat postnatal dental pulp cells in vitro. Tissue Eng 2005;11:357-68.
- Jo YY, Lee HJ, Kook SY, Choung HW, Park JY, Chung JH, et al. Isolation and characterization of postnatal stem cells from human dental tissues. Tissue Eng 2007;13:767-73.
- Hou LT, Liu CM, Chen YJ, Wong MY, Chen KC, Chen J, et al. Characterization of dental follicle cells in developing mouse molar. Arch Oral Biol 1999;44:759-70.
- Sena K, Morotome Y, Baba O, Terashima T, Takano Y, Ishikawa I. Gene expression of growth differentiation factors in the developing periodontium of rat molars. J Dent Res 2003;82:166-71.
- Shindo K, Kawashima N, Sakamoto K, Yamaguchi A, Umezawa A, Takagi M, et al. Osteogenic differentiation of the mesenchymal progenitor cells, Kusa is suppressed by Notch signaling. Exp Cell Res 2003;290:370-80.
- Joyce ME, Jingushi S, Bolander ME. Transforming growth factor-beta in the regulation of fracture repair. Orthop Clin North Am 1990;21:199-209.
- Joyce ME, Roberts AB, Sporn MB, Bolander ME. Transforming growth factor-beta and the initiation of chondrogenesis and osteogenesis in the rat femur. J Cell Biol 1990;110:2195-207.
- Bostrom MP. Expression of bone morphogenetic proteins in fracture healing. Clin Orthop Relat Res 1998.Suppl:S116-23.
- Daluiski A, Engstrand T, Bahamonde ME, Gamer LW, Agius E, Stevenson SL, et al. Bone morphogenetic protein-3 is a negative regulator of bone density. Nat Genet 2001;27:84-8.
- Barnes GL, Kostenuik PJ, Gerstenfeld LC, Einhorn TA. Growth factor regulation of fracture repair. J Bone Miner Res 1999;14:1805-15.
- Cho TJ, Gerstenfeld LC, Einhorn TA. Differential temporal expression of members of the transforming growth factor beta superfamily during murine fracture healing. J Bone Miner Res 2002;17:513-20.
- Blom EJ, Klein-Nulend J, Yin L, van Waas MA, Burger EH. Transforming growth factor-beta1 incorporated in calcium phosphate cement stimulates osteotransductivity in rat calvarial bone defects. Clin Oral Implants Res 2001;12:609-16.
- Massagué J. TGFbeta signaling: receptors, transducers, and Mad proteins. Cell 1996;85:947-50.
- Miyazono K, Kusanagi K, Inoue H. Divergence and convergence of TGF-beta/BMP signaling. J Cell Physiol 2001;187:265-76.
- Park SH. Fine tuning and cross-talking of TGF-beta signal by inhibitory Smads. J Biochem Mol Biol 2005;38:9-16.
- Hata A, Lagna G, Massagué J, Hemmati-Brivanlou A. Smad6 inhibits BMP/Smad1 signaling by specifically competing with the Smad4 tumor suppressor. Genes Dev 1998;12:186-97.
- Aberg T, Wozney J, Thesleff I. Expression patterns of bone morphogenetic proteins (Bmps) in the developing mouse tooth suggest roles in morphogenesis and cell differentiation. Dev Dyn 1997;210:383-96.
- Fakhry A, Ratisoontorn C, Vedhachalam C, Salhab I, Koyama E, Leboy P, et al. Effects of FGF-2/-9 in calvarial bone cell cultures: differentiation stage-dependent mitogenic effect, inverse regulation of BMP-2 and noggin, and enhancement of osteogenic potential. Bone 2005;36:254-66.
- Morsczeck C, Götz W, Schierholz J, Zeilhofer F, Kühn U, Möhl C, et al. Isolation of precursor cells (PCs) from human dental follicle of wisdom teeth. Matrix Biol 2005;24:155-65.