
Population pharmacokinetics of valproate in Chinese children with epilepsy1
Introduction
Valproate (VPA) is an important drug in the treatment of childhood epilepsy (EP) because of its broad therapeutic spectrum. Its efficacy in generalized seizures, absence seizures, myoclonic seizures and partial seizures, and its acceptable safety profile have made VPA a first-choice agent for a wide range of seizure disorders occurring in the children[1–3].
However, the use of VPA in children is complicated in clinical practice due to the variability of pharmacokinetics (PK), which is attributed to many factors, such as drug formulations, age, drug co-administration, and interactions[4,5]. In addition, VPA has potential toxicity for the digestive system, blood system, and liver function. Therefore, individualized VPA dosage regimens must be used. This can be most effectively done when individual PK parameter values are known[6].
PK is the science of determining the absorption, distribution, metabolism, and excretion of drugs in vivo. The traditional method for calculating individual PK parameters was to collect multiple (up to 7–10) blood samples from a single patient at different times after a single dose; then the values of individual PK parameters were calculated by using PK professional software. Nevertheless, the traditional method of calculating individual PK parameters needed more data-rich situations and was not always accepted by patients (especially children) because of pain, inconvenience, and the heavy economic burden it produced. A new way of determining individual doses uses population pharmacokinetics (PPK) and the Bayesian method to obtain individual PK parameters and has avoided the disadvantages of the traditional method. Many successful uses of PPK have been described[7–11].
Both domestic and foreign studies[11–20] on VPA have only collected data of trough concentrations, and only 1 parameter-CL/F could be analyzed and set up a final model of CL/F. However, a few studies[21,22] analyzed 3 parameters, including Ka and V/F of PPK. To our knowledge, at the time of the present study, there were few detailed studies of VPA concentrations establishing the PPK model by non-linear mixed effects modeling (NONMEM) software (NONMEM Project Group, University of California, San Francisco, California, USA), which lacked detailed information on the VPA PPK process of absorption, distribution, metabolism, and excretion. Therefore, in the present study, we used data of VPA concentrations from a group of Chinese children with EP to set up a PPK model and to explore 3 PPK parameters. We then used this model to see how well we could predict VPA serum concentrations in another group of similar children. This model will be valuable to facilitate individualized dosage regimens.
Materials and methods
Patients The enrolment criteria were as follows: (1) the children were diagnosed as having EP based on seizures and an electroencephalogram by a clinician; (2) the VPA therapy duration was over 5 half-lives (7 d) so as to ensure that the measured concentration was at steady-state trough; and (3) normal liver and kidney function. The exclusion criteria were as follows: (1) patients didn’t have good compliance; and (2) patients with serious adverse drug reaction.
Sparse therapeutic drug monitoring (TDM) data for VPA serum concentrations from 417 pediatric patients with EP at the Departments of Neurology and Pediatrics at Xuan-wu Hospital of Capital Medical University (Beijing, China) and the Department of Pediatrics at Peking University First Hospital (Beijing, China) were collected. The patients were from all over the country and were taking VPA either alone or concomitantly with other anti-epileptic drugs (AED), such as phenytoin, carbamazepine, phenobarbital, lamotrigine, and topiramate. The patients had no hepatic or renal disease. These VPA concentrations were steady-state serum concentrations and included peaks and troughs. All of the patients or their parents recorded all the dosages administered as well as the times of dosage administration and blood sampling. They were all judged to have had good compliance and the importance of good records was emphasized by their treating physicians[10,11,23].
The patients were divided into 2 groups: the PPK model group (n=317) and the PPK valid group (n=100). The PPK parameter values of VPA were calculated by NONMEM software with the data of 317 patients in the PPK model group, and then a basic and a final model were set up. To validate the basic and the final model, the concentrations of 100 patients in the PPK valid group were predicted by the 2 models, respectively. To assess the accuracy and precision of the concentration prediction, the mean prediction error (MPE), mean squared prediction error (MSPE), root mean squared prediction error (RMSPE), weight residues (WRES), and the 95% confidence intervals (95% CI) were all calculated. Then the values between the 2 models were compared[24–26].
The protocol for this study was approved by the Regional Ethics Committee, and consent was obtained from all the children and their parents.
Serum concentration assay The VPA serum concentrations were assayed by a fluorescence polarization immunoassay (Abbott Laboratories, Abbott Park, IL, USA). The mean±SD of the assay at the standard concentration points of 25, 50, 100, and 125 µg/mL were 25.33±0.91, 50.14±0.77, 101.04±0.56, and 122.67±1.69 µg/mL, respectively. Typical day-to-day coefficients of variation for the assay were less than 4%.
PPK model Parameterization According to previously published studies[11,27–31], the VPA concentrations can be fit by using a 1-compartment model and a first-order absorption process. VPA is largely metabolized by the liver and little is excreted by the kidney. Therefore, the PPK parameters were determined by using a 1-compartment, first-order oral absorption model.
PPK model of VPA The PK data were analyzed with the use of NONMEM. A 1-compartment model with a first-order absorption and first-order elimination from the central compartment (ADVAN 2) was used to fit the concentration-time data[12,29].
First, the basic structural model with interindividual variability was built. The model was parameterized for apparent clearance (CL/F), the apparent volumes of distribution of the central compartment (V/F), and the absorption rate constant (Ka).
CL/F=θCL/F·exp(ηCL/F); V/F=θV/F·exp(ηV/F); Ka=θKa·exp(ηKa).
Then, the covariate variability was introduced step-by-step and the full PPK model was built:
CL/Fj=θCL/F+θAGE·AGEj +θWT·WTj+θCOCOj+θHS·HSj
V/Fj=θV/F+θAGE·AGEj +θWT·WTj+θH·Hj+θHS·HSj
Kaj=θka+θAGE·AGEj +θWT·WTj+θHS·(1-HSj)
CL/Fj, V/Fj, and Kaj were jth patient’s population mean value, respectively; AGEj, WTj, and Hj were jth parient’s age (years), weight (kg), height (cm); HS (sustained-release tablet) was 1 in function when the sustained-release formulation was used, otherwise HS was 0. CO (comedication therapy) was 1 when comedication existed, otherwise, CO was 0. θAGE, θWT, θH, θHS, and θco were the structure coefficients of the full regressive model and were parameter values of age, weight, height, drug formulations, and comedication, respectively.
Finally, the final PPK model was set up.
Data analysis procedure Once the significant covariates were selected by the generalized additive model analysis, a stepwise forward and backward approach was applied so that each covariate was added or deleted one at a time. Sex, CO, and HS were the categorical covariates, respectively. These categorical covariates were modeled by the use of indicator variables. The influences of continuous covariates, such as age, weight, and height, as well as creatinine clearance, were also explored.
If it was possible, physiological relevance was considered in the covariate selection. However, the log-likelihood ratio test was the primary criterion used to determine the appropriateness of a selected covariate. A decrease in the objective function value of =3.84 (P<0.05, df=1) in an intermediate model compared with its previous model indicated that the full model was the superior model. If the difference in the objective function value was <3.84, then it was assumed that there was no significant difference between the 2 models, and the simpler reduced model (ie, without the covariate) was retained.
Finally, the model was refined by either reintroducing the previously deleted covariates or removing covariates that already existed in the model one at a time. In the refinement of the PPK analysis (FO method), more stringent cut-off values were applied when determining whether to include a certain covariate or not. A reduced model was preferred to a full model unless the objective function value increased more than 6.63 (P<0.01, df=1). However, the reduction of 3.84 was used as a statistical criterion for the full PPK analyses, in which the FOCE method was used.
Throughout the process of model development, graphic methods were also used to judge the general goodness of fit. Plots of observed versus model-based populations or individual predicted values, as well as various residual plots, were used to detect any significant systematic departure from the model fit.
During each step in the model building process, improvements to the model were assessed by evaluations of the agreement between the observed and predicted plasma concentrations, reductions in the range of weighed residuals, uniformity of the distribution of the weighed residuals versus the predicted concentrations of the line of identity, and increases in the precision of the parameter estimations, as well as the reduction of the interindividual variability and the random residual variability[24–26,32–35].
Statistical model When an influence of the fixed effect was not considered, individual PK parameters were population-typical values plus random deviation. According to the experiential formulations, interindividual and intraindividual deviations (residual deviation) were presented by the logarithm plus model and plus model, respectively.
Ln (Pj)=Ln (P)+ηPj
Ei j0 =Eij+εij,
where Pj is the jth patient PK coefficient; P is the PK coefficcient, ηPj is interindividual deviation (its mean is 0 and variance is ϖP), Ei j0 is the observation value, Eij is the prediction value of Ei j0, and εij is the intraindividual deviation (its mean is 0 and variance is σE2).
Model validation To validate the basic and the final PPK model, concentrations of 100 patients in the PPK valid group were predicted by the 2 models, respectively. To assess the accuracy and precision of the concentration prediction, the MPE, MSPE, RMSPE, WRES, and the 95%CI were all calculated. Then, the values of the 2 models were compared[36].
Results
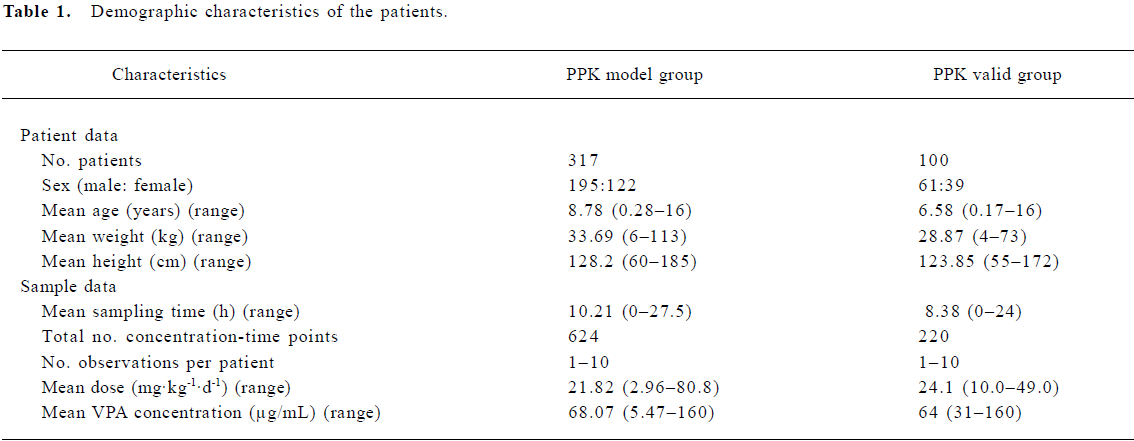
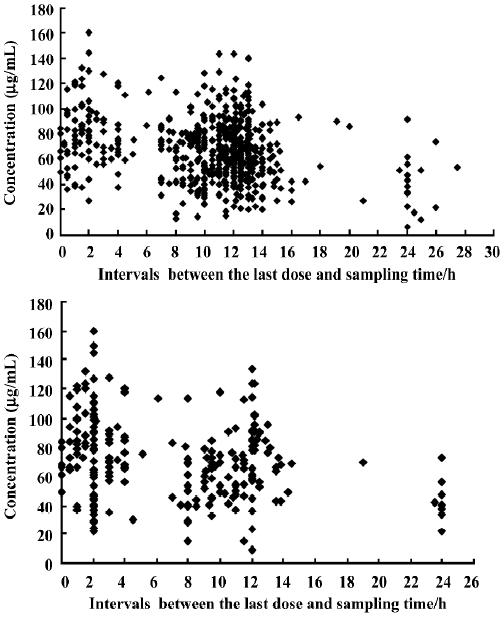
PPK model of VPA A total of 844 steady-state concentrations from 417 patients were collected in the routine monitoring of VPA therapy. The intervals between the last dose time and sampling time were distributed over 0–27.5 h, mostly within 0–24 h. All of the patients had normal renal and hepatic function. The demographic features of the patients are shown in Table 1. The distributions of concentration data and sampling times for the patients in the PPK model and PPK valid groups are shown in Figure 1.
Full table
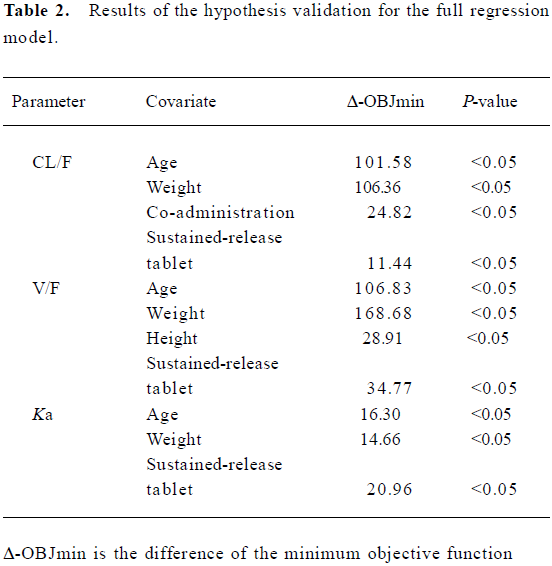
In the basic PPK model Ka=3.09 (h-1), V/F=20.4 (L), and CL/F=0.296 (L/h). In the full regressive model, the results of all the covariates were validated by a hypothesis test (Table 2).
Full table
The full regressive model was as follows:
CL/Fj=θCL/F+θAGE·AGEj +θWT·WTj+θCOCOj+θHS·HSj
V/Fj=θV/F+θAGE·AGEj +θWT·WTj+θH·Hj+θHS·HSj
Kaj=θka+θAGE·AGEj +θWT·WTj+θHS·(1-HSj)
Final PPK model
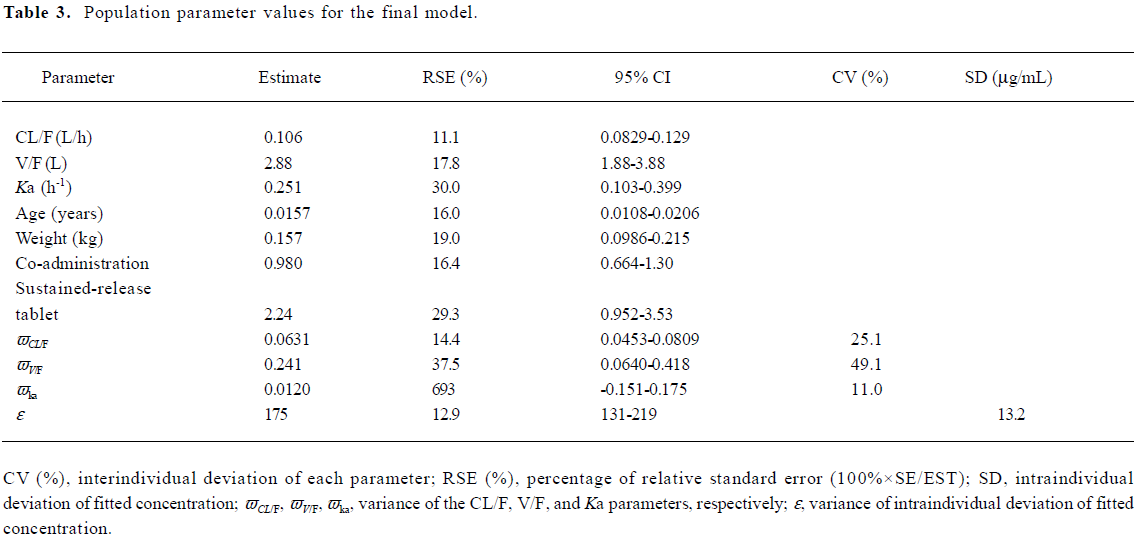
The parameters of the final model’s results are detailed in Table 3, and the final model was: Ka=0.251+2.24·(1-HS) (h–1) (VPA sustained-release tablet, HS=1; otherwise, HS=0), V/F=2.88+0.157·WT (L), CL/F=0.1060.98·CO+0.0157·AGE (L/h) (VPA comedication, CO=1; monotherapy, HS=0).
Full table
Validation of the PPK model
Comparison between scattergrams of basic and final PPK model validated by the PPK valid group A scattergram of the population predicted and the observed concentrations of the patients were validated by the basic and final models (Figure 2).
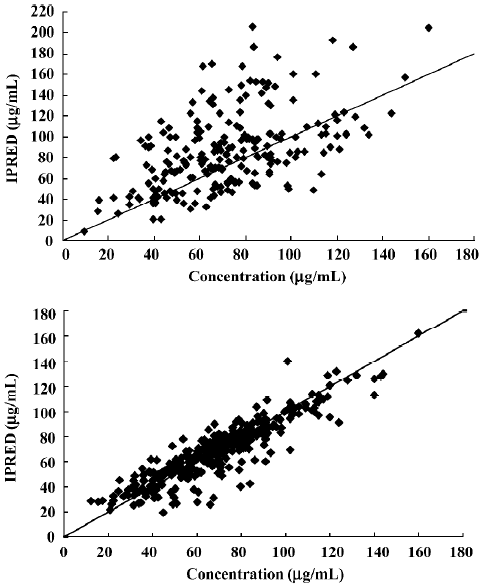
As earlier shown, in the final model, the scatters of population were predicted and observed concentrations (Figure 2B) were symmetrically distributed on 2 diagonal sides with no significant bias. In the basic model, the predicted concentrations of the population were greater than the observed concentrations (Figure 2A). The results indicated that the final model was more accurate than the basic model.
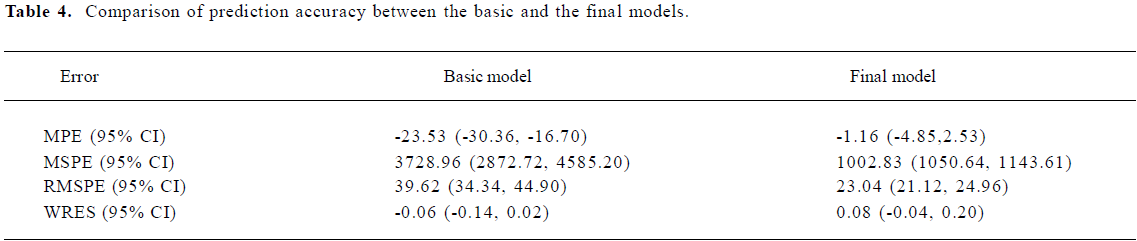
Comparison prediction errors between the final model and basic model The 95% CI of WRES in the final and the basic models all contained 0 and showed no significant statistical difference. Other indicators in the final model, such as MPE, MSPE, and RMSPE all decreased (Table 4) and showed more accurate predictions.
Full table
Discussion
Patients’ data When the asymmetrical data were collected, it was found that more attention should be paid to the distribution of the blood sampling time. For example, if all collected concentrations were trough concentrations, therefore, there was no information about the absorption phase and distribution phase, the researchers would be unable to obtain reasonable parameters about the absorption and distribution processes. If the researchers could obtain 1–2 points during the absorption phase, distribution phase, or elimination phase from the different cases, the data of all the cases would contain information about the absorption, distribution, and elimination processes, so the PPK parameters could be analyzed by the asymmetrical data.
In total, 844 sparse concentrations of VPA from 417 children with EP were collected. These concentrations were all steady-state concentrations and routine TDM data. As seen in the Figure 1, the intervals between the last dose time and the blood sampling time ranged from 0 to 27.5 h (mostly from 0 to 24 h, mainly converging on 0 to 15 h). As we know, ordinary formulations of VPA should be taken 2 or 3 times per day and sustained-release tablets once per day. The dosage interval should be less than 24 h, so the sampling intervals of the collected data covered all the dosage intervals. These concentration data could reflect the information on absorption, distribution, and elimination phases of the drug, so the PPK parameters could be estimated by NONMEM software[7–8,24–26].
Furthermore, the comedication AED included phenytoin, carbamazepine, phenobarbital, topiramate, and lamotrigine. Some patients had more than 2 types of comedication drugs. It’s a pity that the number of patients collected was not large, only 317 patients were included in the model group. If we analyzed the impact of every AED on the VPA individually, the patients in every group would diminish significantly. What’s the worse, the researchers were unable to get the impact of this drug on VPA metabolism as a result. It is well known that the comedication AED has definite drug interaction and AED can enhance the metabolism of VPA. As a result, we did not analyze the impact of AED individually. Instead, we considered comedication as 1 factor. In this way, we were able to analyze comedication on the VPA metabolism and qualified the impact of comedication of AED on the clearance of VPA.
In addition, the PK profiles of children in different age groups are different. Instead of subdividing the population of children based on their ages, we considered the whole population as 1 research object and analyzed the impact of age on their PK profiles with the age covariates. In this way, we not only simplified the subdivision of the population, but also took the age factor into the PPK of children. Therefore, a PPK model of Chinese epileptic children was established by NONMEM software.
PPK model of VPA
Comparison with similar domestic research There are a few published studies about the PPK parameters of VPA calculated by NOMEM software in China. Hu et al[16] showed a large age range of epileptic patients (3–66 years), with a mean age of 21.8 years. However, there was no covariate age in their final model of CL/F. The value of this model was finite for children population.
Jiao et al’s research[13] introduced the influence of age into the final model, which could be applied to child patients. However, that study only focused on the parameter of CL/F; there was no analysis on the parameters of Ka and V/F. Therefore, it did not show all the processes of PK.
Jiang and Wang’s study[21] calculated the VPA PPK parameter values and distributions of pediatric patients using the NPEM program of USC*PACK software (University of Southern California, Los Angeles, CA, USA). The optimum PPK parameters (mean±SD) were: Ka, 2.522±2.743 h–1; V, 0.329±0.496 L/kg, and Kel, 0.0438±0.0384 h–1. These were then used to establish a PPK model. Although this PPK model included 3 parameters, this model could not quantify the effects of influencing factors, such as age, weight, and drug co-administration. This was because of the limitation of USC*PACK software, but was resolved by NONMEM software.
Wang et al’s[22] study analyzed 3 parameters of PK; they obtained 2 group-specific values of 3 parameters for mono-therapy and concomitant medication, respectively, but did not quantify some influencing factors, such as age, weight, and concomitant medication.
Comparison with similar overseas studies The overseas studies[11,12,14,15,17–20] all fitted the 1-compartment first-order absorption model for VPA by NONMEM software. The collected data were all trough concentrations, and only 1 parameter (CL/F) could be analyzed and was set up as a final model of CL/F. In addition, owing to different study materials, the influencing factors in the final models were different. However, all the PPK models were reasonable because the analyses were based on their own specific populations.
In this study, we focused on epileptic children and introduced the covariates of age, weight, concomitant medication, and different formulations on CL/F, V/F, and Ka into the final model. The data collected in the study covered the information about the absorption, distribution, and elimination phases and resulted in 3 parameters. We set up the final model of Ka, V/F, and CL/F, and analyzed the covariates of every parameter in order to gain a better understanding about the PPK of VPA. Our present study was specific to Chinese children with EP.
Validation of the PPK model The final model, which contained covariates, such as age, weight, concomitant medication, and different formulations, was more accurate in predicting the patients’ blood concentrations than the basic model with no covariates. Because the basic model’s MPE (95% CI) was –23.53 (–30.36, –16.70), and did not contain 0, it indicated that the bias of prediction was greater. However, the final model’s MPE (95% CI) was –1.16 (–4.85, 2.53) and contained 0, indicating the predicative deviation fluctuates in the vicinity of 0. Furthermore, the RMSPE (95% CI) (23.04 [21.12, 24.96]) of the final model outweighed the basic model (39.62 [34.34, 44.90]), so the final model had a greater degree of accuracy and precision than the basic model.
Based on this PPK model, individual PK parameters will be estimated conveniently by the Bayesian approach. It will be valuable to facilitate individualized dosage regimens. This research will to be conducted in the near future.
Acknowledgments
The authors thank the pharmacists, neurology physicians, and pediatricians at Xuan-wu Hospital of Capital Medical University (Beijing, China) and Peking University First Hospital (Beijing, China), for their contributions to the study.
References
- Bourgeois BFD. Antiepileptic drugs in pediatric practice. Epilepsia 1995;36:S34-45.
- Davis R, Peters DV, McTavish D. Valproic acid: a reappraisal of its pharmacological properties and clinical efficacy in epilepsy. Drugs 1994;47:332-72.
- Bourgeois BFD. Valproic acid: clinical use. In: Levy RH, Mattson RH, Meldrum BS, editors. Antiepileptic drugs. New York: Raven Press; 1995. p 633–9.
- Cloyd JC, Fisher JH, Kriel RL, Kraus DM. Valproic acid pharmacokinetics in children. IV: Effects of age and antiepileptic drugs on protein binding and intrinsic clearance. Clin Pharmacol Ther 1993;53:22-9.
- Yukawa E, Hokazono T, Satou M, Ohdo S, Higuchi S, Aoyama T. Pharmacokinetic interactions among phenobarbital, carbamaze-pine, and valproic acid in pediatric Japanese patients: clinical considerations on steady-state serum concentration-dose ratios. Am J Ther 2000;7:303-8.
- Thummel KE, Shen DD. Design and optimization of dosage regimens: pharmacokinetic data. In: Hardman JG, Limbird LE, Gilman AG, editors. Goodman and Gilman’s the pharmacological basis of therapeutics; 10th ed. New York: McGraw-Hill; 2001. p 1917–2023.
- Llopis-Salvia P, Jimenez-Torres NV. Population pharmacokinetic parameters of vancomycin in critically ill patients. J Clin Pharm Ther 2006;31:447-54.
- Chen ZY, Xie HT, Zheng QS, Sun RY, Hu G. Pharmacokinetic and pharmacodynamic population modeling of orally administered rabeprazole in healthy Chinese volunteers by the NONMEM method. Eur J Drug Metab Pharmacokinet 2006;31:27-33.
- Litalien C, Theoret Y, Faure C. Pharmacokinetics of proton pump inhibitors in children. Clin Pharmacokinet 2005;44:441-66.
- Carlsson KC, Hoem NO, Glauser T, Vinks AA. Development of a population pharmacokinetic model for carbamazepine based on sparse therapeutic monitoring data from pediatric patients with epilepsy. Clin Ther 2005;27:618-26.
- Panomvana NA, Ayudhya D, Suwanmanee J, Visudtibhan A. Pharmacokinetic parameters of total and unbound valproic acid and their relationships to seizure control in epileptic children. Am J Ther 2006;13:211-7.
- El Desoky ES, Fuseau E. EL Din Amry S, Cosson V. Pharmacokinetic modelling of valproic acid from routine clinical data in Egyptian epileptic patients. Eur J Clin Pharmacol 2004;59:783-90.
- Jiao Z, Zhong MK, Hu M, Shi XJ, Li ZD, Zhang JH, et al. Population pharmacokinetic modeling of valproic acid clearance. Chin J Hosp Pharm 2004;24:515-7.
- Park HM, Kang SS, Lee YB, Shin DJ, Kim ON, Lee SB, et al. Population pharmacokinetics of intravenous valproic acid in Korean patients. J Clin Pharm Ther 2003;27:419-25.
- Yukawa E, Nonaka T, Yukawa M, Higuchi S, Kuroda T, Goto Y. Pharmacoepidemiologic investigation of a clonazepam-valproic acid interaction by mixed effect modeling using routine clinical pharmacokinetic data in Japanese patients. J Clin Pharm Ther 2003;28:497-504.
- Hu M, Zhang JH, Sun H, Shi XJ, Yu LY, Zhong MK, et al. Construction and clinical application of the population pharmacokinetic model of valproic acid. Evaluat Anal Drug-use Hosp China 2001;1:95-7.
- Serrano BB, Garcia Sanchez MJ, Otero MJ, Buelga DS, Serrano J, Dominguez-Gil A. Valproate population pharmacokinetics in children. J Clin Pharm Ther 1999;24:73-80.
- Sanchez-Alcaraz A, Quintana MB, Lopez E, Rodriguez I. Valproic acid clearance in children with epilepsy. J Clin Pharm Ther 1998;23:31-4.
- Yukawa EJ, To H, Ohdo S, Higuchi S, Aoyama T. Population-based investigation of valproic acid relative clearance using nonlinear mixed effects modeling: influence of drug-drug interaction and patient characteristics. J Clin Pharmacol 1997;37:1160-7.
- Botha JH, Gray AL, Miller R. A model for estimating individualized Valproate clearance values in children. J Clin Pharmacol 1995;35:1020-4.
- Jiang DC, Wang L. Population pharmacokinetic model of valproate and prediction of valproate serum concentrations in children with epilepsy. Acta Pharmacol Sin 2004;25:1576-83.
- Wang G, Gu R, Liu B, Jia YT. Population pharmacokinetics of valproic acid in children. Chin J Hosp Pharm 2004;24:735-8. Chinese.
- Breant V, Charpiat B, Sab JM, Maire P, Jelliffe RW. How many patients and blood levels are necessary for population pharmacokinetic analysis? A study of a one compartment model applied to cyclosporine. Eur J Clin Pharmacol 1996;51:283-8.
- Meibohm B, Laer S, Panetta JC, Barrett JS. Population pharmacokinetic studies in pediatrics: issues in design and analysis. AAPS J 2005;7:E475-87.
- Duffull S, Waterhouse T, Eccleston J. Some considerations on the design of population pharmacokinetic studies. J Pharmaco-kinet Pharmacodyn 2005;32:441-57.
- Dodds MG, Hooker AC, Vicini P. Robust population pharmacokinetic experiment design. J Pharmacokinet Pharmacodyn 2005;32:33-64.
- Wang L. Drugs on central nervous system. In: Wang L. Pediatric pharmacology and drug therapeutics. Beijing: Beijing Medical University Press; 2002. p 210–2.
- Huang SP, He GZ, Chen ZQ. Research of pharmacokinetics and steady state concentration of valproate in epileptic children. Chin J Pediat 1994;32:89-91. Chinese..
- Mihaly GW, Vajda FJ, Miles JL. Single and chronic dose pharmacokinetics of sodium valproate in epileptic patients. Eur J Clin Pharmacol 1979;16:23-9.
- Bruni J, Wilder BJ, Willmore LJ, Perchalski RJ, Villarreal HJ. Steady-state kinetics of valproic acid in epileptic patients. Clin Pharmacol Ther 1978;24:324-32.
- Klotz U, Antonin KH. Pharmacokinetics and bioavailability of sodium valproate. Clin Pharmacol Ther 1977;21:736-43.
- Simpson JA, Hughes D, Manyando C, Bojang K, Aarons L, Winstanley P, et al. Population pharmacokinetic and pharmacodynamic modelling of the antimalarial chemotherapy chlorproguanil/dapsone. Br J Clin Pharmacol 2006;61:289-300.
- Roy A, Ette EI. A pragmatic approach to the design of population pharmacokinetic studies. AAPS J 2005;7:E408-20.
- Wade JR, Edholm M, Salmonson T. A guide for reporting the results of population pharmacokinetic analyses: a Swedish perspective. AAPS J 2005;7:45.
- Duffull SB, Kirkpatrick CM, Green B, Holford NH. Analysis of population pharmacokinetic data using NONMEM and WinBUGS. J Biopharm Stat 2005;15:53-73.
- Kappelhoff BS, Huitema AD, Crommentuyn KM, Mulder JW, Meenhorst PL, van Gorp EC, et al. Development and validation of a population pharmacokinetic model for ritonavir used as a booster or as an antiviral agent in HIV-1-infected patients. Br J Clin Pharmacol 2005;59:174-82.