
Identification of ginkgolide B metabolites in urine and rat liver cytochrome P450 enzymes responsible for their formation in vitro1
Introduction
As an important active constituent of Ginkgo biloba extract, ginkgolide B is a highly selective and competitive platelet-activating factor (PAF) receptor antagonist[1]. In recent clinical and experimental experiments, ginkgolide B has been reported to be effective against ischemic brain injury[2,3], platelet aggregation and thrombosis[4], and inflammatory[5] and central nervous system diseases, such as postischemic neuronal damage, dementia, and Alzheimer’s disease[6,7].
Now, ginkgolide B is being developed for treating cerebrovascular accidents. The preclinical pharmacokinetics of ginkgolide B have been reported in our laboratory; the data showed that 45% and 2.6% of ginkgolide B administered to rats were excreted into urine and feces in 48 h[8], respectively, suggesting that nearly 50% of ginkgolide B may undergo metabolism in vivo. Up to now, the detailed metabolic pathway of ginkgolide B in rat has not been reported.
The purpose of this experiment was to identify the metabolites of ginkgolide B in rat urine, the predominant metabolism of ginkgolide B in rat liver microsomes in vitro, and to identify the major cytochrome (CYP) P450 enzymes responsible for its metabolism.
Materials and methods
Chemicals Ginkgolide B and limonin (as the internal standard [IS]) were obtained from the National Institute for the Control of Pharmaceutical and Biological Products (Beijing, China). Glucose-6-phosphate dehydrogenase (G-6-PDH; type V), α-nicotinamide adenine dinucleotide phosphate (NADP), glucose-6-phosphate (G-6-P), α-naphthoflavone (α-Naph), sulfaphenazole (Sul), quinidine (Qui), and diethyldithiocarbamate (DDC) were purchased from Sigma (St Louis, MO, USA). Ketoconazole (Ket) was kindly provided by Nanjing Second Pharmaceutical Factory (Nanjing, China). Ginkgolide B emulsion was presented by Beijing 303 Hospital (Beijing, China). HPLC-grade methanol was purchased from Fisher Scientific (Fair Lawn, NJ, USA). All other supplies were available from standard commercial sources.
Animal Ten Sprague-Dawley rats (5 male and 5 female, 200±20 g, 7 weeks of age) were obtained from the Experimental Animal Center of China Pharmaceutical University (Nanjing, China), and the animal experiments were approved by the Animal Ethics Committee of China Pharmaceutical University.
Rat urine specimen collection and sample preparation Six Sprague-Dawley rats (3 male and 3 female) were fasted for 10 h and then a single dose of ginkgolide B emulsion (4 mg/kg) was injected via the caudal vein. The rats were placed in the metabolism cages and the urine was collected at 0–8 h and immediately frozen and stored at -20 °C until analysis.
In total, 1 mL methanol was added to 20 μL rat urine in a 2 mL centrifuged tube. The tubes were mixed for 5 min and centrifuged for 5 min at 10 000×g; 2 μL supernatant was injected into the liquid chromatography (LC) mass spectrometer (MS) system.
Microsomal incubations and sample preparation The rat liver microsomes were prepared by differential centrifugation[9], and the microsomal protein concentration was determined by the method of Lowry et al [10].
Substrate concentrations of 1–100 μmol/L, microsomal protein of 0.5–2 g/L, and incubation times of 5–90 min were used to optimize assay conditions. A typical incubation mixture consisted of 100 mmol/L potassium phosphate buffer (pH 7.4), an NADPH-generating system (5 mmol/L MgCl2, 10 mmol/L G-6-P, 1 mmol/L NADP, 1 kU/L G-6-PDH), and 1 g/L microsomal protein in a final volume of 1 mL[9]. Before the addition of the substrate, the incubation mixtures were prewarmed for 5 min at 37 °C. Reactions was initiated by the addition of the substrate, and the concentration of the substrate for all incubations was 20 μmol/L. The incubations were conducted at 37 °C for 0.5 h, and the reaction was terminated by adding 10 μL of 10% HClO4. The samples were centrifuged (20 000×g) at 4 °C for 10 min, and the supernatant was separated from the precipitated protein and concentrated by evaporation under a gentle stream of nitrogen. The residues were then reconstituted in 200 μL methanol followed by centrifugation at 20 000×g for 10 min; an aliquot of 10 μL was injected into the LC-MS system. Incubations without NADPH served as negative controls.
Identification of metabolites using LC-MS and LC ion-trap-time-of-flight MS in rat urine and microsomal incubations Urine and incubations samples were analyzed by LC quadrupole MS (LC/ESI-MS; Quadrupole MS, Shimadzu, Kyoto, Japan) and LC ion-trap-time-of-flight MS (LC-IT-TOFMS; Shimadzu, Japan). LC/ESI-MS was performed for the profile of metabolites of ginkgolide B, and mass spectrometric conditions were optimized to obtain maximum sensitivity; the curved desolvation line voltage was fixed as that in Tuning, the probe high voltage was set at 4.5 kV, Q-array voltage of DC –35 V, and RF 150 V. Mass spectra were obtained at a dwell time of 1 s in scan mode. The accuracy masses, formulas, and the possible structure of the metabolite were obtained by using an LC-IT-TOF-MS equipped with an electrospray ionization source (negative-ionization mode). The probe voltage was 4.5 kV, and both the curved desolvation line temperature and the block heater temperature were 200 °C. The ion accumulation time and isolation time were set at 30 and 20 ms, respectively. Argon was used as collision gas and its inflow rate to the ion trap was set 50% during collision induced dissociation (CID). The CID energy and times were 50% and 30 ms, respectively.
Full-scan quadrupole MS spectra were first acquired for molecular ions of parent compounds and relevant metabolites. Subsequently, the ion trap mass analyzer could be used for the MSn analysis and could give the maximum amount of structural information by CID of appropriate molecular ions that were selected; the accuracy masses, formulas of the molecular ions, and their fragments were obtained by using the TOF analyzer.
The separation of metabolites was achieved on ODS and HPLC columns (Shim-pack, 5 μm, 2.0 mm ID×150 mm; Shimadzu, Japan) using a LC2010 series chromatography system (Shimadzu, Japan) consisting of 2 pumps, an autosampler, and a column oven. A gradient elution mode was adopted using 2 mobile phases: 0.04% of triethylamine water (v/v) and methanol. The flow rate was 0.2 mL/min. The column was equilibrated with 25% ginkgolide B at 0 min. After an injection of the sample, the methanol content was linearly increased to 85% at 8 min. Then the percentage of ginkgolide B was linearly decreased within 2 min to 25% of the initial composition, and held to equilibrate the column for 2 min before the application of the next samples. Data acquisition and processing were accomplished using Shimadzu LCMS solution version 3.40 for the LC-IT-TOF-MS system.
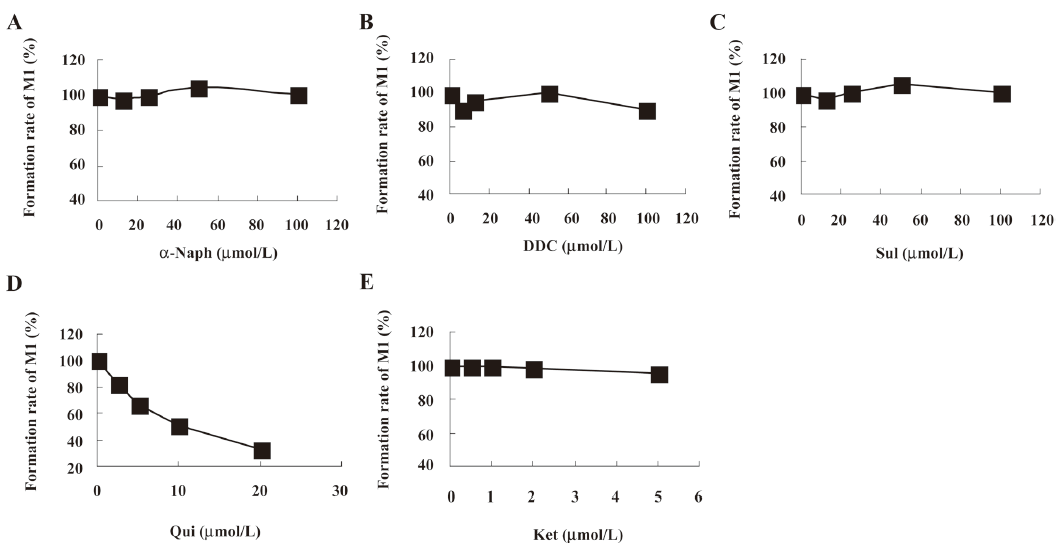
Characterization of P450 isoforms involved in the formation of ginkgolide B metabolites in rat liver microsomes The inhibition of the ginkgolide B metabolism was evaluated using various selective chemical inhibitors that contained α-Naph for CYP1A2, Qui for CYP2D6, DDC for CYP2E, Sul for CYP2C9, and Ket for CYP3A. The final concentration of ginkgolide B was 20 μmol/L, and the concentration range of inhibitors was 2.5–20 μmol/L for Qui, 12.5–100 μmol/L for α-Naph and Sul, 6.25–50 μmol/L for DDC, and 0.5–5 μmol/L for Ket in microsomal incubations[11]. Rat liver microsomes (1 g/L) were pre-incubated with various concentrations of inhibitors for 5 min at 37 °C, followed by the addition of buffer. The incubation mixtures were prewarmed for 5 min in the NADPH-regenerating system before the reactions were initiated by the addition of the substrate; then the incubations were conducted for 0.5 h and terminated as described earlier. As the inhibitors were dissolved in methanol, pure methanol was included in the control incubations (without inhibitors) to rule out any effects of the solvent on the microsomal activity. The final concentration of the organic solvent in the incubation system was 1%.
After identifying the major metabolic enzyme involved in the metabolism of ginkgolide B in vitro, the microsomes were incubated with various concentrations of ginkgolide B (0.5-20 μmol/L) in the absence and presence of the various concentrations of the inhibitors; all of the incubations were carried out as described before. Then the Lineweaver-Burk plot of ginkgolide B oxide activity in the absence or presence of the inhibitors was compared with the enzyme kinetics characteristics of the inhibition types (Vmax and Km). The Lineweaver-Burk plot and linear regressions were applied for the inhibition study and for the calculation of Ki values.
The 0.2 mL incubation mixtures were added to 10 μL of 1 mg/L IS (limonin) solution, extracted with 1.2 mL acetoacetate and centrifuged at 3000×g for 10 min. Then the organic layer was removed and evaporated under a stream of nitrogen at 45 °C. The residue was re-dissolved in 200 μL of mobile phase, and an aliquot (5 μL) was injected into the LCMS system. The metabolites in the incubation mixture were determined using a LC2010 series chromatography system coupled to a quadrupole mass spectrometer (Shimadzu, Kyoto, Japan). MS spectrometer was operated in negative ion electrospray mode and analyte detection was performed in the selected ion monitoring mode. The LC separation condition was identical with the described above. Data acquisition and processing were accomplished using Shimadzu LCMS solution version 2.02 worked on Windows 2000. As M1 standards were not available, the relative quantification of the metabolite concentrations in the incubation were compared using metabolite peak area ratios to the IS obtained for the respective samples.
Results
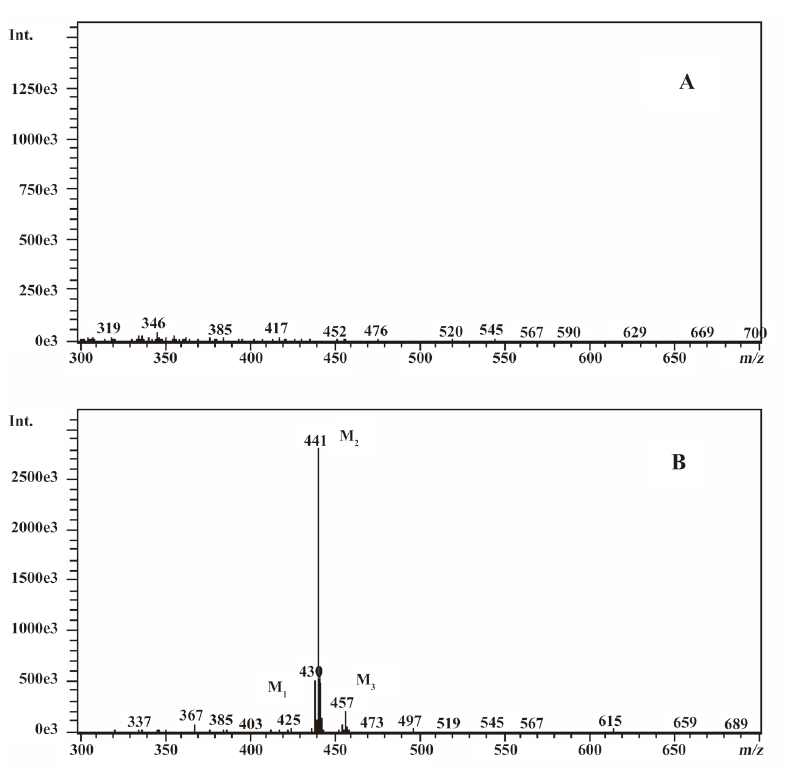
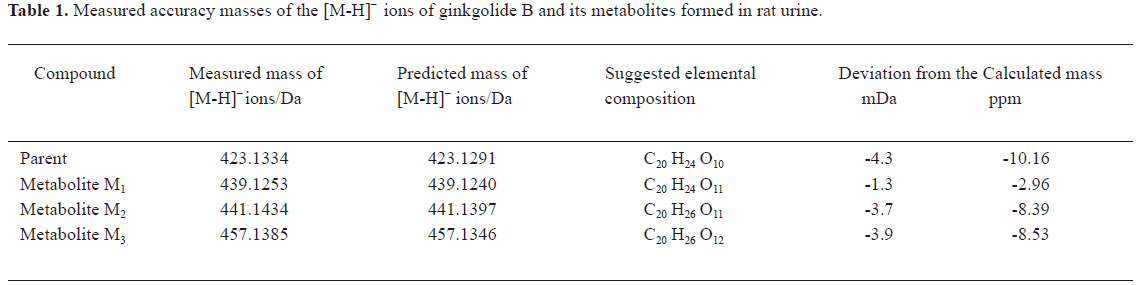
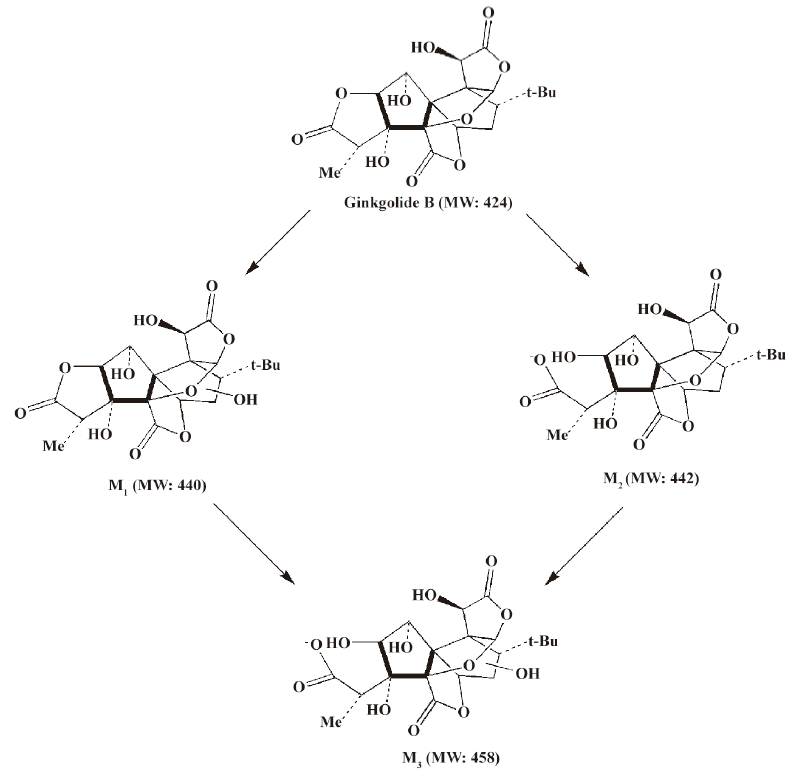
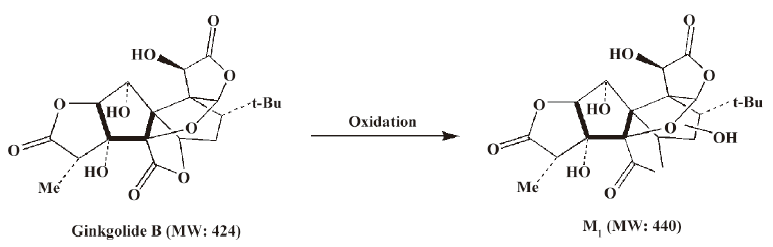
In vivo identification of metabolites of ginkgolide B in rat urine The full-scan mass spectrum was obtained from urine sample after ginkgolide B was intravenously administered to the rats and compared with the blank urine samples (Figure 1) to discover the main possible metabolites in rat urine. The [M-H]- ions of the possible metabolites were at m/z 439 (M1), m/z 441 (M2), and m/z 457 (M3), respectively. Thus, the molecular weights of M1, M2, and M3 were 440, 442, and 458, respectively. No significant differences were detected in the formation of the metabolites between the male and female rats. The accuracy mass data, formulas, and the possible structure of the metabolites were obtained by using a LC-IT-TOF-MS (Table 1). The [M-H]- ions of M1, M2, and M3 were increased by 16, 18, and 34 Da, respectively, compared to that of ginkgolide B. The measured accuracy masses of the m/z 439 metabolite of ginkgolide B indicated the charge of +O moiety from the parent compound, which is consistent with its being the corresponding hydroxyl metabolite. The measured accuracy masses of the m/z 441 metabolite of ginkgolide B indicated the charge of +H2O moiety from the parent compound. Relative to ginkgolide B, biotransformation to m/z 457 resulted in a charge of +H2O2. As ginkgolide B readily dissolved in the basic solution, recovered quantitatively on subsequent acidification[12], and was present in 2 forms in vivo by using 3H-ginkgolide B: the original ginkgolide B with its ring closed and the second form with one of the rings open[13], we can tentatively presume that M2 was a hydrolysis metabolite of ginkgolide B, and M3 was a hydrolysis product of M1.
Full table
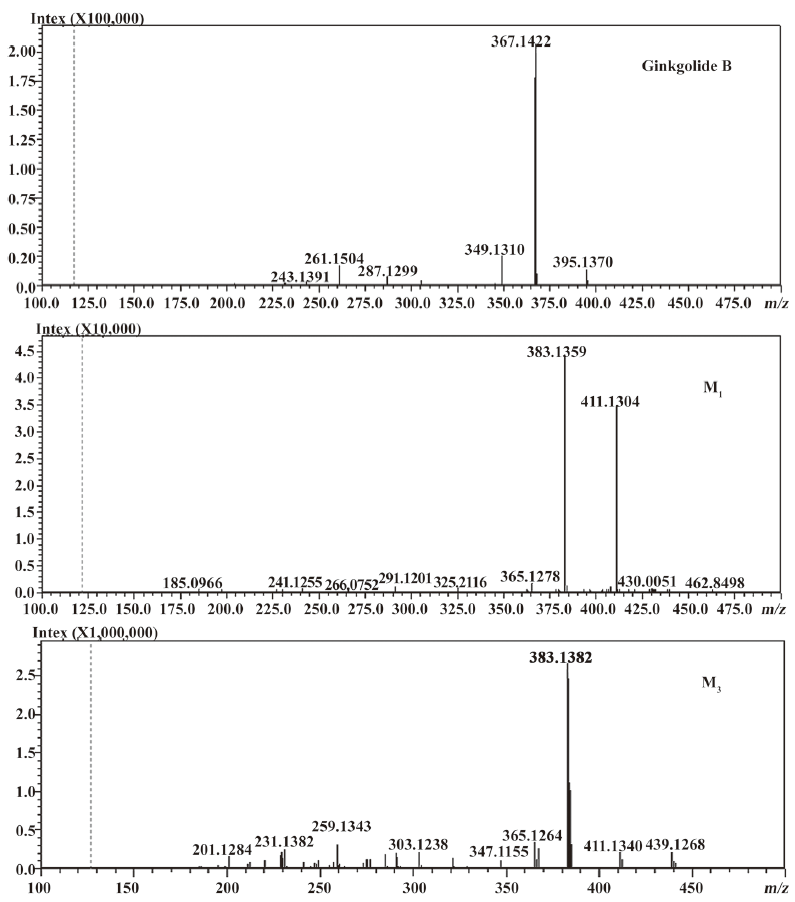
The most abundant product ion of m/z 367.1422 was formed by the loss of 2CO from the molecular ion at m/z 423.1334. The main fragment ions of m/z 439.1253 and 457.1385 in the MS2 spectra were m/z 383.13 by the loss of 2CO (Figure 2). This suggests that ginkgolide B and M1, M2, and M3 have a similar mass schizolysis rule and structure core. According to the above analysis, we can tentatively presume the proposed metabolic pathway of ginkgolide B in rats (Figure 3).
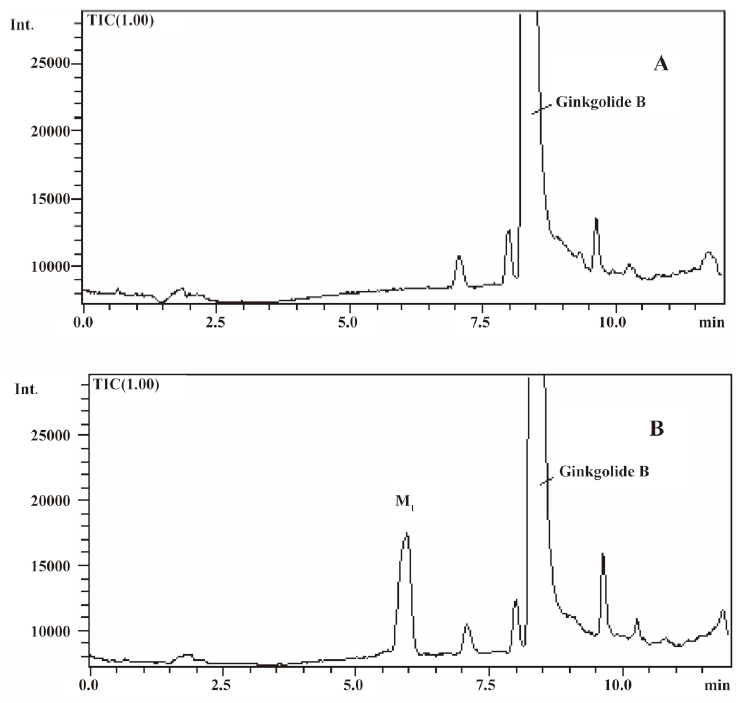
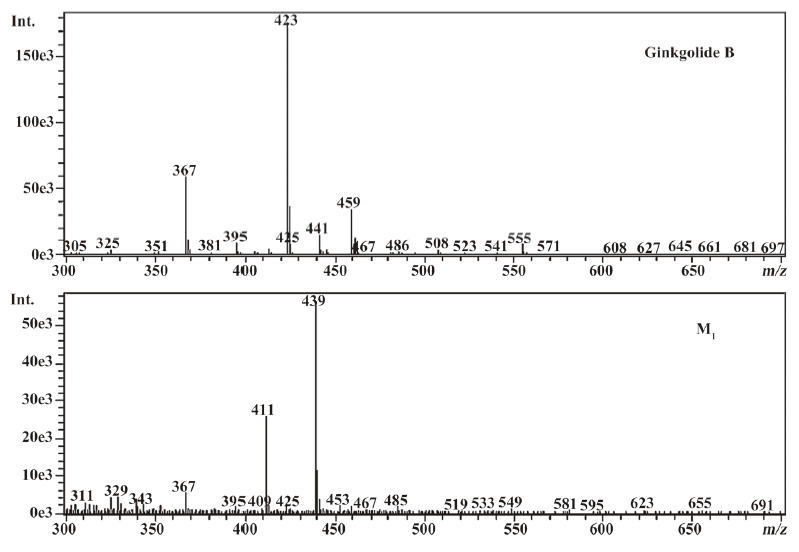
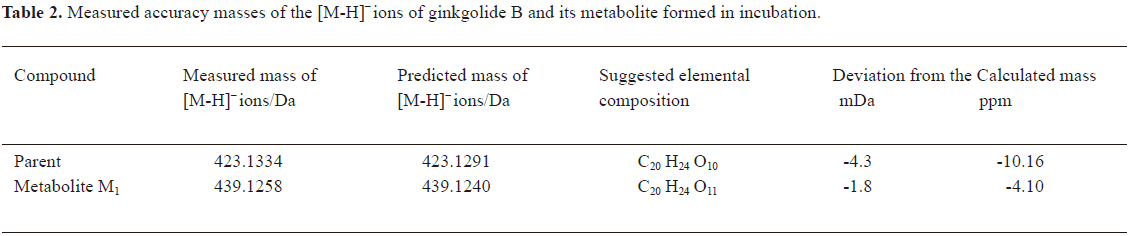
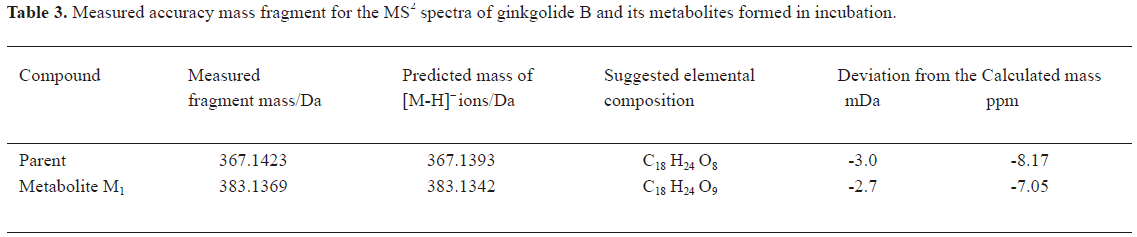
In vitro identification metabolism of ginkgolide B in rat microsomes incubations Following the incubation of ginkgolide B with rat liver microsomes, ginkgolide B was rapidly metabolized, and only 1 metabolite (M1) was isolated in the incubation (Figure 4). Their MS spectra were obtained using an electrospray ionization interface under negative-ion mode (Figure 5). Their accuracy mass data and formulas were obtained by using a LC-IT-TOF-MS (Table 2). The accuracy masses suggested elemental composition of the main fragment MS2 ions of ginkgolide B, and its metabolite were compared in rat liver microsomes obtained by the CID of the corresponding [M-H]- ions (Table 3).
Full table
Full table
Compared to ginkgolide B (C20H24O10, m/z 423.1326), biotransformation to M1 (C20H24O11, m/z 439.1258) resulted in charge of +O moiety. Furthermore, the main fragment MS2 ions of ginkgolide B (m/z 367.1423) and M1 (m/z 383.1369), respectively, by using and ion trap mass analyzer, indicated the loss of the 2CO group of ginkgolide B and its metabolites, which demonstrated ginkgolide B and M1 have a similar mass schizolysis rule and structure core. According to above analysis, we could tentatively presume that M1 was a hydroxyl metabolite of ginkgolide B (Figure 6).
Inhibition study with chemical inhibitors When the rat liver microsomes were incubated using various concentrations of the microsomal protein for various time periods, 1 g/L microsomal protein and the 30 min time frame were found to be optimal incubation conditions. The effect of various substrate concentrations of 1-100 μmol/L on the rate of the metabolite formation demonstrated that the Km for M1 was approximately 4 μmol/L. A substrate concentration of 20 μmol/L was chosen for further experiments, considering the concentration levels in liver tissues (approximately 20 μmol/g liver tissue) in vivo[8], and the linearity and the sensitivity of the detection of M1 and the Km value of the M1 metabolite.
The effects of the inhibitors on the formation of M1 are presented in Figure 7. Qui, the specific inhibitor of CYP2D6, could inhibit the formation of M1, while other inhibitors had no significant inhibitory effects on the M1 formation. After identifying CYP2D6 involved in the metabolism of ginkgolide B in vitro, the microsomes were incubated with various concentrations of ginkgolide B (0.5-20 μmol/L) in the absence and presence of Qui (0-20 μmol/L). The Lineweaver-Burk plot of ginkgolide B oxide activity in the rat liver microsomes in the absence or presence of Qui is presented in Figure 8. The Lineweaver-Burk plot of ginkgolide B oxide activity in the rat liver microsomes in the absence or presence of Qui was parallel, which consistent with the enzyme kinetics characteristics of the uncompetitive inhibition types (decreased in Vmax and Km). The value of Ki was estimated to be 8 μmol/L using the Lineweaver-Burk plot and linear regressions.
Discussion
For the first time, LC-IT-TOF-MS with electrospray ionization in negative-ion mode was used for the analysis of ginkgolide B and its metabolites in urine and microsomal incubation. The measurement of the accuracy masses of ions of the parent compounds and metabolites were useful at unambiguously establishing that M1 (m/z 439.124; C20H24O11), M2 (m/z 441.1434; C20H26O11), and M3 (m/z 457.1385; C20H26O12) had attached a mass equivalent to a O, H2O, and H2O2 moiety relative to the corresponding ginkgolide B (m/z 423.1334; C20H24O10), respectively. Furthermore, abundant main fragment MS2 ions of ginkgolide B and M1 in the urine and the microsome incubation sample, respectively, by using ion trap mass analyzer, further indicated the loss of 1 and 2 carbon oxide groups of ginkgolide B and its metabolites, which further demonstrated they had a similar mass schizolysis rule and structure core. It identified that M1 is precisely a hydroxyl metabolite of ginkgolide B. Comparing M1 in the urine and M1 in the microsome incubation, we found that they had identical retention times and accuracy masses of [M-H]- ions, formulas, and MS2 fragments; thus, we confirmed that they were same compound. Therefore, the proposed metabolic pathway of ginkgolide B is metabolized to its hydroxyl metabolite (Figures 4 and 6). Furthermore, the hydroxyl metabolite was not ginkgolide C, based on its retention time being different to that of M1 under the same chromatographic conditions.
In microsomal incubations, various concentrations of ginkgolide B on the rate of the metabolite formation demonstrated that the Km for M1 was estimated to be approximately 4 μmol/L. In chemical inhibition studies, Qui, a CYP2D6 inhibitor, could uncompetitively inhibit the formation of M1, and its Ki value was estimated to be 8 μmol/L, while other inhibitors for CYP3A (Ket), CYP2C9 (Sul), CYP1A2 (α-Naph), and CYP2E1 (DDC) had no effect on the formation of M1. The results suggest that CYP2D6 is the major CYP450 isozyme involved in the conversion of ginkgolide B to hydroxyl metabolite. Pharmacokinetic drug interactions caused by metabolic processes are regarded as one of the most important factors affecting the concentration of drugs. Therefore, the inhibition of the above metabolic pathway can lower the formation rate of the hydroxyl metabolite and increase the concentration of ginkgolide B, suggesting the possibilities of metabolic interactions of ginkgolide B with other therapeutic agents, such as inhibitors and substrates of CYP2D6.
In conclusion, the metabolic pathway ginkgolide B was identified in rats using a high-resolution hybrid LC-IT-TOFMS, which was further confirmed by rat liver microsome incubation in vitro, and the CYP2D6 isozyme was identified as the major CYP450 enzyme responsible for ginkgolide B metabolism in the rat liver microsomes. These results are important for further understanding the disposition of ginkgolide B in rats.
References
- Braquet P. Proofs of involvement of PAF-acether in various immune disorders using BN 52021 (ginkgolide B): a powerful PAF-acether antagonist isolated from Ginkgo biloba L. Adv Prostaglandin Thromboxane Leukot Res 1986;16:179-98.
- Prehn JH, Krieglstein J. Platelet-activating factor antagonists reduce excitotoxic damage in cultured neurons from embryonic chick telencephalon and protect the rat hippocampus and neocortex from ischemic injury in vivo. J Neurosci Res 1993;34:179-88.
- Liu XH, Eun BL, Silverstein FS, Barks JD. The platelet-activating factor antagonist BN 52021 attenuates hypoxic-ischemic brain injury in the immature rat. Pediatr Res 1996;40:797-803.
- Koch E. Inhibition of platelet activating factor (PAF)-induced aggregation of human thrombocytes by ginkgolides: considerations on possible bleeding complications after oral intake of Ginkgo biloba extracts. Phytomedicine 2005;12:10-6.
- Beck JC, Goodner CJ, Wilson C, Wilson D, Glidden D, Baskin DG, et al. Effects of ginkgolide B, a platelet-activating factor inhibitor on insulitis in the spontaneously diabetic BB rat. Autoimmunity 1991;9:225-35.
- Oberpichler H, Sauer D, Rossberg C, Mennel HD, Krieglstein J. PAF antagonist ginkgolide B reduces postischemic neuronal damage in rat brain hippocampus. J Cereb Blood Flow Metab 1990;10:133-5.
- Bate C, Salmona M, Williams A. Ginkgolide B inhibits the neurotoxicity of prions or amyloid-β1-42. J Neuroinflammation 2004;1:4-11.
- Chen WD, Liang Y, Xie L, Lu T, Liu XD, Wang GJ. Pharmacokintics of the ginkgo B following intravenous administration of ginkgo B emulsion in rats. Biol Pharm Bull 2007;30:1-5.
- Liu XQ, Zhao Y, Li D, Qian ZY, Wang GJ. Metabolism and metabolic inhibition of clinipine in human liver microsomes. Acta Pharmacol Sin 2003;24:263-8.
- Lowry OH, Rosebrough NJ, Farr AL, Randall RJ. Protein measurement with the folin-phenol reagent. J Biol Chem 1951;193:265-75.
- Liu YT, Hao K, Liu XQ, Wang GJ. Metabolism and metabolic inhibition of gambogic acid in rat liver microsomes. Acta Pharmacol Sin 2006;27:1253-8.
- Van Beek TA. Ginkgolides and bilobalide: Their physical, chromatographic and spectroscopic properties. Bioorg Med Chem 2005;13:5001-12.
- Suehiro M, Simpson NR, Underwood MD, Castrillon J, Nakanishi K, Van Heertum R. In vivo biodistribution of ginkgolide B, a constituent of Ginkgo biloba, visualized by MicroPET. Planta Med 2005;71:622-7.