
Evidence for major pleiotropic effects on bone size variation from a principal component analysis of 451 Caucasian families1
Introduction
Osteoporosis is a skeletal disorder characterized by compromised bone strength, which predisposes an individual to an increased risk of fractures. Several categories of phenotypes, including bone mineral density (BMD), bone size (BS), geometry, and structure are considered determinants of bone strength[1–3]. Numerous studies conducted over last 2 decades have documented that BMD is highly heritable[4,5] and much effort has been done to identify the particular chromosomal loci and genes involved in the determination of BMD variation[6]. BS is also under strong genetic control, with heritability of over 50%[7,8], In contrast, there has been relatively few genetic studies on BS in humans, and the list of quantitative trait loci (QTL) and genes involved in the determination of BS is far from being complete.
Several candidate genes and allelic variants have been shown to be associated with or linked to BS-related phenotypes, for example, collagen type I alpha (COL1A)1[9] and COL1A2[10], low-density lipoprotein receptor-related protein 5[11], alpha2-HS glycoprotein[12], estrogen receptor alpha[13], cytochrome P450c17alpha[14]. We previously identified several chromosomal regions for BS variation at individual skeletal sites[15,16]. However, it is unclear if BS variation at multiple skeletal sites is governed by some shared genetic determination since BS at different sites are highly correlated[8].
There is also a significant sex bias in the magnitude of BS and incidence of osteoporotic fracture. Women generally have smaller body size and skeletons than men[17,18]. Furthermore, females show a greater incidence of stress fractures early in life[19] and fragility fractures later in life, with a female-to-male ratio of approximate 4:1[20,21]. Thus investigations into the genetic basis underlying the sex effects in BS variation are warranted.
Here, we present the results of genome-wide scan in a large sample containing 3899 Caucasians from 451 pedigrees. To examine the pleiotropic effects on BS at multiple skeletal sites, we used the outcome of a principal component analysis (PCA) conducted on 7 BS measurements. The notable sex bias led us to investigate whether there are sex-specific pleiotropic genes that underlie BS variation.
Materials and methods
Subjects The study was approved by the Creighton University Institutional Review Board (Omaha, NE, USA). All the study subjects signed informed consent documents before entering the project. The sampling scheme and exclusion criteria have been detailed elsewhere[22]. Briefly, patients with chronic diseases and conditions that might potentially affect bone mass, structure, or metabolism were excluded.
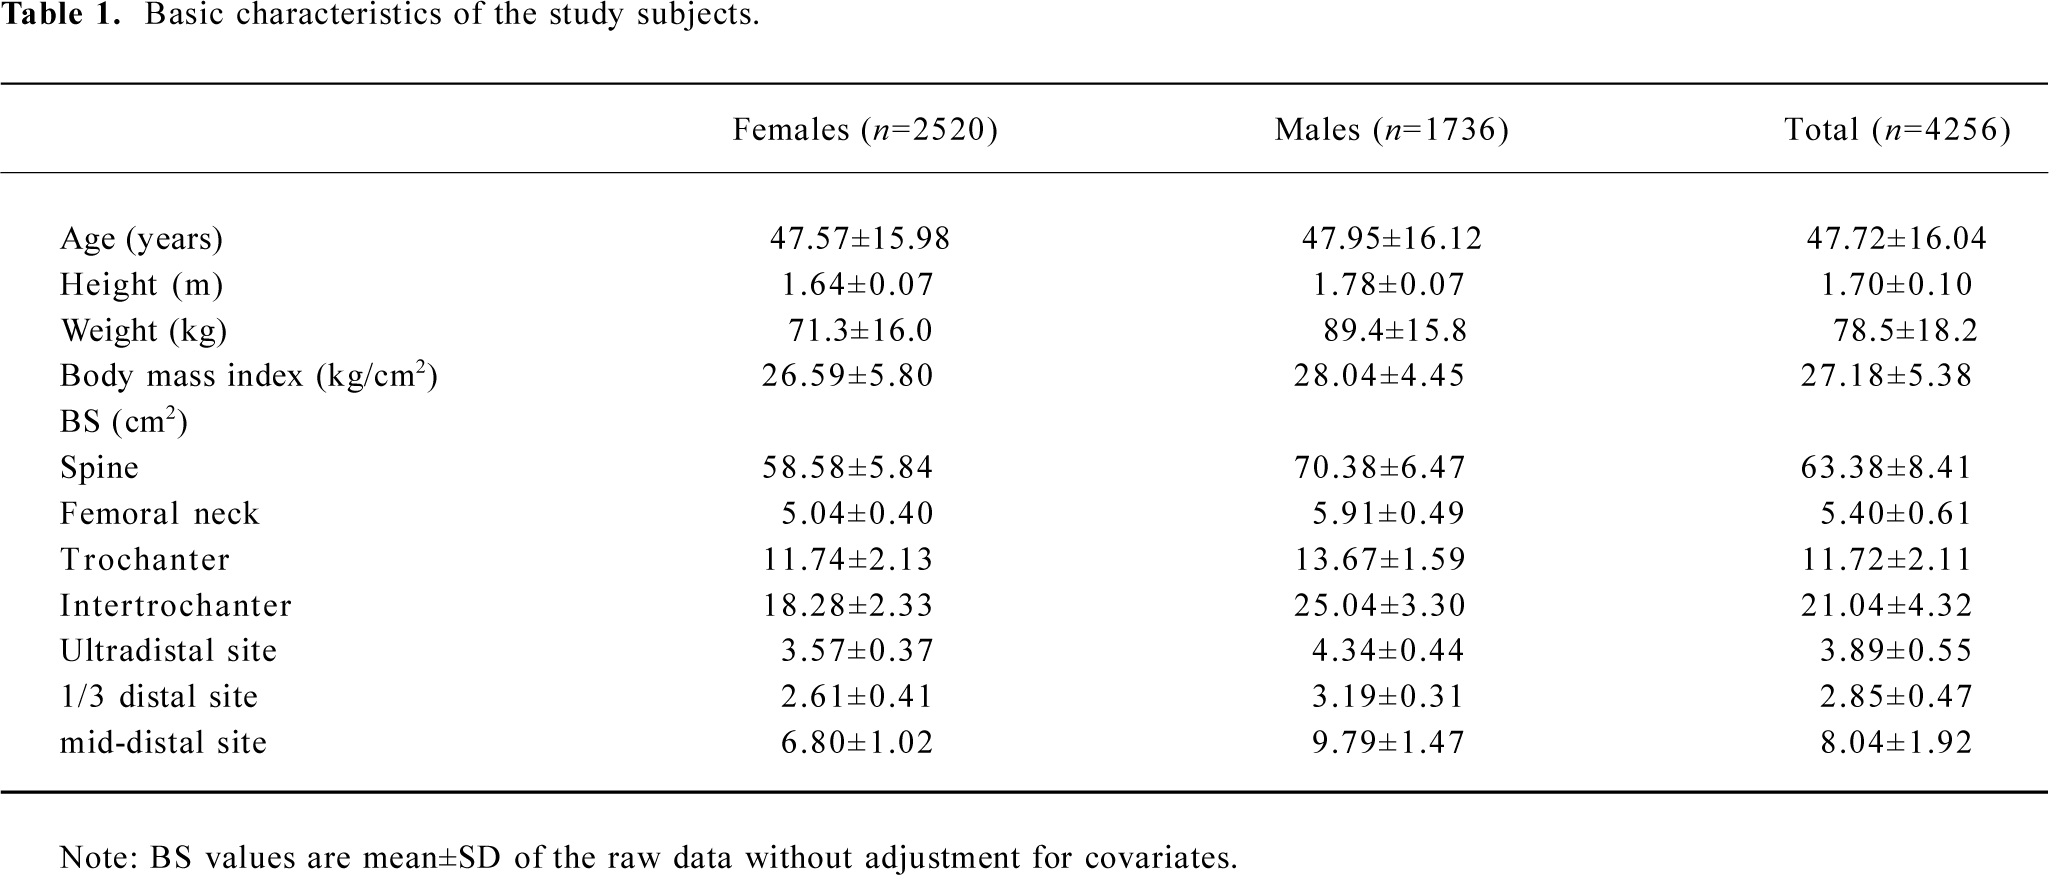
All the study subjects were Caucasians of European origin. The sample contained a total of 4256 phenotyped subjects from 451 pedigrees (see Table 1 for their basic characteristics), of whom 3899 subjects were genotyped. The pedigree size varied from 4 to 416 individuals, with a mean (SD) of 11.6 (28.5), providing us an exceedingly large number of relative pairs (>150 000) informative for the linkage analysis.
Full table
Measurements BS (cm2) at lumbar spine (L1-4), hip (femoral neck, trochanter and intertrochanter), and forearm (ultradistal, mid-distal, and one-third distal) were measured by Hologic 1000, 2000+, or 4500 dual-energy X-ray absorptiometry scanners (Hologic, Waltham, MA, USA). All scanners are calibrated daily, and long-term precision is monitored with external phantoms. The short-term BS measurement precision on the Hologic 4500 is reflected by a coefficient of variation (CV) of 1.11%, 3.25%, 4.37%, 6.42%, 2.36%, 1.29%, and 1.88%, respectively, at the spine, femoral neck, trochanter and intertrochanter regions at the hip, as well as ultradistal radius, mid-distal, and one-third distal areas at the forearm. A similar CV was obtained on the Hologic 1000 and 2000+ scanners. BS measurements by different scanners at our center are highly compatible with one another and are well within the precision limits[23] . In particular, members of the same pedigree were usually measured on the same type of machine, which ensured minimum or no effect on our linkage analyses due to measurements by different scanners. Weight (kg) and height (m) were measured at the same visit of the BS measurement.
Genotyping For each patient, DNA was extracted from peripheral blood using the Puregene DNA isolation kit (Gentra Systems, Minneapolis, MN, USA). Among all the subjects, 3899 individuals were genotyped with 410 microsatellite markers (including 393 markers for 22 autosomes and 17 markers for the X chromosome) from the Marshfield screening set 14 by the Marshfield Center for Medical Genetics. The markers had an average population heterozygosity of 0.75 and were spaced on average 8.9 cM apart. The detailed genotyping protocol is available at http://research.marshfieldclinic.org/genetics/Lab_Methods/methods.html. A database management system, including GenoDB[24], was employed to manage the phenotype and genotype data for the linkage analysis. GenoDB was also used for allele bining (including setting up allele bining criteria and converting allele sizes to distinct allele numbers), data quality control, and data formatting for PedCheck[25] and linkage analysis. PedCheck was performed to ensure that the genotype data conform to the Mendelian inheritance pattern at all the marker loci. In addition, we used MERLIN[26] to detect genotyping errors of unlikely recombination (eg double recombination) in our sample. The genotyping error rate of ~0.03% was determined.
Statistical analyses
Correlation analyses Prior to the genetic analysis, descriptive statistics of the sample were analyzed using SPSS version 11.0 software (SPSS, Chicago, IL, USA). We performed a bivariate quantitative genetic analysis to assess genetic and phenotypic correlations using SOLAR v3.0.4 (Sequential Oligogenic Linkage Analysis Routines) software[27], following the procedures detailed in our earlier studies[28].
PCA A PCA was undertaken for the 7 BS phenotypes to avoid the problem of multiple comparisons and redundancy of information, following the method detailed in a previous study[29]. Briefly, the analysis was performed in a 3-step process: (1) extraction of initial components by use of PCA; (2) rotation of components using the varimax option, resulting in elucidation of factors; and (3) interpretation of factors with loadings. The original data, regardless of sex and age, were used in the PCA. The analysis generated principal component (PF) factors (as linear combinations of the variables) for each individual, and the pedigree members were assumed independent for this analysis. The eigenvalue (which represents the variance explained by each of the PC) of 1 criterion was implemented to determine the number of the components and varimax rotation to achieve a better interpretation of the PC. However, only one PC (PCTotal) was extracted in the analysis and there was no need for a further rotation procedure.
QTL analysis Two-point and multipoint linkage analyses across 22 autosomes and a 2-point linkage analysis on chromosome X were performed using SOLAR. Under polygenic models, covariates age, sex, height, and weight were tested for importance on the PCTotal variation. Significant covariates (P<0.05) were used to adjust the PC within the linkage model in SOLAR.
The sex bias observed in BS led us to investigate whether there was sex-specific evidence for linkage in these families. The original BS data were stratified on the basis of sex, with the male set generated by setting the females to “unknown”, and vice versa for the female data set. The new male (nm=1736) and new female (nf=2520) data sets were used in the PCA and the linkage analysis as described earlier. The PCA generated 1 PC from the male-only subset (PCM) and one PC from female-only data subset (PCF). Age, height, and weight were tested, and significant factors (P=0.05) were adjusted as covariates in the linkage analysis. Furthermore, the Marshfield sex-specific genetic maps were used in the subgroup analysis.
The normality of distribution of the PC phenotypes was estimated through kurtosis that was 0.63, 0.75, and 0.68 for PCTotal, PCF, and PCM, respectively. Although the variance component analyses implemented in SOLAR are quite robust to slight deviation from normality (kurtosis <2.0), we still carried out 10 000 replicates of the overall data set, as well as the male-only and female-only data subsets, using the procedure “lodadj” implemented in SOLAR[30] to correct for such deviations and to test the robustness of our results. All the results were reported as adjusted logarithm of odds [LOD] scores by multiplying the original LOD scores by a correction constant that were 1.00, 0.95 and 0.95 for PCTotal, PCF and PCM, respectively. The proportion of expected LOD scores greater than the observed LOD score is the latter’s empirical P-value. Because we conducted 2 independent genome-wide scans for the sex-specific analyses, we conducted a Bonferroni adjustment approach following Lander et al[31]. The LOD thresholds increased from 1.90 to 2.45 for suggestive linkage, and from 3.30 to 3.87 for significant linkage.
Results
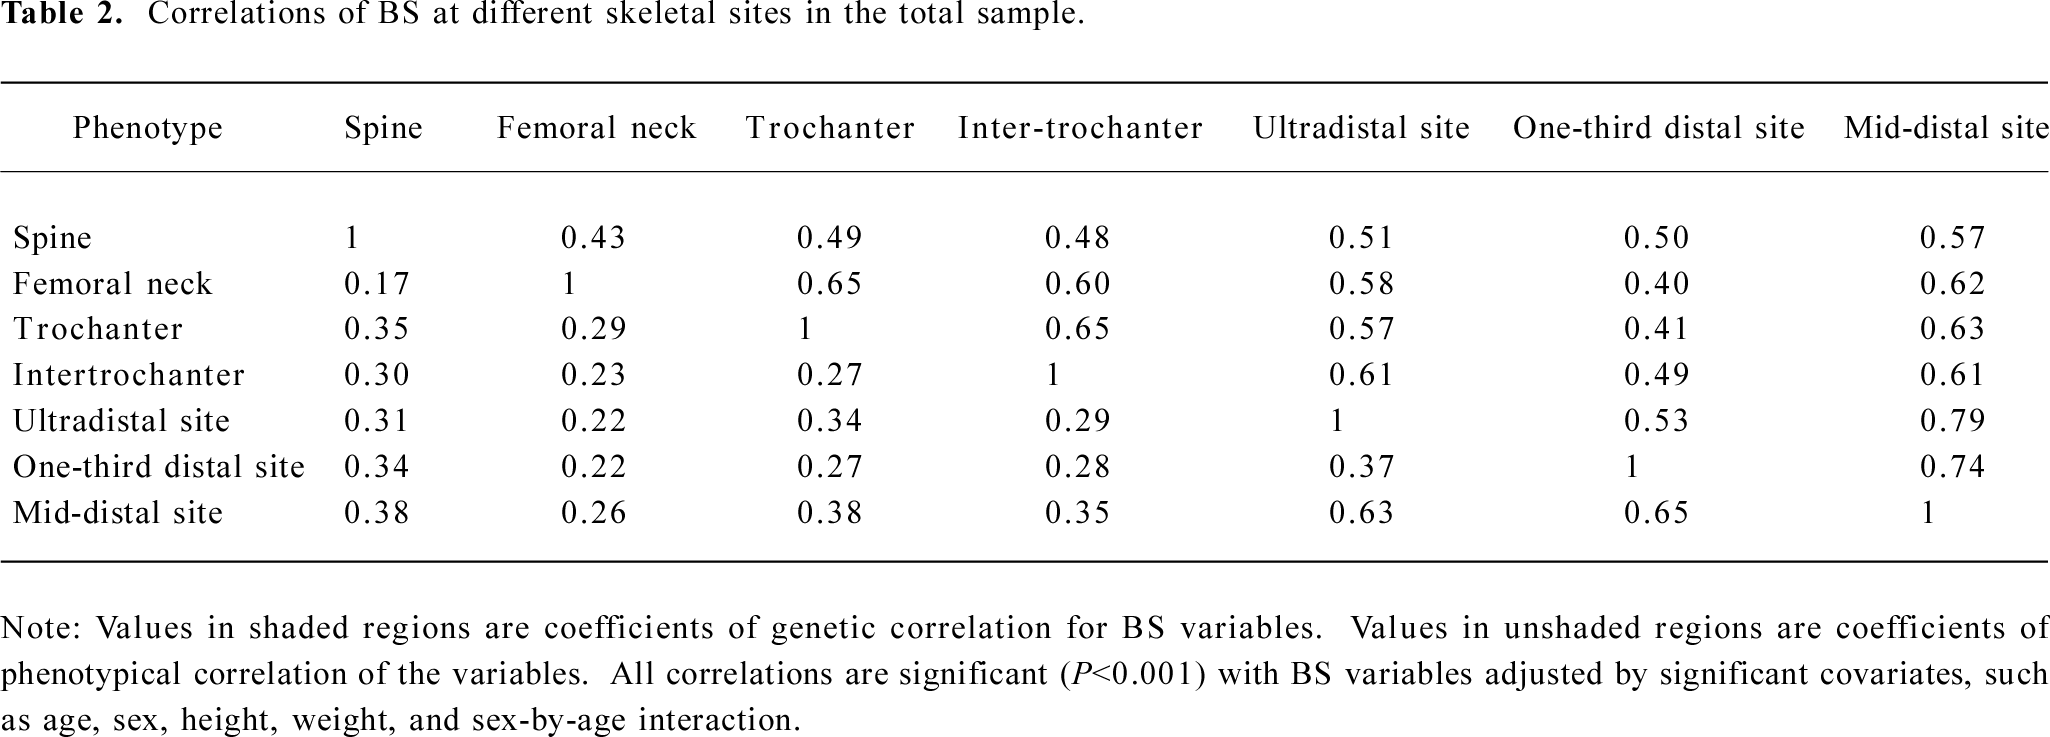
Table 1 summarizes the basic characteristics of the study subjects. The data showed that males had significant greater values for all the descriptive statistics except for age than females (t-test P<0.001). All of the 7 BS variables were significantly correlated both genetically and phenotypically (Table 2). The genetic and phenotypical correlations of BS at different skeletal sites ranged from 0.40 to 0.79, and from 0.17 to 0.65, respectively. The square of the genetic correlation that approximates shared genetic effects between 2 traits is in the range of 16%−63%, indicating the existence of common genetic factors governing a clustering of BS phenotypes.
Full table
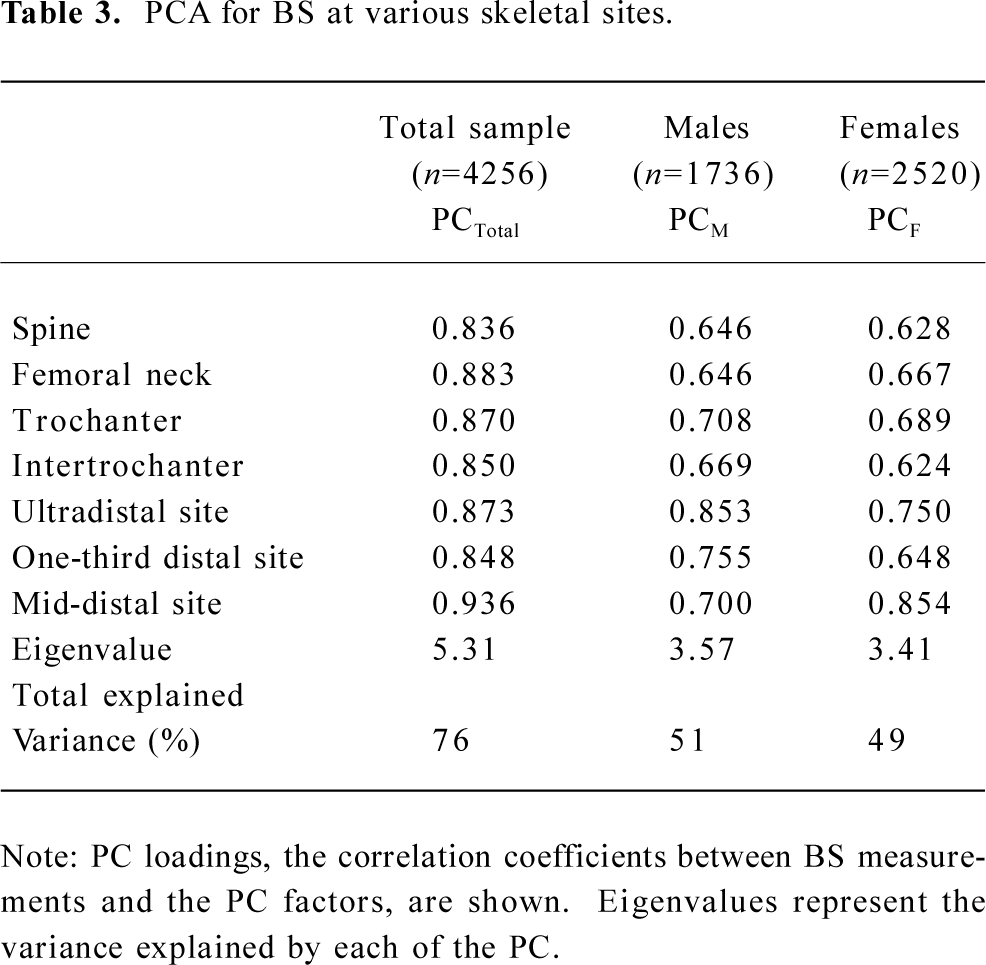
Table 3 shows the results of the PCA analysis. For the 7 BS measurements, 1 PC, with eigenvalue =1.0, was retained in the overall data set, as well as the male-only and female-only data subsets, which accounted for 76%, 49%, and 51% of the total variation of the 7 BS measurements, respectively. The PC loadings (which are the correlation between each variable and the component) ranged from 0.84 to 0.94 for the total sample, 0.65 to 0.85 for females, and 0.62 to 0.85 for males, respectively.
Full table
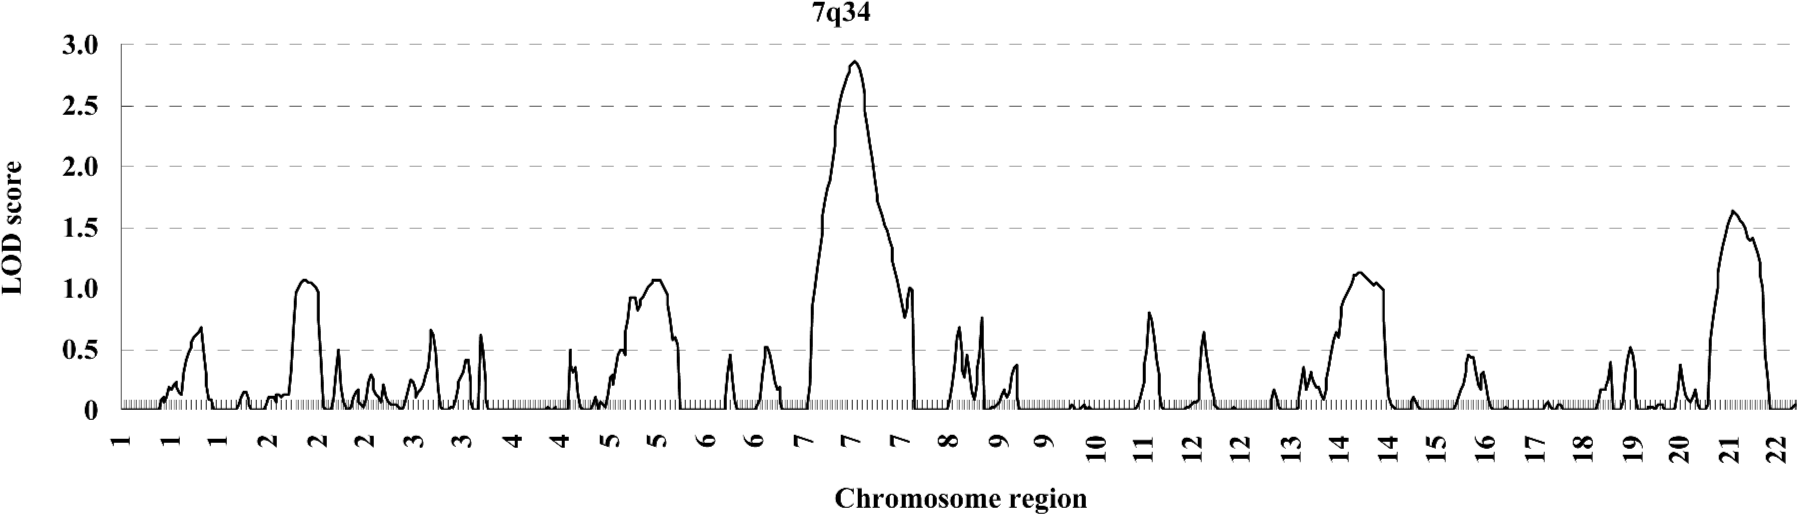
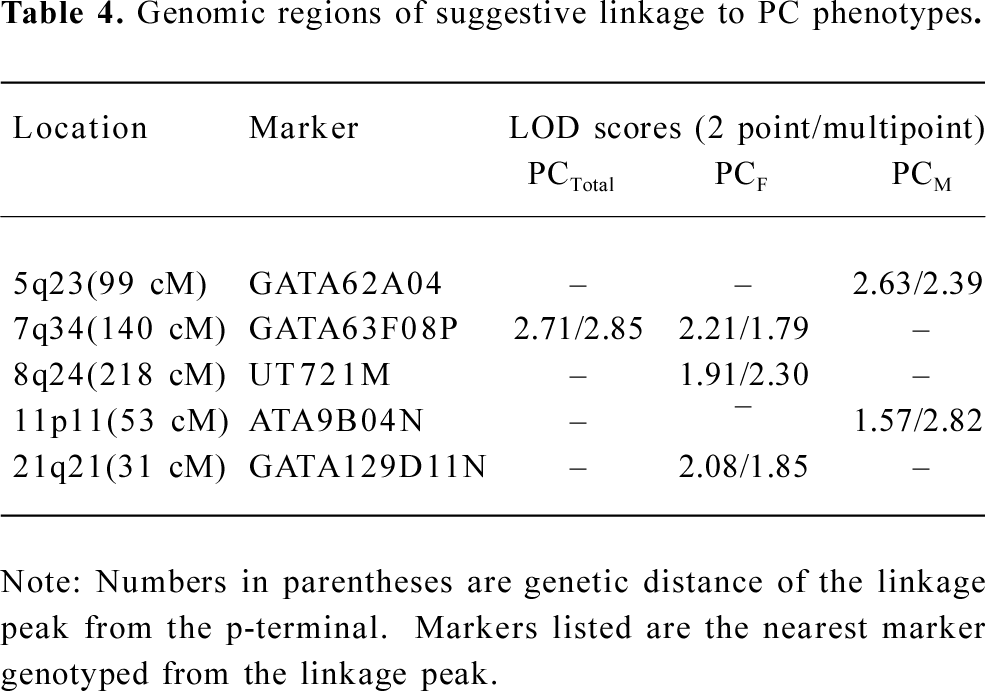
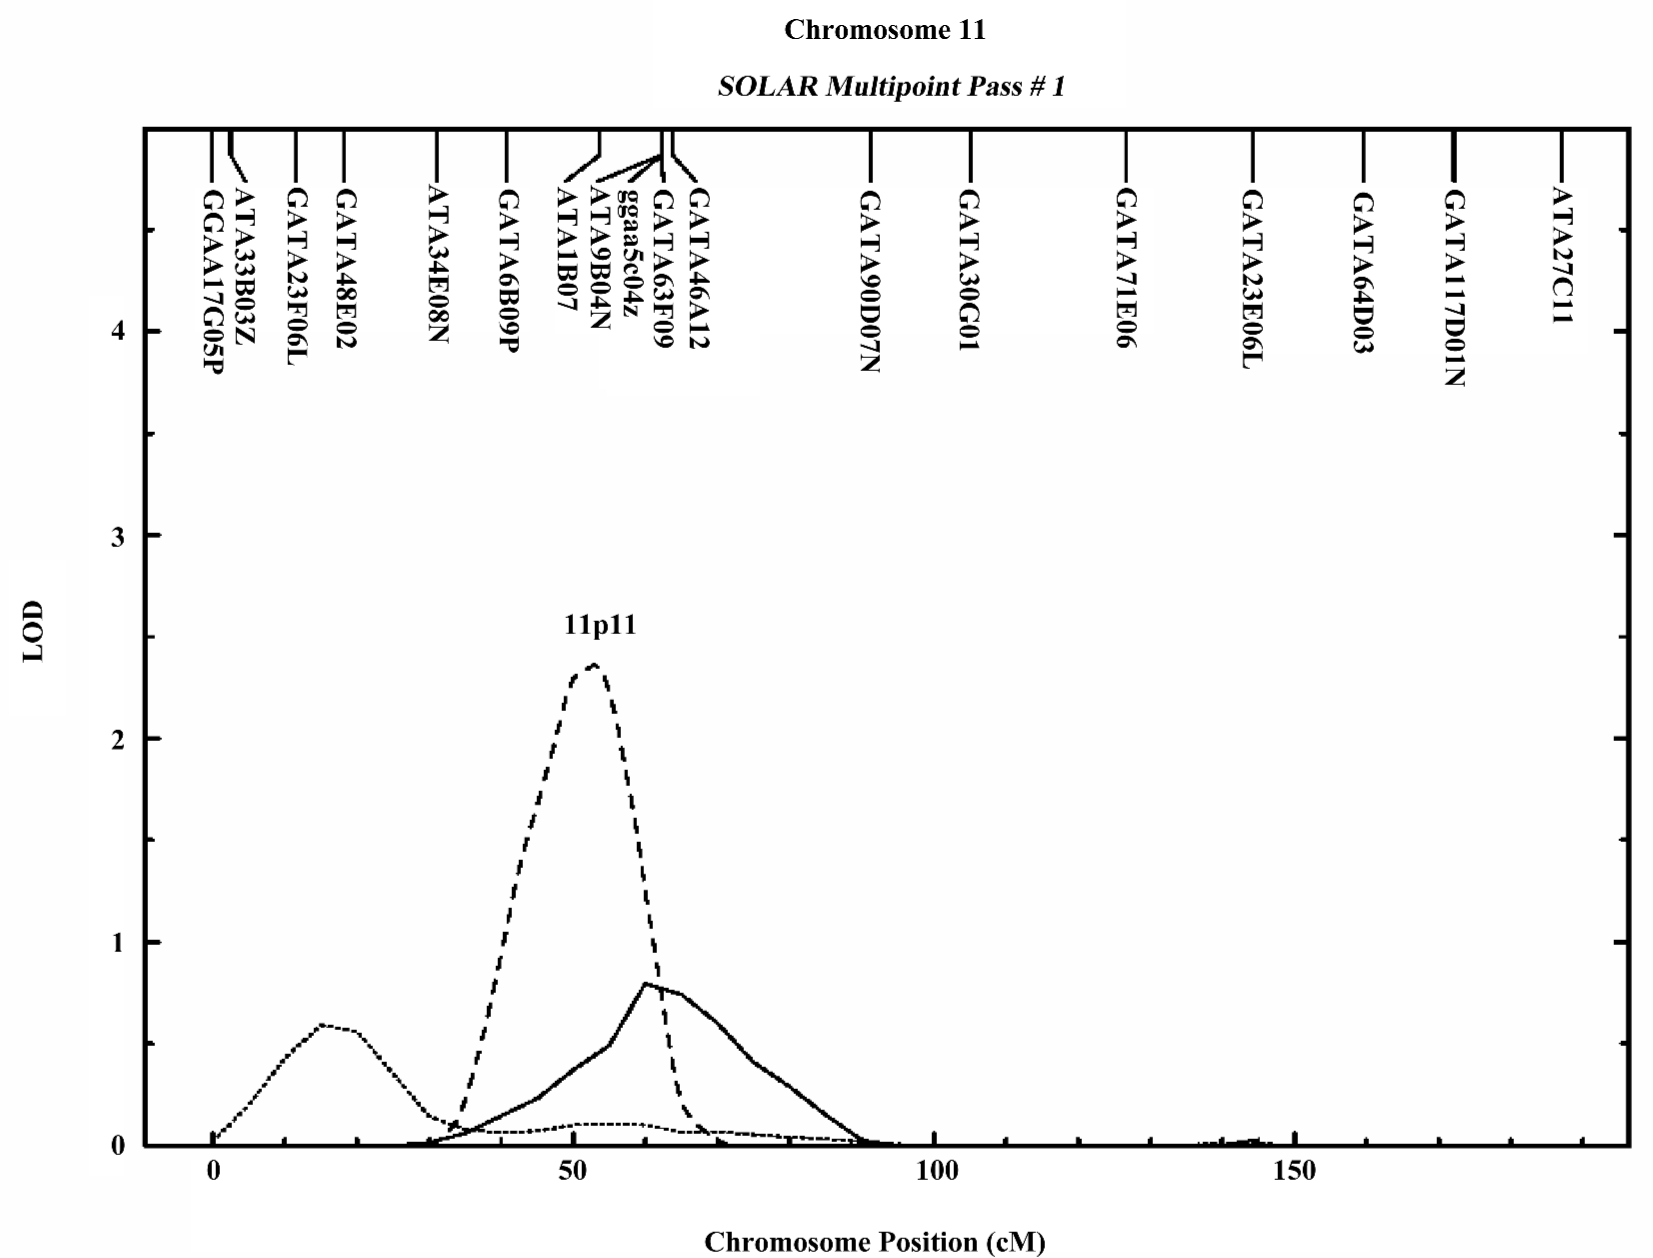
In the variance component analysis of the PC, the heritability of PCTotal, PCF, and PCM were (mean±SEM) 0.64±0.03, 0.59±0.03, and 0.56±0.03 (data not shown), respectively, revealing that PC were under significant genetic influences. The results of the genome-wide linkage analysis in the overall sample are provided in Figure 1 and Table 4. The strongest linkage signal was detected on chromosomes 7q34 (140 cM, LOD=2.85, empirical P<0.0001). Sex-specific analyses resulted in additional evidence for linkage on chromosome 11 at 53 cM (Figure 2), with a LOD score of 2.82 (P<0.0001).
Full table
Discussion
Previously, we reported a whole genome linkage scan for BS variation in 451 Caucasian pedigrees[17]. Several genomic regions were suggested to be linked to BS variation. To detect pleiotropic genomic regions for BS, we conducted a second genome-wide linkage scan in the same sample. In this study, significant and high-genetic correlations of BS at multiple skeletal sites were observed, implying that BS at different skeletal sites may share some genetic determinations. We then performed PCA and whole genome linkage scan, and identified a suggestive QTL influencing the BS of multiple skeletal sites on chromosome 7q34, with a LOD score of 2.85 at 140 cM.
PCA is a variable reduction procedure that extracts uncorrelated factors from correlated variables to obtain an independent PC that explains the vast majority of the correlated phenotypic variations. In this study, the joint analyses of the 7 correlated BS measurements may allow us to identify the loci which have common effects to a set of BS measured at different sites. However, the genetic effects at pleiotropic loci/genomic regions identified are not allowed to possibly have different contributions to each BS measured. In our PCA we extracted a PC factor (PCTotal) which explains over 76% of the total BS variation of multiple sites. Strong evidence of linkage was detected on chromosome 7q34 for the combined BS phenotypes, but no linkage evidence was found for BS at each individual skeletal site at this region (data not shown), suggesting that PC may provide more information for linkage analysis than each individual trait.
Chromosome 7q34 is an interesting region since the importance of this genomic region has been highlighted in previous studies. In a white sibling sister pairs study, Koller et al found a significant linkage peak at this region (LOD =5.0) for femur head width[32] Kato et al also mapped Silver–Russell syndrome, which involves short stature and dysmorphology, to chromosome 7q34[33]. Three candidate genes present in the 1 LOD unit drop support interval (11 cM) of the 7q34 signal are involved in pathways of bone metabolism, including leptin and interferon regulatory factor 5. Leptin is secreted primarily by adipocytes, with its function to control both bone formation and resorption[34,35]. Foldes et al[36] reported that femoral BS in obese leptin receptor-deficient (homozygous) rats decreased. A recent study also showed that leptin is involved in genetic variation of hand BS and geometry[37].
Investigations of sex-specific genetic variants of complex disorders are recommended[38,39], especially when the disorder exhibits a skewed sex ratio in severity and/or prevalence. The appropriate criteria for assessing genome-wide significance in a sex-specific linkage analysis merit some additional discussion. In our study, we used the rigorous Bonferroni criterion for interpretation of the linkage results. Furthermore, the sex-specific QTL should be interpreted with caution and merit further justification because other factors, such as gene-by-sex interaction, may also lead to sex difference of linkage signals in the subgroup analyses of the 2 sexes.
In the present study, we observed a male-specific QTL on chromosome 11p11. The importance of chromosome 11 was previously reported to show pleiotropic effect on 4r size phenotypes (BS, muscle size, body length, and body weight) in mice[40]. A prominent candidate gene, exostoses 2 (EXT2), underlies the 1-LOD unit drop interval on chromosome 11. The EXT2 gene encodes an essential component of the glycosyltransferase complex required for the biosynthesis of heparan sulfate, which modulates the signaling involved in bone formation[41]. Furthermore, mutations or deficiencies in the EXT2 gene cause multiple bone diseases, including hereditary multiple exostosis[42] and osteochondromas[43]. These findings suggest the potential importance of chromosomal 11p11 in bone metabolism.
In conclusion, we reported a genome-wide linkage analysis for the PC of 7 BS measurements. Our large sample containing more than 150 000 informative relationships makes the results of the linkage analysis powerful and reliable. Evidence of suggestive linkages was observed on the chromosome regions of 7q34 in the overall sample, and 11p11 in the males. Our findings warrant further fine-mapping efforts or focused studies in fine mapping analyses on these identified regions to pinpoint functional mutations of the pleiotropic effects on BS variation at multiple skeletal sites.
Author contributions
Li-jun TAN, Robert R RECKER, and Hong-wen DENG designed research; Peng XIAO and Peng-yuan LIU performed research; Peng XIAO contributed new reagents or analytic tools; Li-jun TAN, Fang YANG, Zi-hui TANG, and Peng-yuan LIU analyzed data; Li-jun TAN and Yao-zhong LIU wrote the paper.
Acknowledgements
We thank all the study subjects for volunteering to participate in the study. The genotyping experiment was performed by Marshfield Center for Medical Genetics and was supported by National Heart, Lung, and Blood Institute (NHLBI) Mammalian Genotyping Service (contract N
References
- Peacock M, Turner CH, Liu G, Manatunga AK, Timmerman L, Johnston CC. Better discrimination of hip fracture using bone density, geometry and architecture. Osteoporos Int 1995;5:167-73.
- Vega E, Ghiringhelli G, Mautalen C, Rey VG, Scaglia H, Zylberstein C. Bone mineral density and bone size in men with primary osteoporosis and vertebral fractures. Calcif Tissue Int 1998;62:465-9.
- Seeman E, Duan Y, Fong C, Edmonds J. Fracture site-specific deficits in bone size and volumetric density in men with spine or hip fractures. J Bone Miner Res 2001;16:120-7.
- Ammann P, Rizzoli R. Bone strength and its determinants. Osteoporos Int 2003;14 Suppl 3:S13-18.
- Stone KL, Seeley DG, Lui LY, Cauley JA, Ensrud K, Browner WS, et al. BMD at multiple sites and risk of fracture of multiple types: long-term results from the Study of Osteoporotic Fractures. J Bone Miner Res 2003;18:1947-54.
- Liu YJ, Shen H, Xiao P, Xiong DH, Li LH, Recker RR, et al. Molecular genetic studies of gene identification for osteoporosis: a 2004 update. J Bone Miner Res 2006;21:1511-35.
- Deng HW, Deng XT, Conway T, Xu FH, Heaney R, Recker RR. Determination of bone size of hip, spine, and wrist in human pedigrees by genetic and lifestyle factors. J Clin Densitom 2002;5:45-56.
- Jian WX, Long JR, Deng HW. High heritability of bone size at the hip and spine in Chinese. J Hum Genet 2004;49:87-91.
- Long JR, Liu PY, Lu Y, Xiong DH, Zhao LJ, Zhang YY, et al. Association between COL1A1 gene polymorphisms and bone size in Caucasians. Eur J Hum Genet 2004;12:383-8.
- Lei SF, Deng FY, Xiao SM, Chen XD, Deng HW. Association and haplotype analyses of the COL1A2 and ER-alpha gene polymorphisms with bone size and height in Chinese. Bone 2005;36:533-41.
- Ferrari SL, Deutsch S, Choudhury U, Chevalley T, Bonjour JP, Dermitzakis ET, et al. Polymorphisms in the low-density lipoprotein receptor-related protein 5 (LRP5) gene are associated with variation in vertebral bone mass, vertebral bone size, and stature in whites. Am J Hum Genet 2004;74:866-75.
- Liu YJ, Liu XH, Lei SF, Li MX, Deng HW. Alpha2-HS glycoprotein gene is associated with bone size at the hip in Chinese. Yi Chuan Xue Bao 2005;32:1128-35.
- Schuit SC, van Meurs JB, Bergink AP. Height in pre- and postmenopausal women is influenced by estrogen receptor alpha gene polymorphisms. J Clin Endocrinol Metab 2004;89:303-9.
- Zmuda JM, Cauley JA, Kuller LH, Ferrell RE. A common promotor variant in the cytochrome P450c17alpha (CYP17) gene is associated with bioavailability testosterone levels and bone size in men. J Bone Miner Res 2001;16:911-7.
- Huang QY, Xu FH, Shen H, Deng HY, Conway T, Liu YJ, et al. Genome scan for QTLs underlying bone size variation at 10 refined skeletal sites: genetic heterogeneity and the significance of phenotype refinement. Physiol Genomics 2004;17:326-31.
- Deng HW, Shen H, Xu FH, Deng H, Conway T, Liu YJ, et al. Several genomic regions potentially containing QTLs for bone size variation were identified in a whole-genome linkage scan. Am J Med Genet A 2003;119:121-31.
- Shen H, Long JR, Xiong DH, Guo YF, Xiao P, Liu YZ, et al. A genomewide scan for quantitative trait loci underlying areal bone size variation in 451 Caucasian families. J Med Genet 2006;43:873-80.
- Tommasini SM, Nasser P, Jepsen KJ. Sexual dimorphism affects tibia size and shape but not tissue-level mechanical properties. Bone 2007;40:498-505.
- Beck TJ, Ruff CB, Shaffer RA, Betsinger K, Trone DW, Brodine SK. Stress fracture in military recruits: gender differences in muscle and bone susceptibility factors. Bone 2000;27:437-44.
- Cummings SR, Melton LJ. Epidemiology and outcomes of osteoporotic fractures. Lancet 2002;359:1761-7.
- Kellie SE, Brody JA. Sex-specific and race-specific hip fracture rates. Am J Public Health 1990;80:326-8.
- Deng HW, Deng H, Liu YJ, Liu YZ, Xu FH, Shen H, et al. A genomewide linkage scan for quantitative-trait loci for obesity phenotypes. Am J Hum Genet 2002;70:1138-51.
- Deng HW, Chen WM, Conway T, Zhou Y, Davies KM, Stegman MR, et al. Determination of bone mineral density of the hip and spine in human pedigrees by genetic and life-style factors. Genet Epidemiol 2000;19:160-77.
- Li JL, Deng H, Lai DB, Xu F, Chen J, Gao G, et al. Toward high-throughput genotyping: dynamic and automatic software for manipulating large-scale genotype data using fluorescently labeled dinucleotide markers. Genome Res 2001;11:1304-14.
- O’Connell JR, Weeks DE. PedCheck: a program for identification of genotype incompatibilities in linkage analysis. Am J Hum Genet 1998;63:259-66.
- Abecasis GR, Cherny SS, Cookson WO, Cardon LR. Merlin––rapid analysis of dense genetic maps using sparse gene flow trees. Nat Genet 2002;30:97-101.
- Almasy L, Blangero J. Multipoint quantitative-trait linkage analysis in general pedigrees. Am J Hum Genet 1998;62:1198-211.
- Yang YJ, Dvornyk V, Jian WX, Xiao SM, Deng HW. Genetic and environmental correlations between bone phenotypes and anthropometric indices in Chinese. Osteoporos Int 2005;16:1134-40.
- Karasik D, Cupples LA, Hannan MT, Kiel DP. Genome screen for a combined bone phenotype using principal component analysis: the Framingham study. Bone 2004;34:547-56.
- Blangero J, Williams JT, Almasy L. Robust LOD scores for variance component-based linkage analysis. Genet Epidemiol 2000;19 Suppl 1:S8-14.
- Lander E, Kruglyak L. Genetic dissection of complex traits: guidelines for interpreting and reporting linkage results. Nat Genet 1995;11:241-7.
- Koller DL, White KE, Liu G, Hui SL, Conneally PM, Johnston CC, et al. Linkage of structure at the proximal femur to chromosomes 3, 7, 8, and 19. J Bone Miner Res 2003;18:1057-65.
- Kato R, Kishibayashi J, Shimokawa O, Harada N, Niikawa N, Matsumoto N. Congenital glaucoma and Silver-Russell phenotype associated with partial trisomy 7q and monosomy 15q. Am J Med Genet 2001;104:319-22.
- Holloway WR, Collier FM, Aitken CJ, Myers DE, Hodge JM, Malakellis M, et al. Leptin inhibits osteoclast generation. J Bone Miner Res 2002;17:200-9.
- Livshits G, Pantsulaia I, Trofimov S, Kobyliansky E. Genetic variation of circulating leptin is involved in genetic variation of hand bone size and geometry. Osteoporos Int 2003;14:476-83.
- Foldes J, Shih MS, Levy J. Bone structure and calcium metabolism in obese Zucker rats. Int J Obes Relat Metab Disord 1992;16:95-102.
- Elefteriou F, Takeda S, Ebihara K, Magre J, Patano N, Kim CA, et al. Serum leptin level is a regulator of bone mass. Proc Natl Acad Sci USA 2004;101:3258-63.
- Suresh R, Ambrose N, Roe C, Pluzhnikov A, Wittke-Thompson JK, Ng MC, et al. New complexities in the genetics of stuttering: significant sex-specific linkage signals. Am J Hum Genet 2006;78:554-63.
- Weiss LA, Pan L, Abney M, Ober C. The sex-specific genetic architecture of quantitative traits in humans. Nat Genet 2006;38:218-22.
- Masinde GL, Wergedal J, Davidson H, Mohan S, Li R, Li X, et al. Quantitative trait loci for periosteal circumference (PC): identification of single loci and epistatic effects in F2 MRL/SJL mice. Bone 2003;32:554-60.
- Morimoto K, Shimizu T, Furukawa K, Morio H, Kurosawa H, Shirasawa T. Transgenic expression of the EXT2 gene in developing chondrocytes enhances the synthesis of heparan sulfate and bone formation in mice. Biochem Biophys Res Commun 2002;292:999-1009.
- Stickens D, Zak BM, Rougier N, Esko JD, Werb Z. Mice deficient in Ext2 lack heparan sulfate and develop exostoses. Development 2005;132:5055-68.
- Signori E, Massi E, Matera MG, Poscente M, Gravina C, Falcone G, et al. A combined analytical approach reveals novel EXT1/2 gene mutations in a large cohort of Italian multiple osteochondromas patients. Genes Chromosomes Cancer 2007;46:470-7.