
Association of human carboxypeptidase E exon5 gene polymorphisms with angiographical characteristics of coronary atherosclerosis in a Chinese population1
Introduction
Carboxypeptidase E (CPE) is a member of the metallocar boxypeptidase gene family that includes regulatory carboxypeptidases, digestive carboxypeptidase, and several proteins that do not have detectable enzyme activity. Proinsulin is converted into insulin and C peptide by the concerted action of prohormone convertase (PC) 2, PC3, and CPE[1], which is the major carboxypeptidase involved in the biosynthesis of numerous peptide hormones and neurotransmitters[2]. Proinsulin increases in patients with impaired glucose tolerance[3] or type 2 diabetes[4], which suggest that functional DNA variants in proinsulin processing enzymes, such as CPE, might cause human type 2 diabetes mellitus (T2DM) as a result of deficient proinsulin processing. A study uncovered a rare non-conservative missense mutation in the CPE gene and suggested that the mutant could cause hyperproinsulinemia and diabetes in the homozygous state by altering enzymatic properties[2]. A single amino acid change (Ser202Pro) results in significantly reduced levels of CPE enzyme activity and elevated levels of proinsulin. As a result, the identification of a mutation in the CPE gene of the fat/fat mouse, which leads to marked hyperproinsulinemia, late-onset obesity, and diabetes, is consistent with a possible role in mutations in CPE during the development of diabetes and obesity in humans[1,5]. In addition, in contrast to specific insulin, proinsulin was recently shown to be a long-term predictive factor of coronary heart disease (CHD) in middle-aged men in the UK[6] and Sweden[7,8]. Also, in studies with a short follow up, proinsulin has predicted myocardial infarction[9] and first-ever stroke[10]. Large-scale prospective epidemiological studies have indicated that hyperinsulinemia[11-13] and glucose intolerance[14] are associated with the development of coronary artery disease. Båvenholm et al[14] suggested a close association between proinsulin levels and coronary atherosclerosis in inhabitants of Stockholm county. Therefore, it is hypothesized that some functional variants and single nucleotide polymorphisms (SNP) in the CPE gene may be responsible for coronary atherosclerosis and CHD. In fact, Chen et al[2] found 2 distinct variants (R283W, c. 847C>T and H267H, c. 801C>T) in the CPE gene exon5 coding region in a collection of Ashkenazi. The arginine 283 is present in the carboxypeptidase motif, and the H267H, c. 801C>T could potentially affect enzyme function. However, there is little information available about the association between the SNP of the CPE gene and the angiographical characteristics of coronary atherosclerosis estimated by conventional coronary angiography, blood glucose, insulin resistance, and hyperproinsulinemia level, so we conducted a molecular epidemiological study of coronary atherosclerosis in a Chinese population. We genotyped both the 801C>T and 847C>T polymorphisms in 1044 consecutive patients who underwent coronary angiography for suspected or known coronary atherosclerosis, and evaluated the possible association of these 2 polymorphisms of the CPE gene exon 5 with the severity of coronary atherosclerosis defined by the Gensini’s score (GS) system[15].
Materials and methods
Study patients The studied population consisted of 1044 consecutive patients (777 men and 267 women) who underwent coronary angiography for suspected or known coronary atherosclerosis at the First Affiliated Hospital of Nanjing Medical University, Nanjing, China, from 2004 to 2006. All of the patients were genetically unrelated ethnic Han Chinese. Patients with spastic angina pectoris (ie acetylcholine positive) were excluded. Patients with infectious processes within 2 weeks before catheterization, heart failure (Killip class >=2 after acute myocardial infarction), hepatic dysfunction, vascular disease (aortitis treated with prednisolone), familial hypercholesterolemia, thyroid dysfunction, or adrenal dysfunction were also excluded. Each patient was scheduled for an interview, and a structured questionnaire was administered by interviewers to collect information on demographic data, family history of CHD (any kind of CHD in first-degree relatives), medical history, current medications, and environmental exposure history, such as cigarette smoking and alcohol intake of the patients. Informed consent was obtained from each patient before entering the study, and the study was assessed and approved by the institutional Ethics Committee of the First Affiliated Hospital of Nanjing Medical University.
Coronary angiography Coronary arteries were cannulated by using Judkins technique[16] with 5F catheters, and recorded on Kodak 3 mm cinefilm (New York) at a rate of 30 frames per second. The GS system was calculated to provide a measurement of the extent and severity of atherosclerosis, based on the hypothesis that the severity of CHD should be considered as a consequence of the functional significance of the vascular narrowing and the extent of the area perfused by the involved vessel or vessels[17-19]. In this score system, the percentage of diameter stenosis was weighed from 1 to 32 for 25%–100% obstruction, and each segment was weighed from 0.5 to 5, depending on the functional significance of the area supplied by that segment. The product of these 2 weights was the total weight for each arterial segment. The severity score is the sum of all total weights. A greater reduction of the lumen diameter was assigned a higher score than a distal lesion in this system.
Anthropometric measurements Anthropometric measurements were taken after the patients had removed their shoes and upper garments and had donned an examination gown. Height was measured to the nearest 0.1 cm using a wall-mounted stadiometer. Weight was measured to the nearest 0.1 kg using a hospital balance beam scale. Body mass index (BMI) was calculated as weight (kg) divided by the square of height (m2). Blood pressure was measured in the right arm with the participant seated and the arm bared. Three readings were recorded for each individual, and the average was recorded.
Biochemical measurements Before cardiac catheteri-zation, fasting blood samples for the biochemical measurements and DNA isolation were obtained from all patients who had been admitted to the coronary care unit of the First Affiliated Hospital of Nanjing Medical University in the morning after an overnight fast. All laboratory measurements were conducted at the Central Clinical Laboratory at this hospital. The following biochemical parameters were determined: total cholesterol (TCH, mmol/L), high-density lipoprotein cholesterol (HDL-C, mmol/L), low-density lipoprotein cholesterol (LDL-C, mmol/L), triglyceride (TG, mmol/L), and fasting blood glucose (FBG, mmol/L) using enzymatic procedures on an autoanalyzer (AU 2700 Olympus, 1st Chemical, Tokyo, Japan). The laboratory was monitored for the precision and accuracy of glucose and lipid measurements by the agency’s surveillance program. Measurements on agency-assigned quality control samples showed no consistent bias over time within or between surveys. The insulin level was measured by using a highly-sensitive 2-site sandwich ELISA[20]. The detection limit was 5 pmol/L. The proinsulin level was measured in a similar manner by using another sensitive 2-site sandwich ELISA[21]. The detection limit in human sera was 0.25 pmol/L. There was no cross-reactivity with human insulin and C peptide. All measurements were performed in duplicate. The 4 monoclonal antibodies, including OXI-005, HUI-018, PEP-001, and HUI-001 were kind gifts from Novo Nordisk, Bagsvaerd, Denmark.
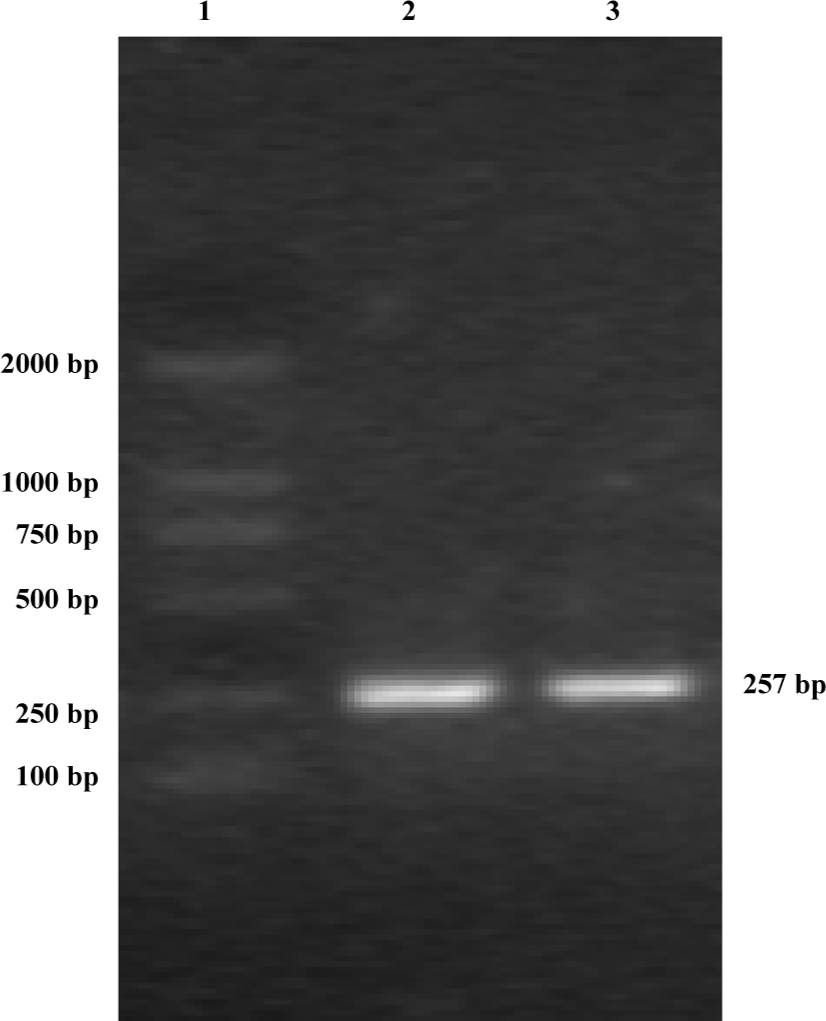
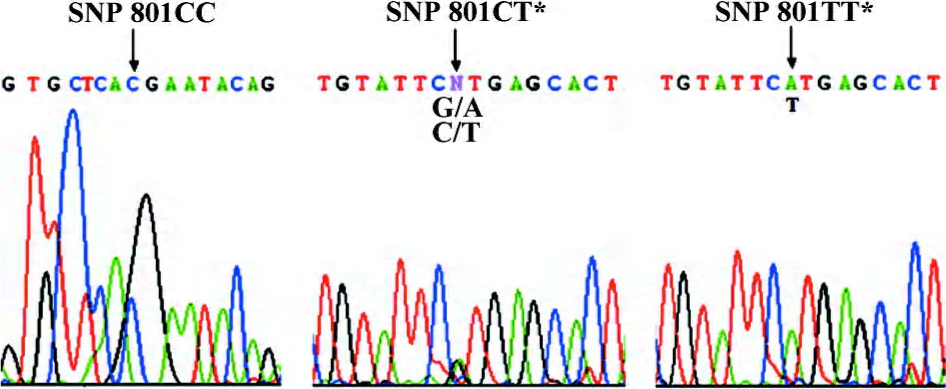
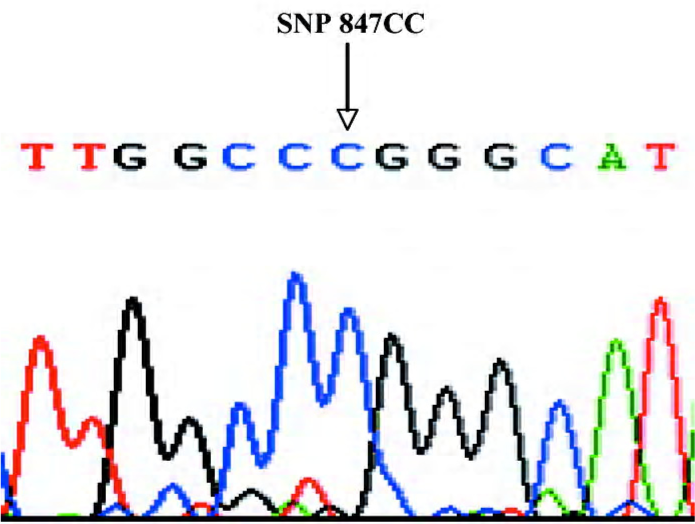
DNA isolation and gene sequencing Genomic DNA was extracted using the Viogene® Blood genomic DNA extraction midiprep system (Sunnyvale, California, USA) from leucocytes in the blood samples taken before the coronary angiography. A region containing the CPE exon5 gene was amplified by PCR using the following primers and conditions. The primers were: 5’-ATGCTGTGCTGCTTGGTCT-3’ (sense) and 5’-AGCACAATGGAAACTCACCT-3’ (anti-sense). Then 50 ng of genomic DNA was amplified in 25 μL reactions containing 10 pmol of each primer, 2.5 mmol/L each dNTP, 1× PCR buffer, 1 mmol/L MgCl2, and 1 unit of Taq polymerase. The PCR conditions were: 98 ºC for 2 mins, followed by 35 cycles of 30 s at 96 ºC, 30 s at 58 ºC, and 45 s at 72 ºC, followed by a 7-min final extension at 72 ºC. Amplification primers were also used as sequence primers. The purified 257 bp PCR product (Figure 1) was detected by bidirectional sequencing using an automated sequencer (ABI PRISM 377 DNA sequencer; Applied Biosystems, Foster City, California, USA). Sequencing results were compared with wild-type sequences published in National Center for Biotechnology Information (NCBI) by the Basic Local Alignment Search Tool (BLAST) comparative search algorithms (www.ncbi.nlm.nih.gov/BLAST/) to genotype the 267th codon, c.801C>T (H267H) locus and 283rd codon, c.847C>T (R283W) locus. As shown in Figures 2 and 3, double peaks were labeled with CT (GA: DNA sequence obtained by the anti-sense primer elongation). Genotyping was performed without knowing the coronary arteries stenosis status of the patients. Furthermore, 10% of the samples were randomly selected to perform the repeated assays, and the results were 100% concordant.
Statistical analysis All patients with a GS >=0 were classified into 4 groups using the quartile values as cut-off points so that each group had an approximate equal number of patients to minimize any bias that may have been produced in the statistical analysis. Data of age, BMI, systolic blood pressure (SBP, mmHg), diastolic blood pressure (DBP, mmHg), TCH (mmol/L), and LDL-C (mmol/L) are normally distributed parameters and presented as mean±SD, whereas skewed data, including HDL-C (mmol/L), TG (mmol/L), FBG (mmol/L), insulin (mIU/L), proinsulin (pmol/L), and homeostasis model assessment (HOMA) insulin resistance (IR) index (IR was estimated by a HOMA model, using specific fasting insulin and glucose concentrations. HOMA IR=FBG×insulin/22.5)[22], were expressed as the median and interquartile range. Differences in selected demographic continuous variables among groups were evaluated by using one-way ANOVA or Kruskal–Wallis test. The selection of these 2 test methods was based on the results of the homogeneity variance test. Categorical variables of sex, smoking status, alcohol consumption status, family history of CHD, and allele frequencies of the CPE gene were compared among the groups of patients by χ2-test. The associations between CPE gene variants and angiographical characteristics of coronary atherosclerosis risk were estimated by computing the odds ratios (ORs) and their 95% confidence intervals (CIs) from the ordinal logistic regression analysis with adjustments for age, sex, BMI, smoking status, and other confounding risk factors. The genotype data were further stratified by subgroups of age, sex, BMI, and smoking. The Hardy–Weinberg equilibrium was tested by a goodness-of-fit χ2-test to compare the observed genotype frequencies to the expected frequencies among all patients. Analysis of covariance, controlling for age, sex, and BMI, was used to test the association between blood glucose, insulin, HOMA IR, proinsulin, and the CPE polymorphism. Differences were considered to be significant if the null hypothesis could be rejected with >95% confidence. All P-values are 2-tailed, and all statistical computations and analyses were performed with statistical analysis system software (version 8.0e; SAS Institute, Cary, NC, USA).
Results
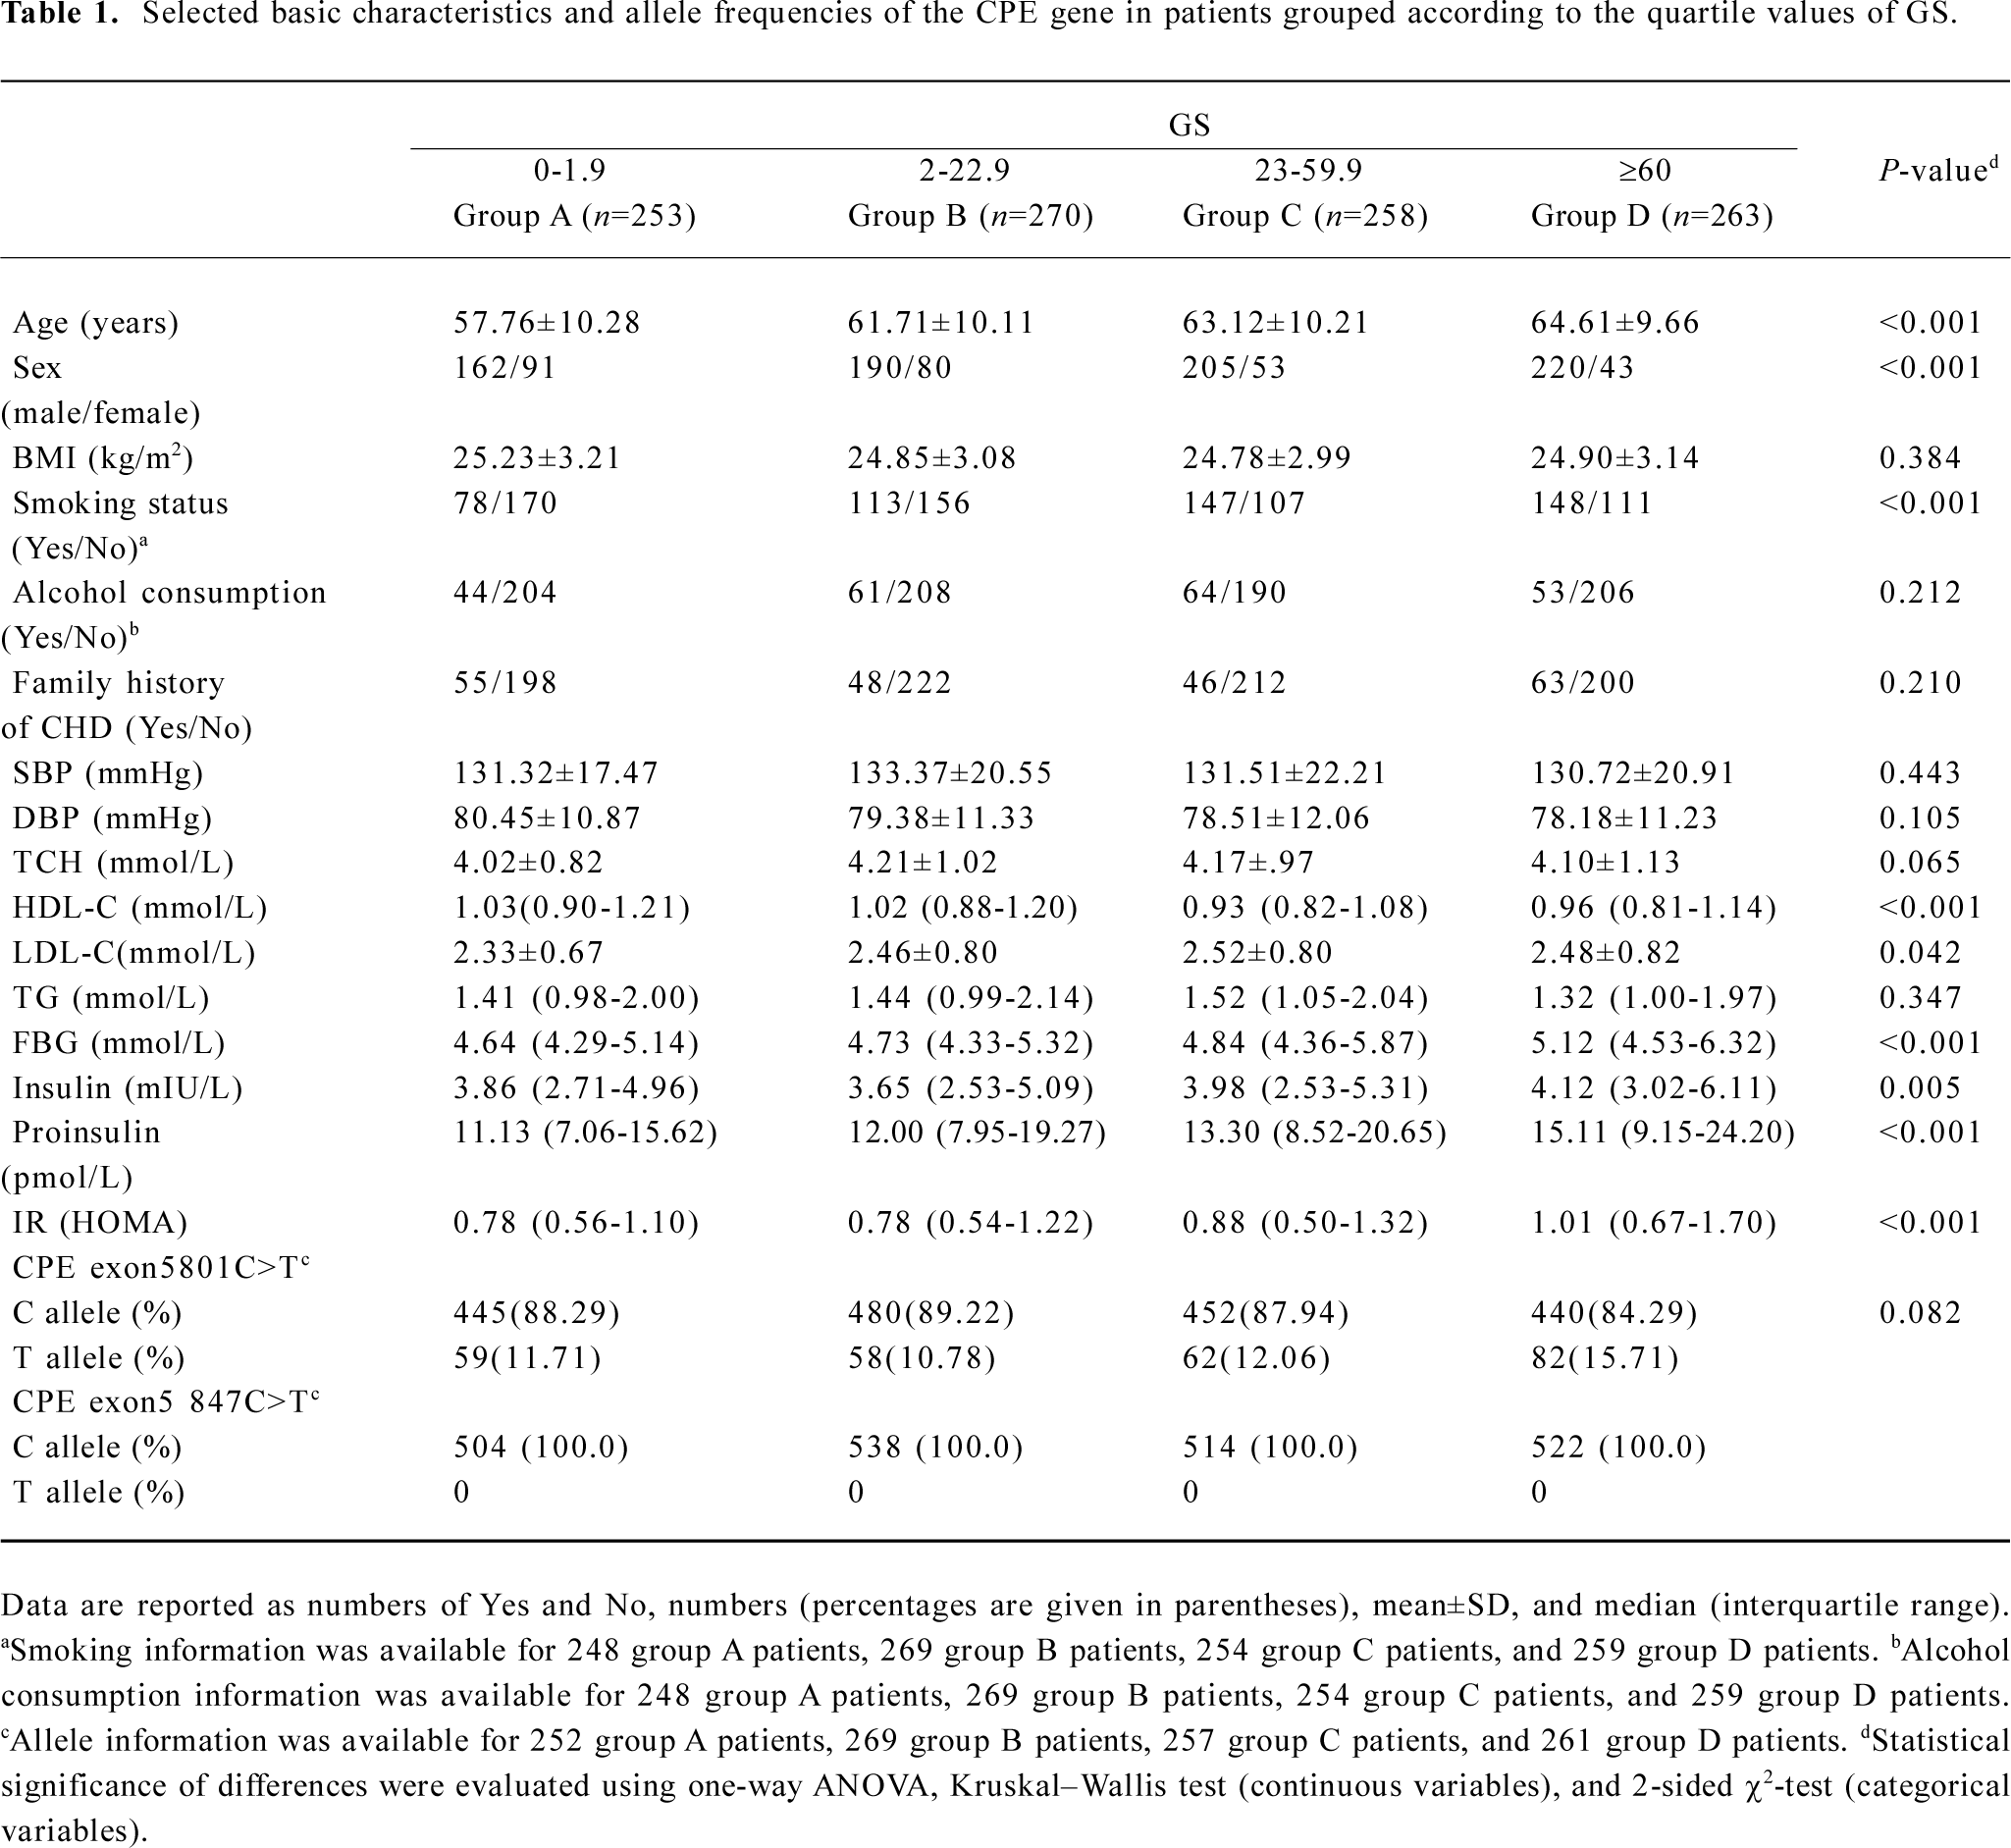
Distribution of selected variables and CPE variant alleles in patients grouped according to GS According to the genotyping results and questionnaire data, we selected 1044 patients who were classified according to the quartile values of GS in this analysis. Patients in quartile I, II, III, and IV (groups A, B, C, and D, respectively) had an increasingly high GS. Allele frequencies of the CPE exon5 801C>T and 847C>T polymorphisms are presented in Table 1, which also shows the basic characteristics of the patients of the 4 groups. There were no significant differences between the 4 groups in BMI, SBP, DBP, TCH, and TG levels, the frequency distribution of alcohol consumption, and family history of CHD. However, the HDL-C, LDL-C, FBG, insulin, proinsulin, and HOMA IR levels showed statistically significant differences among the 4 groups. Compared with the patients with a lower GS, the patients with a higher GS were older (P<0.001) and more likely to be smokers (P<0.001). Also, being male appeared to be a risk factor (P<0.001). Therefore, these variables were further adjusted in the multivariate logistic regression analysis. Moreover, the frequency of the CPE exon5 801T allele was 0.117, 0.108, 0.121, and 0.157, respectively, in the 4 groups, and the differences were not statistically significant (P=0.082). However, the frequency of the 847T allele was 0 for all of the patients (Table 1).
Full table
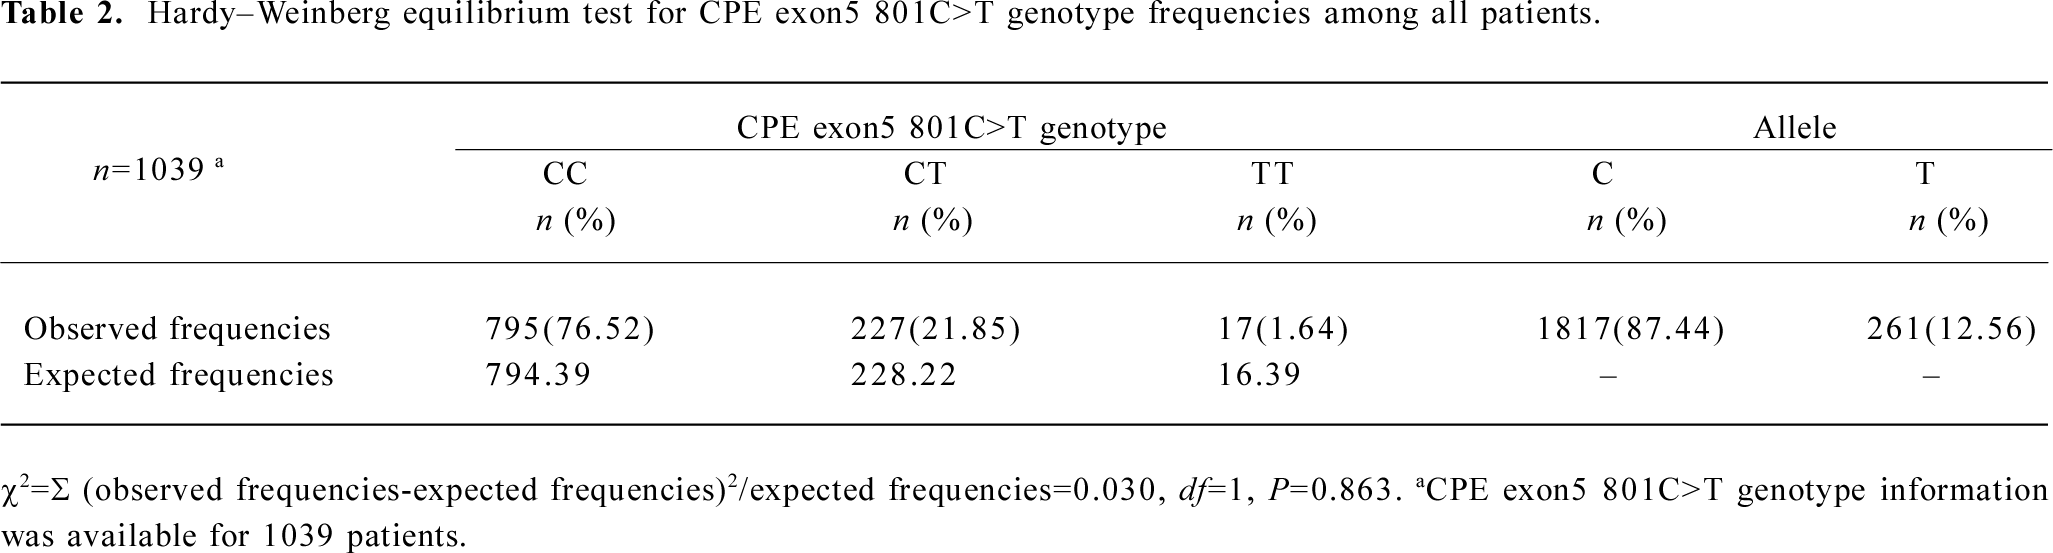
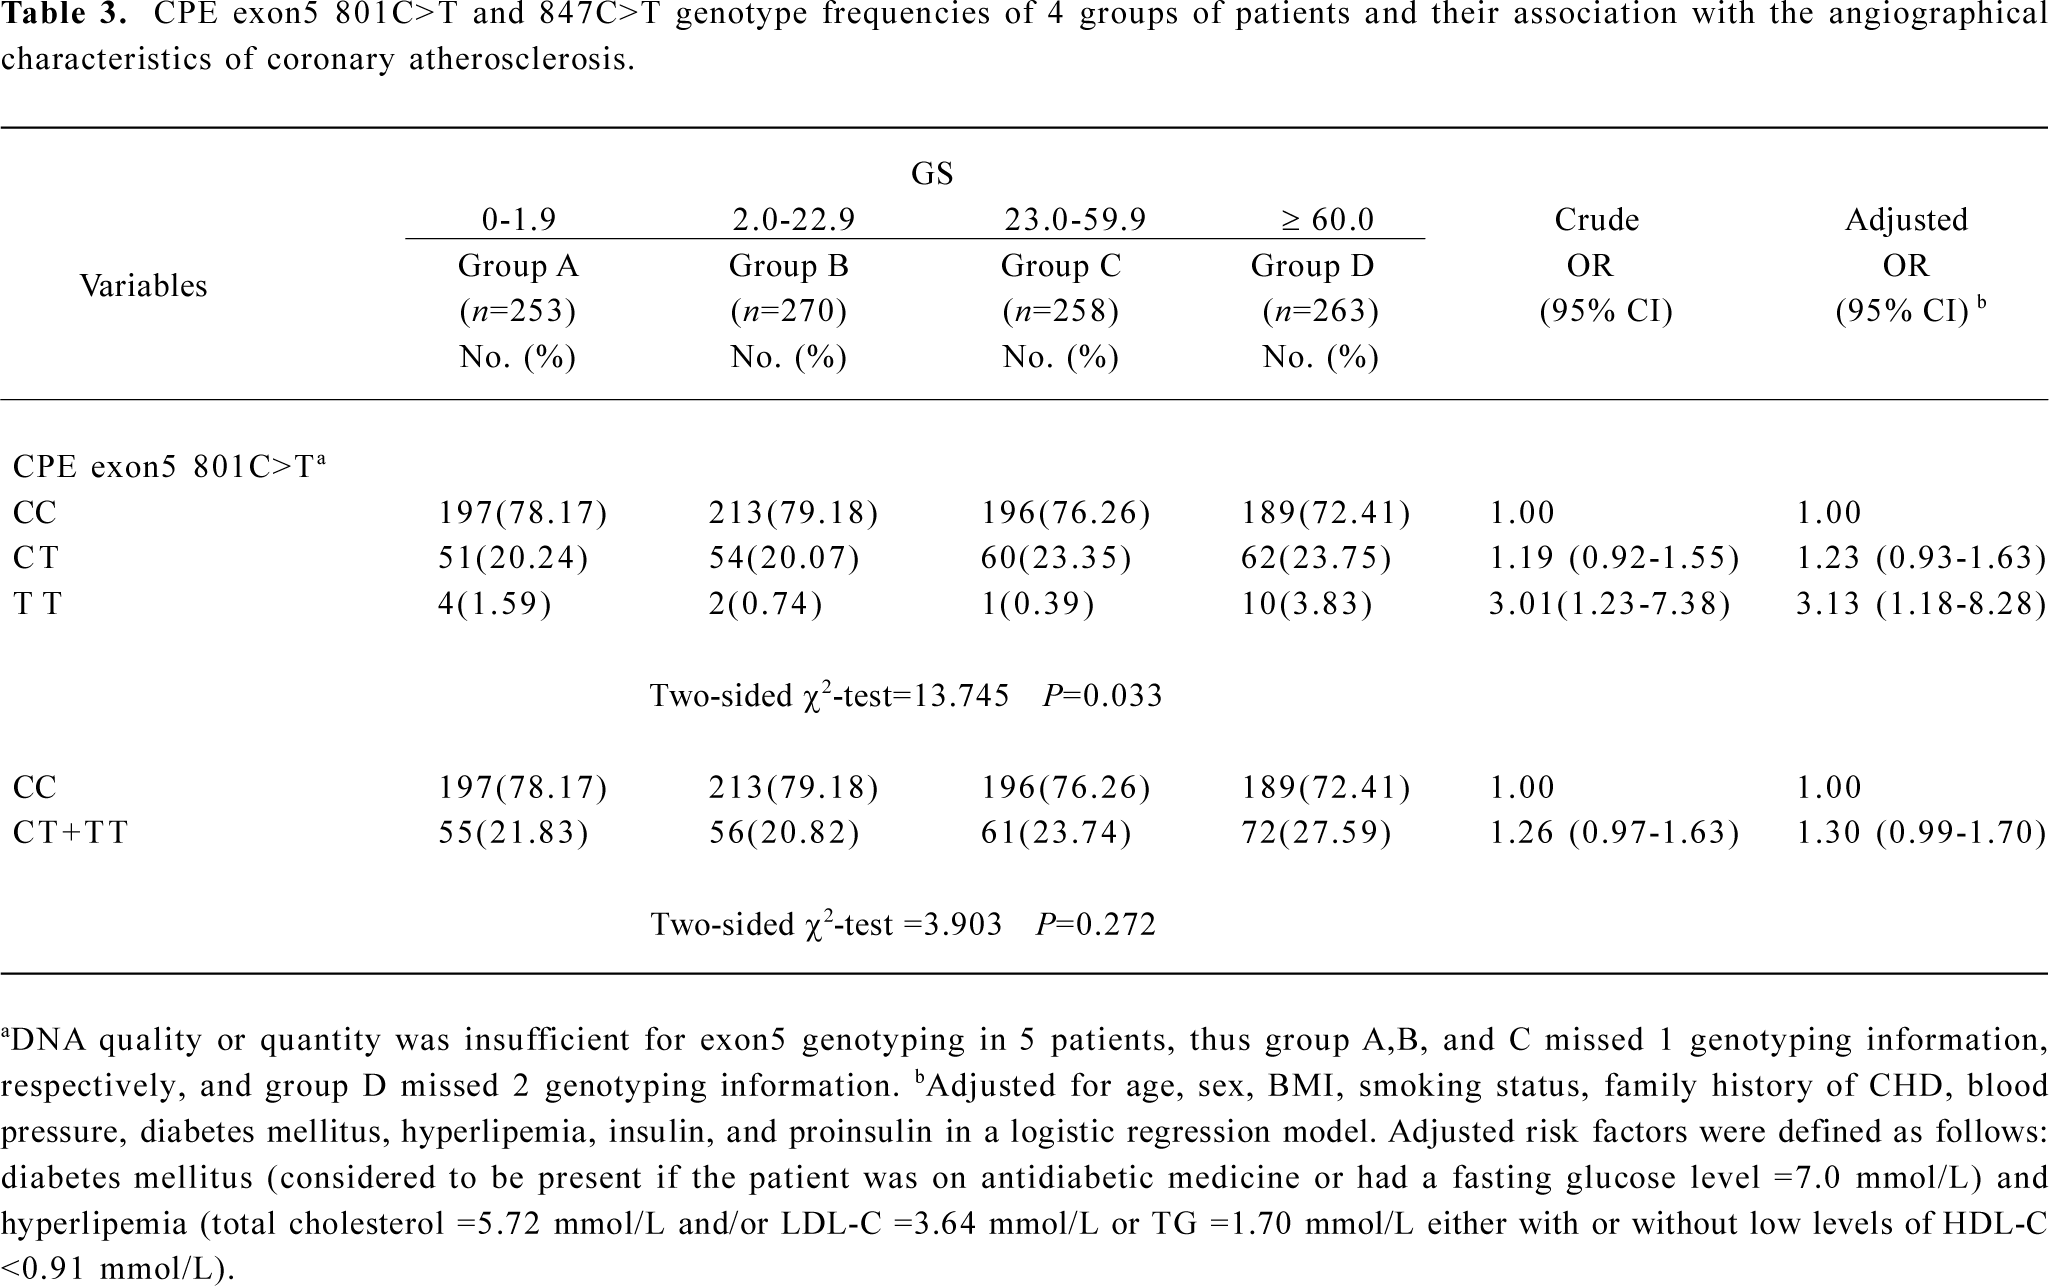
Genotype distribution of the human CPE gene exon5 polymorphisms in grouped patients and their association with angiographical characteristics of coronary atherosclerosis risk The genotype frequency for the CPE exon5 801C>T polymorphisms was in agreement with the Hardy–Weinberg equilibrium for all patients (χ2=0.030, P=0.863; Table 2). The genotype distribution of 801C>T and 847C>T polymorphisms in the patients of the 4 groups are shown in Table 3. The 801C>T genotype frequencies were 78.17% (CC), 20.24% (CT), and 1.59% (TT), respectively, in group A; 79.18% (CC), 20.07% (CT), and 0.74% (TT), respectively, in group B; 76.26% (CC), 23.35% (CT), and 0.39% (TT), respectively, in group C; and 72.41% (CC), 23.75% (CT), and 3.83% (TT), respectively, in group D; and the overall difference was statistically significant between the 4 groups (P=0.033). However, we did not find any mutations at 847C>T locus in this study. The ordinal logistic regression analysis revealed that compared with the 801CC genotype, elevated risks for the angiographical characteristics of coronary atherosclerosis were associated with 801CT (adjusted OR=1.23, 95% CI=0.93–1.63), 801TT (3.13, 1.18–8.28), and their combined genotypes 801CT+TT (1.30, 0.99–1.70; Table 3).
Full table
Full table
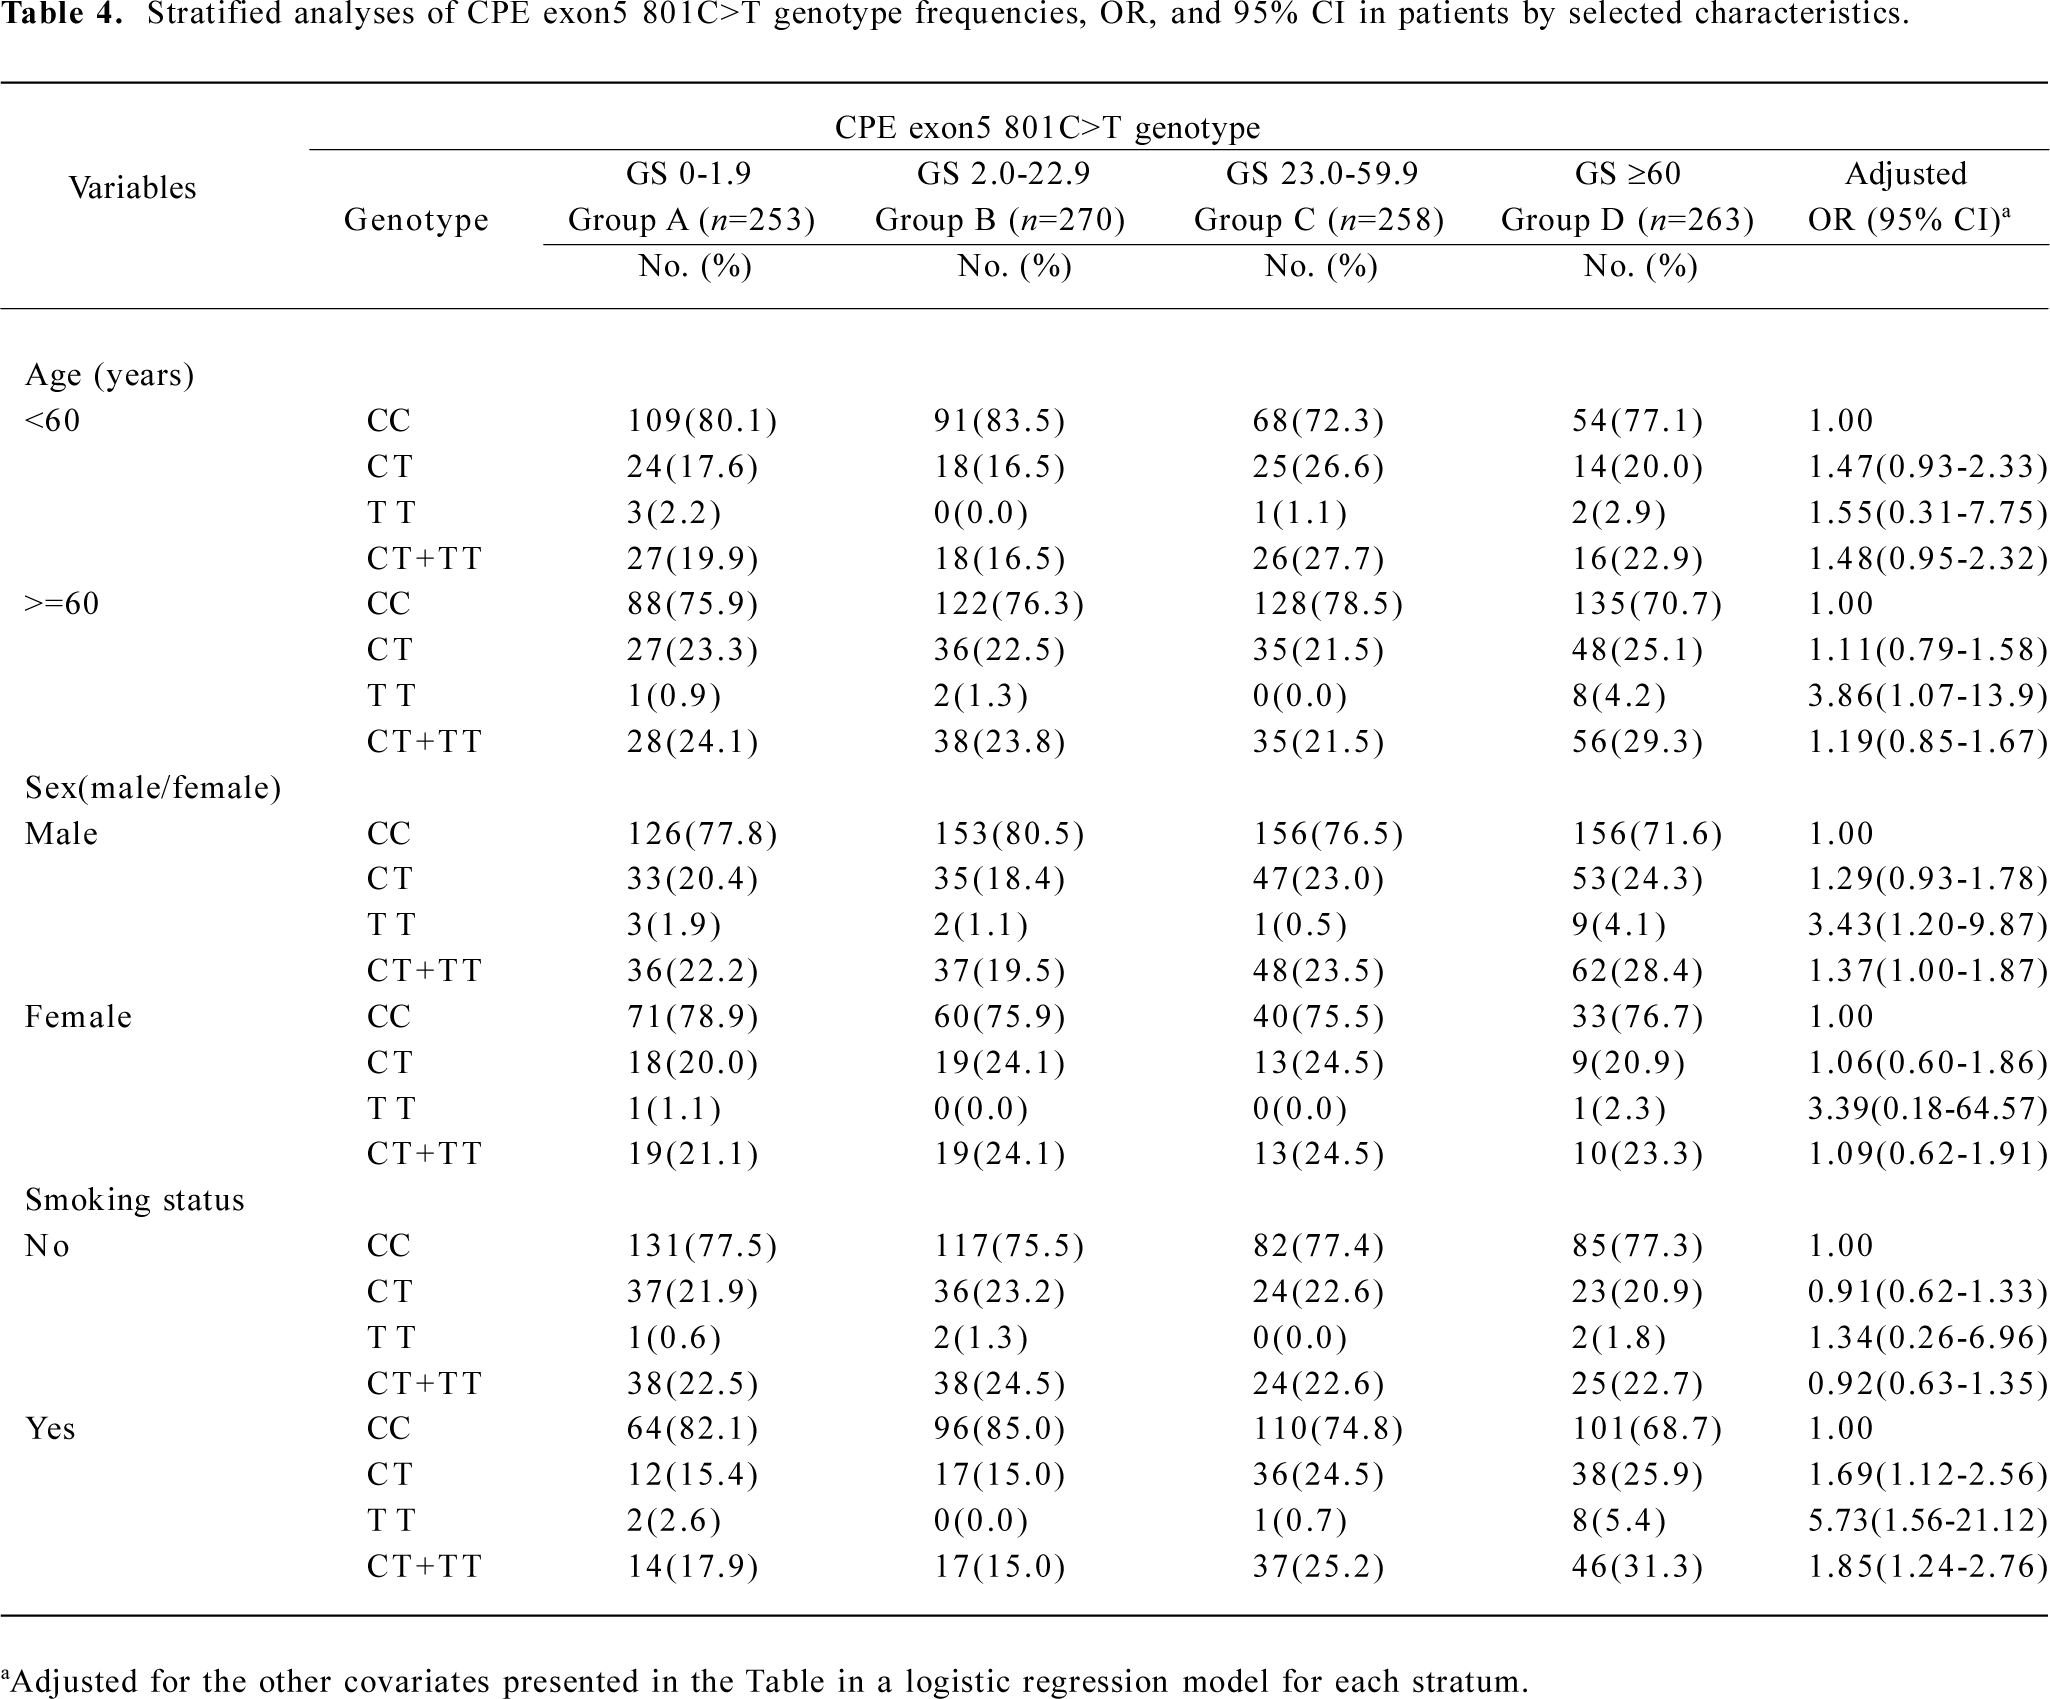
Stratification analysis of the association between the CPE exon5 polymorphism and the angiographical characteristics of coronary atherosclerosis risk We performed a stratification analysis according to age, sex, overweight (BMI >=24 kg/m2), and smoking status. From the stratification analysis, we found that the severity of coronary atherosclerosis associated with the CPE exon5 801C>T polymorphism was more evident among older people (>=60 years, adjusted OR=3.86, 95% CI=1.07–13.90 for 801TT), males (adjusted OR=3.43, 95% CI=1.20–9.87 for 801TT, adjusted OR=1.37, 95% CI=1.00–1.87 for 801CT+TT), and smokers (adjusted OR=1.69, 95% CI=1.12–2.56 for 801CT, adjusted OR=5.73, 95% CI=1.56–21.12 for 801TT, adjusted OR=1.85, 95% CI=1.24–2.76 for 801CT+TT; Table 4). In addition, there was no significant evidence of any associations between the variant genotype and the risk of angiographical characteristics of coronary atherosclerosis among the other subgroups in the stratified analyses (data not shown).
Full table
Effect of genotypes on blood glucose, insulin, proinsulin concentrations, and IR Differences between genotype groups were assessed by an analysis of covariance controlling for age, sex, and BMI. The CPE exon5 801C>T polymorphism was not significantly associated with blood glucose, insulin, HOMA IR or proinsulin levels (data not shown).
Discussion
In this hospital-based study, we found that in a relatively large Chinese population sample, a statistically significant increased risk of angiographical characteristics of coronary atherosclerosis probably associated with the exon5 801C>T polymorphism of the human CPE gene, and this risk effect was more evident in relatively older patients (>=60 years), males, and smokers, and was independent of any other known risk factors. These findings support our prior hypothesis that the SNP in the CPE gene may play a role in the development of coronary atherosclerosis in this population. Moreover, in the population, we did not find any mutations at 847C>T locus.
CHD results to a large extent from the life-long interaction of genetic and environmental factors[23]. Our present study indicated that the level of fasting blood glucose, insulin, proinsulin, and HOMA IR all differed among the 4 groups, as measured by the GS system, which is consistent with the results in a previous report, in which IR was associated with the severity of coronary atherosclerosis, as measured by GS or the number of stenosed vessels, and increased the risk of CHD[15]. As IR with hyperinsulinemia performs important functions in human insulin-mediated glucose metabolism, it is presumed that genetic variations in their levels or structure may influence this metabolism and increase an individual’s risk of developing atherosclerosis. Genetic variations in some of the CPE genes have been shown to affect insulin and proinsulin concentrations in the general population[1,2,5].
As a proinsulin-processing enzyme, CPE is the major carboxypeptidase involved in the biosynthesis of numerous peptide hormones and neurotransmitters, removing C-terminal basic amino acids remained after endoproteolytic processing[24]. Prohormones processed by CPE include proinsulin and pro-opiomelanocortin. An obesity–diabetes syndrome, including hyperproinsulinemia in obese fat/fat mice, is associated with a carboxypeptidase E mutation which reduces enzyme activity[5]. It was reported that the obliteration of CPE, the sorting receptor, leads to multiple endocrine disorders in these genetically-defective mice, including hyperproinsulinemia and infertility, which was derived from the missorting of proinsulin to secretory pathways[25]. To test the hypothesis that the mutations in the CPE gene might be responsible for the development of non insulin-dependent diabetes mellitus (NIDDM) and obesity in humans, the promoter and entire coding region of the CPE gene have been characterized and screened for mutations in a group of Japanese patients with NIDDM and obesity by single-strand conformational polymorphism analysis and nucleotide sequencing that revealed 3 nucleotide changes, a G-to-T substitution at nucleotide –53, a G-to-A substitution at nucleotide –144 in the promoter region, and a silent G-to-A substitution in codon 219. None of the nucleotide substitutions were associated with NIDDM or obesity. Thus genetic variations in the CPE gene do not appear to play a major role in the pathogenesis of NIDDM or obesity in the Japanese population[1]. In another study[2], CPE was scanned for mutations in a collection of Ashkenazi T2DM families, and 5 SNP were identified. An SNP in the 283rd codon, c.847C>T, changes arginine to tryptophan (R283W). The 847T allele frequency was 0.007 in the Ashkenazi population, and patients who inherited 1 copy of this variant had a much earlier age of onset for T2DM. The R283W CPE protein cleaves peptide substrates with substantially lower efficiencies and is less stable at elevated temperatures. In addition, the variant has a narrower pH optimum and is much less active at pH 6–6.5. This indicates that the R283W CPE variant would be substantially less active than wild-type CPE in the trans-Golgi network and immature secretory vesicles where the enzyme functions in vivo. Thus the authors predict that this mutant could cause hyperproinsulinemia and diabetes in the homozygous state. In the middle-aged UK male population, proinsulin, in contrast to specific insulin, was recently shown to be a long-term predictor of CHD[6]. A follow-up study indicated that the increased proinsulin concentrations resulted in death and morbidity caused by CHD over a period of 27 years, independent of other major cardiovascular risk factors[7]. Therefore, in order to test this hypothesis that the mutation in the CPE gene, which leads to marked hyperproinsulinemia, is consistent with a possible role for mutations in CPE in the development of CHD, the present study was conducted to evaluate the association between the angiographical characteristics of coronary atherosclerosis and the CPE polymorphism in the Chinese population. In our study, the GS system was used to define the angiographical characteristics of coronary atherosclerosis. All patients were assigned to 4 groups according to their GS (quartile values were used as cut-off points). However, in the present study, we did not find any mutations in the 283rd codon, c.847C>T of the CPE gene exon5 region in all consecutive patients who underwent coronary angiography for suspected or known coronary atherosclerosis. Chen et al[2] previously estimated the frequency of the CPE gene exon5 847T allele as 0.007 in the Ashkenazi population. This inconsistency may be attributed to different ethnic populations. Owing to the relatively low frequency of this mutation in the population, there is still no reliable estimate of the effect of this mutation on glucose metabolism. This discovery of new and common mutations in the CPE gene may be of help to solve this problem. Interestingly, the less common allele at the 267th codon, c.801C>T of CPE gene exon5 region in the Ashkenazi population (T-allele frequency was 0.033 in 272 patients affected with T2DM and 0.018 in the controls)[2] was present at a high level in the Chinese population (T allele=0.126). The results from the ordinal logistic regression analysis revealed that compared with the SNP801CC genotype, the TT genotype of 801C>T was associated with a significant 213% increased risk (adjusted OR=3.13; 95% CI=1.18–8.28). The silent synonymous mutation in the coding region could potentially affect the enzyme function by changing the gene expression or altering splice sites, although it would not affect the amino acid sequence[2]. These findings suggest that the CPE exon5 801C>T polymorphism may be potential genetic markers of the angiographical characteristics of coronary atherosclerosis risk modified by insulin-mediated glucose metabolism levels of the patients in their environmental exposure as indicated in age, sex, and smoking status. However, due to the small sample size in the subgroups, these findings were considered preliminary and need to be validated in further studies with larger sample sizes in these subpopulations. In addition, the polymorphism genotype had no effect on blood glucose, insulin, HOMA IR, or proinsulin concentrations in all of the patients.
Several limitations in our study need to be addressed. First, like all other hospital-based studies, our study population with coronary atherosclerosis were enrolled from the hospitals, the study patients may not be representative of the general population, and inherent selection bias cannot be completely excluded. However, we applied rigorous epidemiological design by limiting the factors of selecting the patients and used further statistical adjustment to minimize the potential biases. Second, although we observed a significant major effect of the CPE exon5 variant genotypes, the sample size restricted us from identifying gene–environment interactions in the pathogenesis and severity of CHD. Finally, the exact functional consequence of this CPE exon5 variant was not known. Therefore, further studies are needed to determine how the CPE gene exon5 801C>T SNP may influence the expression of CPE or its protein function.
In conclusion, although the exact biological mechanism of this association remains to be explored, our study provides probable evidence that the CPE gene exon5 801C>T polymorphism may contribute to the etiology of the severity of coronary atherosclerosis and plays an important role in the atherosclerotic process in the Chinese population. These findings have offered a novel interpretation for the molecular basis of the role of the CPE gene on the development of coronary atherosclerosis. Large, well-designed prospective studies with ethnically-diverse populations are warranted to further elucidate the impact of more CPE gene SNP on coronary atherosclerosis susceptibility. More functional data for this specific association are needed to illustrate this biological mechanism.
Author contribution
En-zhi JIA designed research; Jie WANG, Yun ZHANG, Zhi-jian YANG, Tie-bing ZHU, Lian-sehng WANG, Bo CHEN, Ke-jiang CAO, Jun HUANG, Wen-zhu MA, En-zhi JIA performed research; Jie WANG, En-zhi JIA analyzed data; Jie WANG wrote the paper.
Acknowledgements
Special thanks to Dr Lennart ANDERSEN, Dr Jens Christian WORTMANN, and Dr Thomas Peter DYRBERG from Novo Nordisk, Bagsvaerd, Denmark, for providing the free monoclonal antibodies, including OXI-005, HUI-018, PEP-001, and HUI-001.
References
- Utsunomiya N, Ohagi S, Sanke T, Tatsuta H, Hanabusa T, Nanjo K. Organization of the human carboxypeptidase E gene and molecular scanning for mutations in Japanese subjects with NIDDM or obesity. Diabetologia 1998;41:701-5.
- Chen H, Jawahar S, Qian Y, Duong Q, Chan G, Parker A, et al. Missense polymorphism in the human carboxypeptidase E gene alters enzymatic activity. Hum Mutat 2001;18:120-31.
- Davies MJ, Rayman G, Gray IP, Day JL, Hales CN. Insulin deficiency and increased plasma concentration of intact and 32/33 split proinsulin in subjects with impaired glucose tolerance. Diabet Med 1993;10:313-20.
- Ward WK, LaCava EC, Paquette TL, Beard JC, Wallum BJ, Porte D Jr. Disproportionate elevation of immunoreactive proinsulin in type 2 (non-insulin-dependent) diabetes mellitus and in experimental insulin resistance. Diabetologia 1987;30:698-702.
- Naggert JK, Fricker LD, Varlamov O, Nishina PM, Rouille Y, Steiner DF, et al. Hyperproinsulinaemia in obese fat/fat mice associated with a carboxypeptidase E mutation which reduces enzyme activity. Nat Genet 1995;10:135-42.
- Yudkin JS, May M, Elwood P, Yarnell JW, Greenwood R, Davey Smith G. Concentrations of proinsulin like molecules predict coronary heart disease risk independently of insulin: prospective data from the Caerphilly Study. Diabetologia 2002;45:327-36.
- Zethelius B, Byberg L, Hales CN, Lithell H, Berne C. Proinsulin is an independent predictor of coronary heart disease: Report from a 27-year follow-up study. Circulation 2002;105:2153-8.
- Zethelius B, Lithell H, Hales CN, Berne C. Insulin sensitivity, proinsulin and insulin as predictors of coronary heart disease. A population-based 10-year, follow-up study in 70-year old men using the euglycaemic insulin clamp. Diabetologia 2005;48:862-7.
- Lindahl B, Dinesen B, Eliasson M, Roder M, Jansson JH, Huhtasaari F, et al. High proinsulin concentration precedes acute myocardial infarction in a nondiabetic population. Metabolism 1999;48:1197-202.
- Lindahl B, Dinesen B, Eliasson M, Roder M, Hallmans G, Stegmayr B. High proinsulin levels precede first-ever stroke in a nondiabetic population. Stroke 2000;31:2936-41.
- Welborn TA, Wearne K. Coronary heart disease and cardiovascular mortality in Busselton with reference to glucose and insulin concentrations. Diabetes Care 1979;2:154-60.
- Ducimetière D, Eschwege E, Papoz L, Richard JL, Claude JR, Rosselin G. Relationship of plasma insulin levels to the incidence of myocardial infarction and coronary heart disease mortality in a middle-aged population. Diabetologia 1980;19:205-10.
- Pyörälä K, Savolainen S, Kaukola S, Haapakoski J. Plasma insulin as coronary heart disease risk factor: relationship to other risk factors and predictive value during 9 1/2-year follow-up of the Helsinki policemen study population. Acta Med Scand Suppl 1985;701:38-52.
- Båvenholm P, Proudler A, Tornvall P, Godsland I, Landou C, de Faire U, et al. Insulin, intact and split proinsulin, and coronary artery disease in young men. Circulation 1995;92:1422-9.
- Takezako T, Saku K, Zhang B, Shirai K, Arakawa K. Insulin resistance and angiographical characteristics of coronary atherosclerosis. Jpn Circ J 1999;63:666-73.
- Judkins MP. A percutaneous transfemoral technique. Radiology 1967;89:815-21.
- Gensini GG. Coronary arteriography. New York: Mount Kisco Futura Publishing Co; 1975. p 271–4.
- Gensini GG. Coronary arteriography. In: Braunwald E, editor. Heart disease. Philadelphia: WB Saunders; 1980. p 352–3.
- Gensini GG. A more meaningful scoring system for determining the severity of coronary heart disease. Am J Cardiol 1983;51:606.
- Andersen L, Dinesen B, Jørgensen PN, Poulsen F, Roder ME. Enzyme immunoassay for intact human insulin in serum or plasma. Clin Chem 1993;39:578-82.
- Kjems LL, Roder ME, Dinesen B, Hartling SG, Jorgensen PN, Binder C. Highly sensitive enzyme immunoassay of proinsulin immunoreactivity with use of two monoclonal antibodies. Clin Chem 1993;39:2146-50.
- Matthews DR, Hosker JP, Rudenski AS, Naylor BA, Treacher DF, Turner RC. Homeostasis model assessment: insulin resistance and beta-cell function from fasting plasma glucose and insulin concentrations in man. Diabetologia 1985;28:412-9.
- Williams RR. Understanding genetic and environmental risk factors in susceptible persons. West J Med 1984;141:799-806.
- Fricker LD. Peptide processing exopeptidases: amino and cardoxypeptidases involved with peptide biosynthesis. In: Fricker LD, editor, Peptide biosynthesis and processing. Boca Raton: CRC Press; 1991. p 199–228.
- Cool DR, Normant E, Shen F, Chen HC, Pannell L, Zhang Y, et al. Carboxypeptidase E is a regulated secretory pathway sorting receptor: genetic obliteration leads to endocrine disorders in Cpe (fat) mice. Cell 1997;88:73-83.