
Biological characters of [18F]O-FEt–PIB in a rat model of Alzheimer’s disease using micro-PET imaging1
Introduction
During the rapid development of in vivo amyloid imaging agents for the early diagnosis of Alzheimer’s disease (AD)[1], some efforts were made to use high-resolution micro-positron emission tomography (PET) imaging in the transgenic mouse model of central nervous system amyloid deposition to further study Pittsburgh compound-B ([11C]PIB), a PET tracer that has been shown to be increased in amyloid-aggregate areas of the AD brain. However, some types of transgenic mice, including PS1/APP and Tg2576, showed no significant retention of PIB in these models, even at 12 or 22 months of age when amyloid deposition exceeded that distinctly seen in AD[2,3]. Klunk et al studied the reason and found that PS1/APP mouse brain tissues contained less than 1 high-affinity PIB binding site per 1000 molecules of β-amyloid, whereas the AD brain contained >500 PIB binding sites per 1000 molecules of β-amyloid. The tiny amount (nmol/L) of the PET tracer, the small amount of high-binding sites, and the low detection efficiency (2%) of the micro-PET might be the main reasons for the absence of tracer retention in the transgenic mice. Cai et al reported their initial efforts to evaluate [11C]PIB for imaging brains of Tg2576 mice. They also did not find any specific binding in the cerebrum, only non-specific binding comparable to that in the cerebellum. Interestingly, when they used much older transgenic Tg2576 mice (28 months’ old), they observed a ratio of radioactivity in the cerebrum to that in the cerebellum of approximately 1.8 at 25 min after an injection of [11C]PIB[4]. Their case was successful in exhibiting micro-PET imaging of β-amyloid deposits in rodent brains.
Shimadzu et al found a hot spot at 180 min after the intravenous administration of [18F]BF-168 (see the structure in ref 5) on the same site of the rat brain where β-amyloid (1–42) and a buffer only on the opposite site had been injected 6 d before with an autoradiographic image[5]. Previous studies showed the compound O-FEt-PIB had a high affinity to β-amyloid and high lipophilicity[6–8]. In the present study, we first observed the increased uptake of [18F]O-FEt-PIB in the right hemicerebrum of an injected AD rat where β-amyloid (1–40) and a saline only on the opposite site were injected using micro-PET imaging.
Materials and methods
General equipment and reagents HPLC was carried out on a Dionex system equipped with a P680 pump, a PDA-100 photodiode array detector (Dionex Corporation, Sunnyvale, CA, USA), and a NaI (Tl) scintillation detector (Bioscan, Washington, DC, USA). The columns used for the identification and purification were LiChrosorb C18 (5 μm, 300 mm×3.9 mm and 10 μm, 300 mm×7.8 mm (Waters, Milford, MA, USA), respectively;. The column effluent passed through an UV (365 nm) detector and scintillation radioactivity detector in series. The HPLC solvents consisted of CH3OH (solvent A) and 0.1% CF3COOH/H2O (solvent B). HPLC gradient was set as follows: 0–1 min 70% B, 1–25 min 20%, 25–40 min 20%. The flow rates of purification and analysis were 3 mL/min (condition 1, with column 300 mm×7.8mm) and 1 mL/min (condition 2, with column 300 mm×3.9 mm), respectively.
Radio-TLC (Thin Layer Chromatography, Merck, Darmstadt, Germany) analyses were performed using silica gel 60 GF-254 plates (Merck, Darmstadt, Germany) on a Bioscan system AR-2000 (Bioscan, Washington, DC, USA) with Winscan software version 3.09 (Bioscan, Washington, DC, USA). The radioactivity measurements were done using an automatic gamma counter (3 inch NaI[Tl] well crystal; Jiading, Shanghai, China) coupled to a multichannel analyzer (SN682B; Jiading, Shanghai, China) [9].
Synthetic human β-amyloid protein (1–40) was purchased from Sigma-Aldrich Synthesis (Steinheim, Germany). Other commercial reagents were purchased from Shanghai Reagent (Shanghai, China), and used without further purification unless otherwise specified.
Synthesis of [18F]O-FEt-PIB The cold reference compound O-FEt-PIB was synthesized as described in our previous work[6]. The radiosynthesis procedure of [18F]O-FEt-PIB and its primary characters were described in Zheng et al[10]. [18F]Fluoride, produced by a cyclotron using 18O(p, n)18F reaction, was passed through a Sep-Pak light QMA cartridge (C18, Waters, Milford, MA, USA) as an aqueous solution and then dried azeotropically with CH3CN (3×400 µL) at 110 °C under a stream of nitrogen. Ethylene glycol bistosylate (6 mg) in anhydrous CH3CN (400 µL) was added to the reaction vial and heated at 110 °C for 10 min to generate 2-18F-fluoroethyl tosylate ([18F]FEtOTs). The products were purified through a pre-saturated C18 Sep-Pak cartridge. In total, 3 mg PIB (dissolved in 200 µL DMSO, with 20 µL of 1 mol/L K2CO3 solution, and 400 µL anhydrous CH3CN) was added to the purified [18F]FEtOTs in a vessel and heated for 20 min at 110 °C. The reaction products were then purified using a semi-preparative HPLC column (condition 1). The elution was collected from 13 to 15 min and dried at 60 °C under a nitrogen stream. Phosphate-buffered saline (pH 7.20) was added to dilute the product to a 37 MBq/mL solution. The analytical HPLC condition (condition 2) and radio-TLC were used for quality control (Chemical Purity and Radio Chemical Purity) >95%, Retention time (tR) =18.2 min [reference tR=17.4 min]; Rf=0.66 in CHCl3 [reference Rf=0.62]). Specific activity estimated by comparing the UV peak intensity of purified [18F]O-FEt–PIB with a known concentrations was more than 740 GBq/µmol.
Animal preparation The model and control rats were prepared as described in Wang et al and Nitta et al[11,12]. Male Sprague–Dawley rats, weighing 200–220 g at the beginning of the experiment, were housed individually in a room maintained at 23 °C with a 12 h light-dark cycle for the duration of the experiment. In total, 6 μg aggregated β-amyloid (1–40) with 6 μL dissolved in sterile, distilled water (prepared by incubating soluble β-amyloid [1–40] at 37 °C for at least 7 d) was stereotaxically injected into the hippocampus (–3.0 mm AP, –2.2 mm ML, and –3 mm DV) in rats under barbital anesthesia using a microsyringe. One week was allowed for recovery from the surgery. The control rats were infused with the same quantity of sterile, distilled water. One month after the surgery, 3 randomly-selected model rats were killed by decapitation after heart perfusion. The brains were rapidly removed and placed on ice. The brain tissues were fixed for immunohistochemical evaluation. Other normal and postoperative rats were used for micro-PET imaging or other in vivo/in vitro conventional experiments. All of the experiments complied with the current laws of China and met ethical approval.
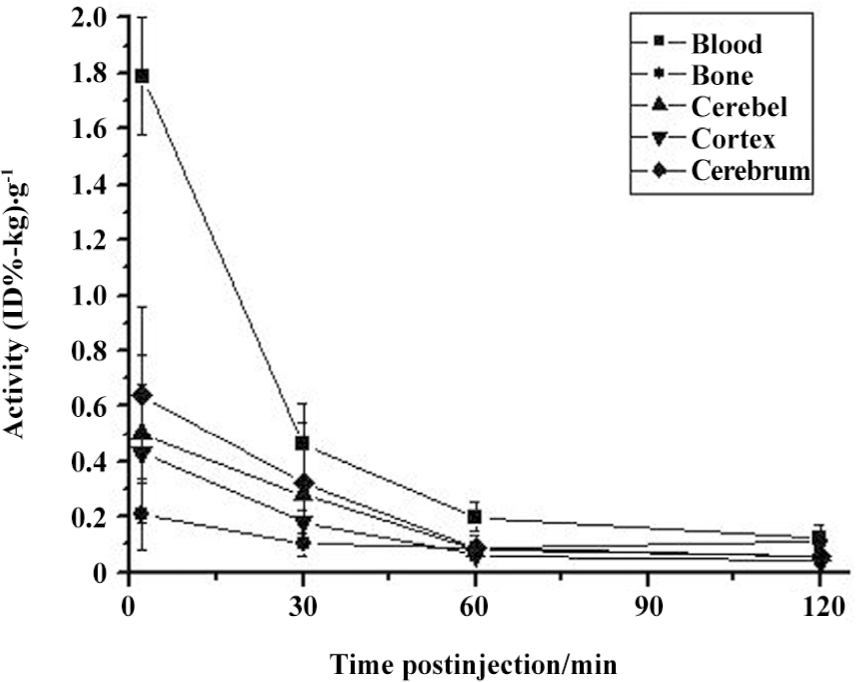
Brain biodistribution of [18F]O-FEt–PIB in normal rats Studies were performed in 5 male Sprague-Dawley rats, weighing 400-500 g (~3 months old). Under anesthesia, each animal was weighed and received approximately 7.4 MBq (200 µCi) of [18F]O-FEt–PIB in 100 μL saline through the lateral tail vein. The animals were killed by cardiac excision following cardiac puncture to obtain arterial blood samples and decapitation to obtain brains and crania at 2, 30, 60, and 120 min postinjection. The brains were rapidly excised and divided into cerebellum, cortex, and cerebrum. All of the samples were weighed and counted, and the counts were corrected for decay. The radioactivity of tissues was determined as the percentage of injected dose per gram of tissue normalized to body weight (in kg) or (%ID-kg)/g.
High-resolution micro-PET scanning PET imaging was performed using a micro-PET R4 rodent model scanner (CTI Concorde Microsystems, Knoxville, TN, USA), which was equipped with micro-PET manager for data acquisition in list mode and ASIPro for preparing sinograms and image reconstruction[13]. The scanner had a computer-controlled bed and 10.8 cm transaxial and 7.8 cm axial field of view (FOV) with an image resolution of <1.8 mm. [18F]FDG (0.5 mCi each rat) was prepared with a specific activity of 500 Ci/mmol, which was provided by the Department of Nuclear Medicine, Zhejiang University School of Medicine (Hangzhou, China).
A total of 4 AD and 3 control male Sprague-Dawley rats were imaged by micro-PET using [18F]O-FEt-PIB. To determine the appropriate times for data acquisition, 37 MBq (1 mCi; the amount was 2 times than that in [18F]FDG imaging) of [18F]O-FEt–PIB was injected via the tail vein while the rat was placed at the center of the FOV (field of view) of the scanner and scanned just after the injection. The dynamic PET data were acquired on an AD rat for 40 min (10 s×6 frames, 30 s×6 frames, 60 s×5 frames, 300 s×4 frames, and 600 s×1 frame). The other animals were anesthetized first, receiving an injection of PET tracers, and were then placed at the center of the FOV of the micro-PET R4 scanner and underwent a 15 min static scan. Three AD rats were scanned for 15 min at 5 min postinjection. The control rats (n=3) were scanned based on the same methods as the model rats.
Images were reconstructed by a maximum posteriori probability algorithm. Corrections for dead time, random scattering, and attenuation were performed for all scans.
PET data analysis Regions of interest (ROI) were manually placed over the cerebellum, hemicerebrum, and cortex. A 3-D digital map of the rat was used for the identification of the anatomical structures[14] and the [18F]FDG images of the normal rat brains. Both summed images of the dynamic scan and 3-D images (or single slice) of the static scan were analyzed. Adjacent slices containing hippocampi were picked out from both the model and control rats. The activity difference value (ADV) between 2 hemicerebrums was calculated as follows: ADV=(|AL–AR|/([AL+AR]/2)×100%. AL represented the radioactivity in the left hemicerebrum, and AR represented the radioactivity in the right hemicerebrum. This value could evaluate the extent of radioactivity in the 2 parts of the brain.
Results
Brain distribution of [18F]O-FEt–PIB in normal rats Figure 1 shows the brain distribution of [18F]O-FEt-PIB in normal Sprague-Dawley rats in terms of (%ID-kg)/g. The brain entry of this tracer was rapid, and peaked at approximately 2 min with the average (%ID-kg)/g value at approximately 0.5. This was a good character for further developing it as a potential neuroreceptor radioligands. The low uptake and radioactivity in the bone indicated that little 18F– ion was generated in the metabolism. This result was confirmed by the dynamic scan with micro-PET. Even at 40 min, there was no distinct increased radioactivity in the crania. However, the clearance rate of radioactivity from the brain tissues was slow. The 2–60 min brain radioactivity ratio was approximately 6, and this characteristic was not as good as that of PIB (2–30 min ratio, 12[15]).
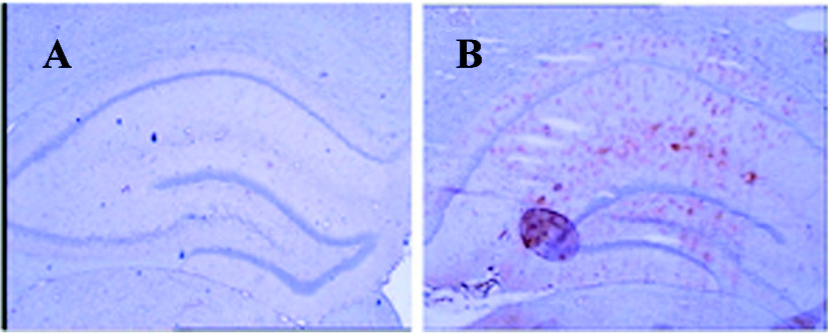
Considering the disadvantage of AD transgenic mouse models in micro-PET imaging, we prepared a commonly-used AD rat model, in which the amyloid protein (1–40) was administered to the rats in vivo to evaluate the AD PET tracer using micro-PET. This model has successfully evaluated the effects of a Chinese traditional drug, huperzine A[11]. To understand the position and pervasion of the injected amyloid-β (1–40), we performed an immunohistochemical evaluation. The results are shown in Figure 2. Figure 2 shows the amyloid deposits in the right hippocampus. The deposits were diffused in the area of hippocampus, and a spot on it was caused by an air bubble (Figure 2B); there were no detected amyloid deposits in the left hippocampus (Figure 2A).
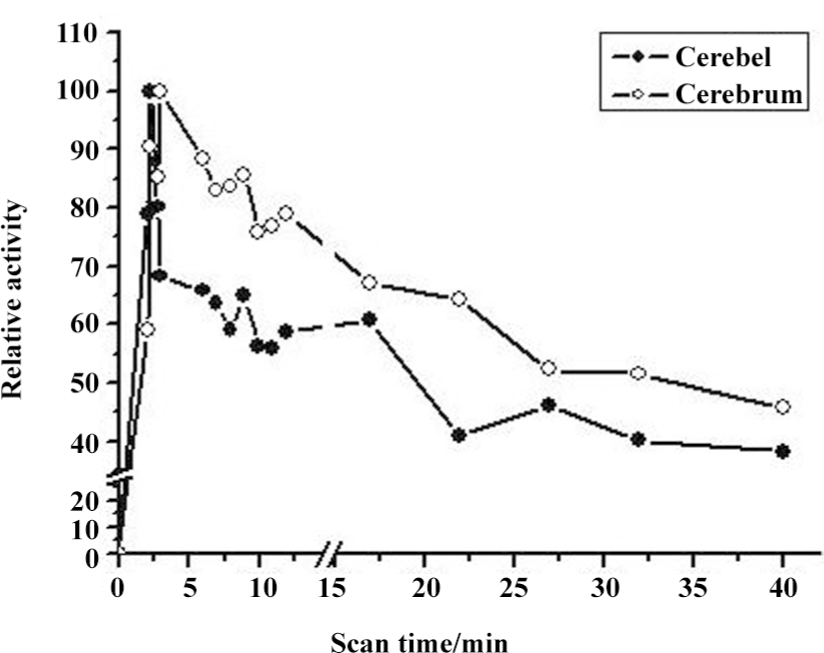
Micro-PET results Figure 3 shows the time-activity curves (TAC) of the regional distribution of radioactivity in the rat brain after the injection of the tracer. The maximum radioactivity obtained from the data was defined as 100, and other values were calculated as a ratio of the maximum radioactivity. This result correlated with the conventional method (Figure 1) and showed a quick brain uptake and slow washout.
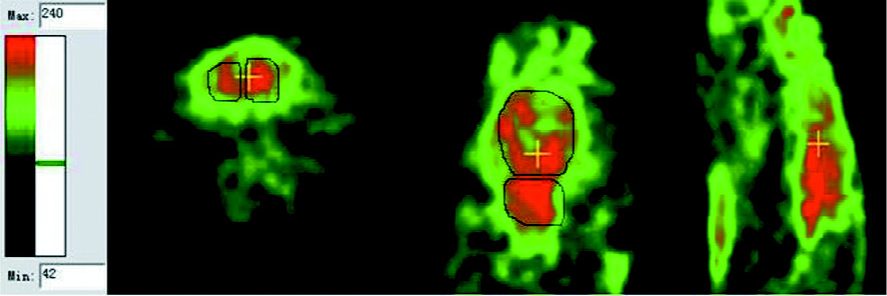
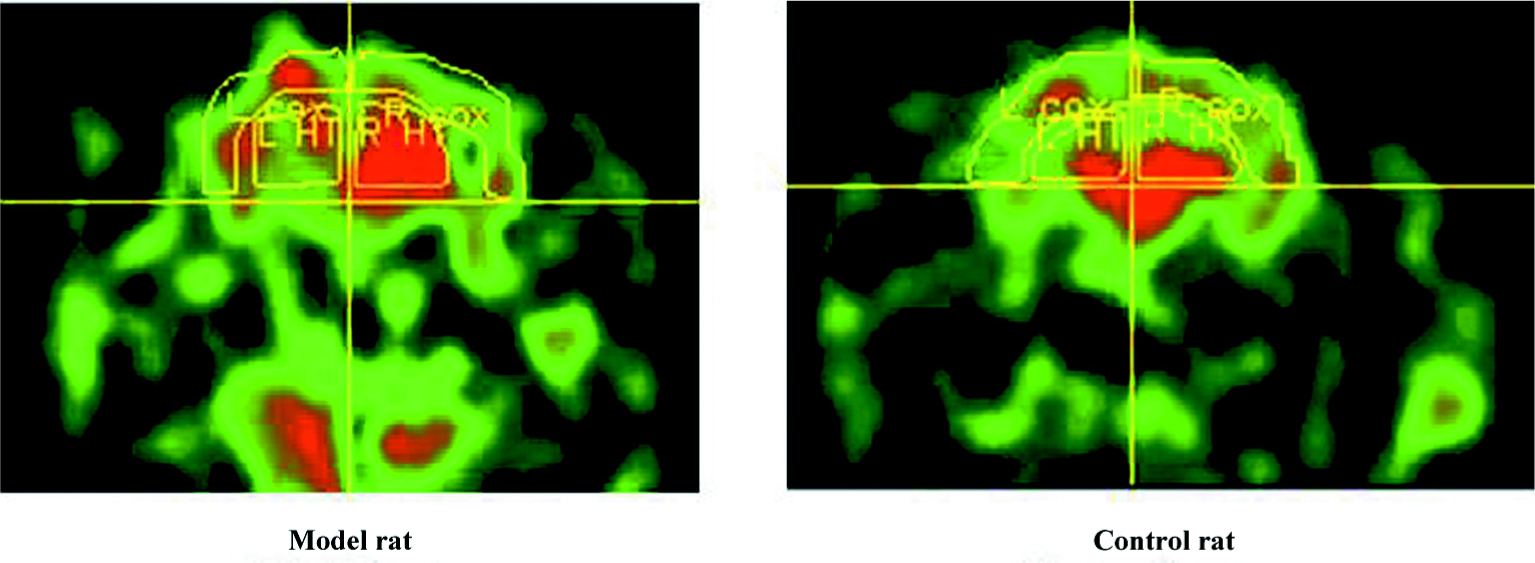
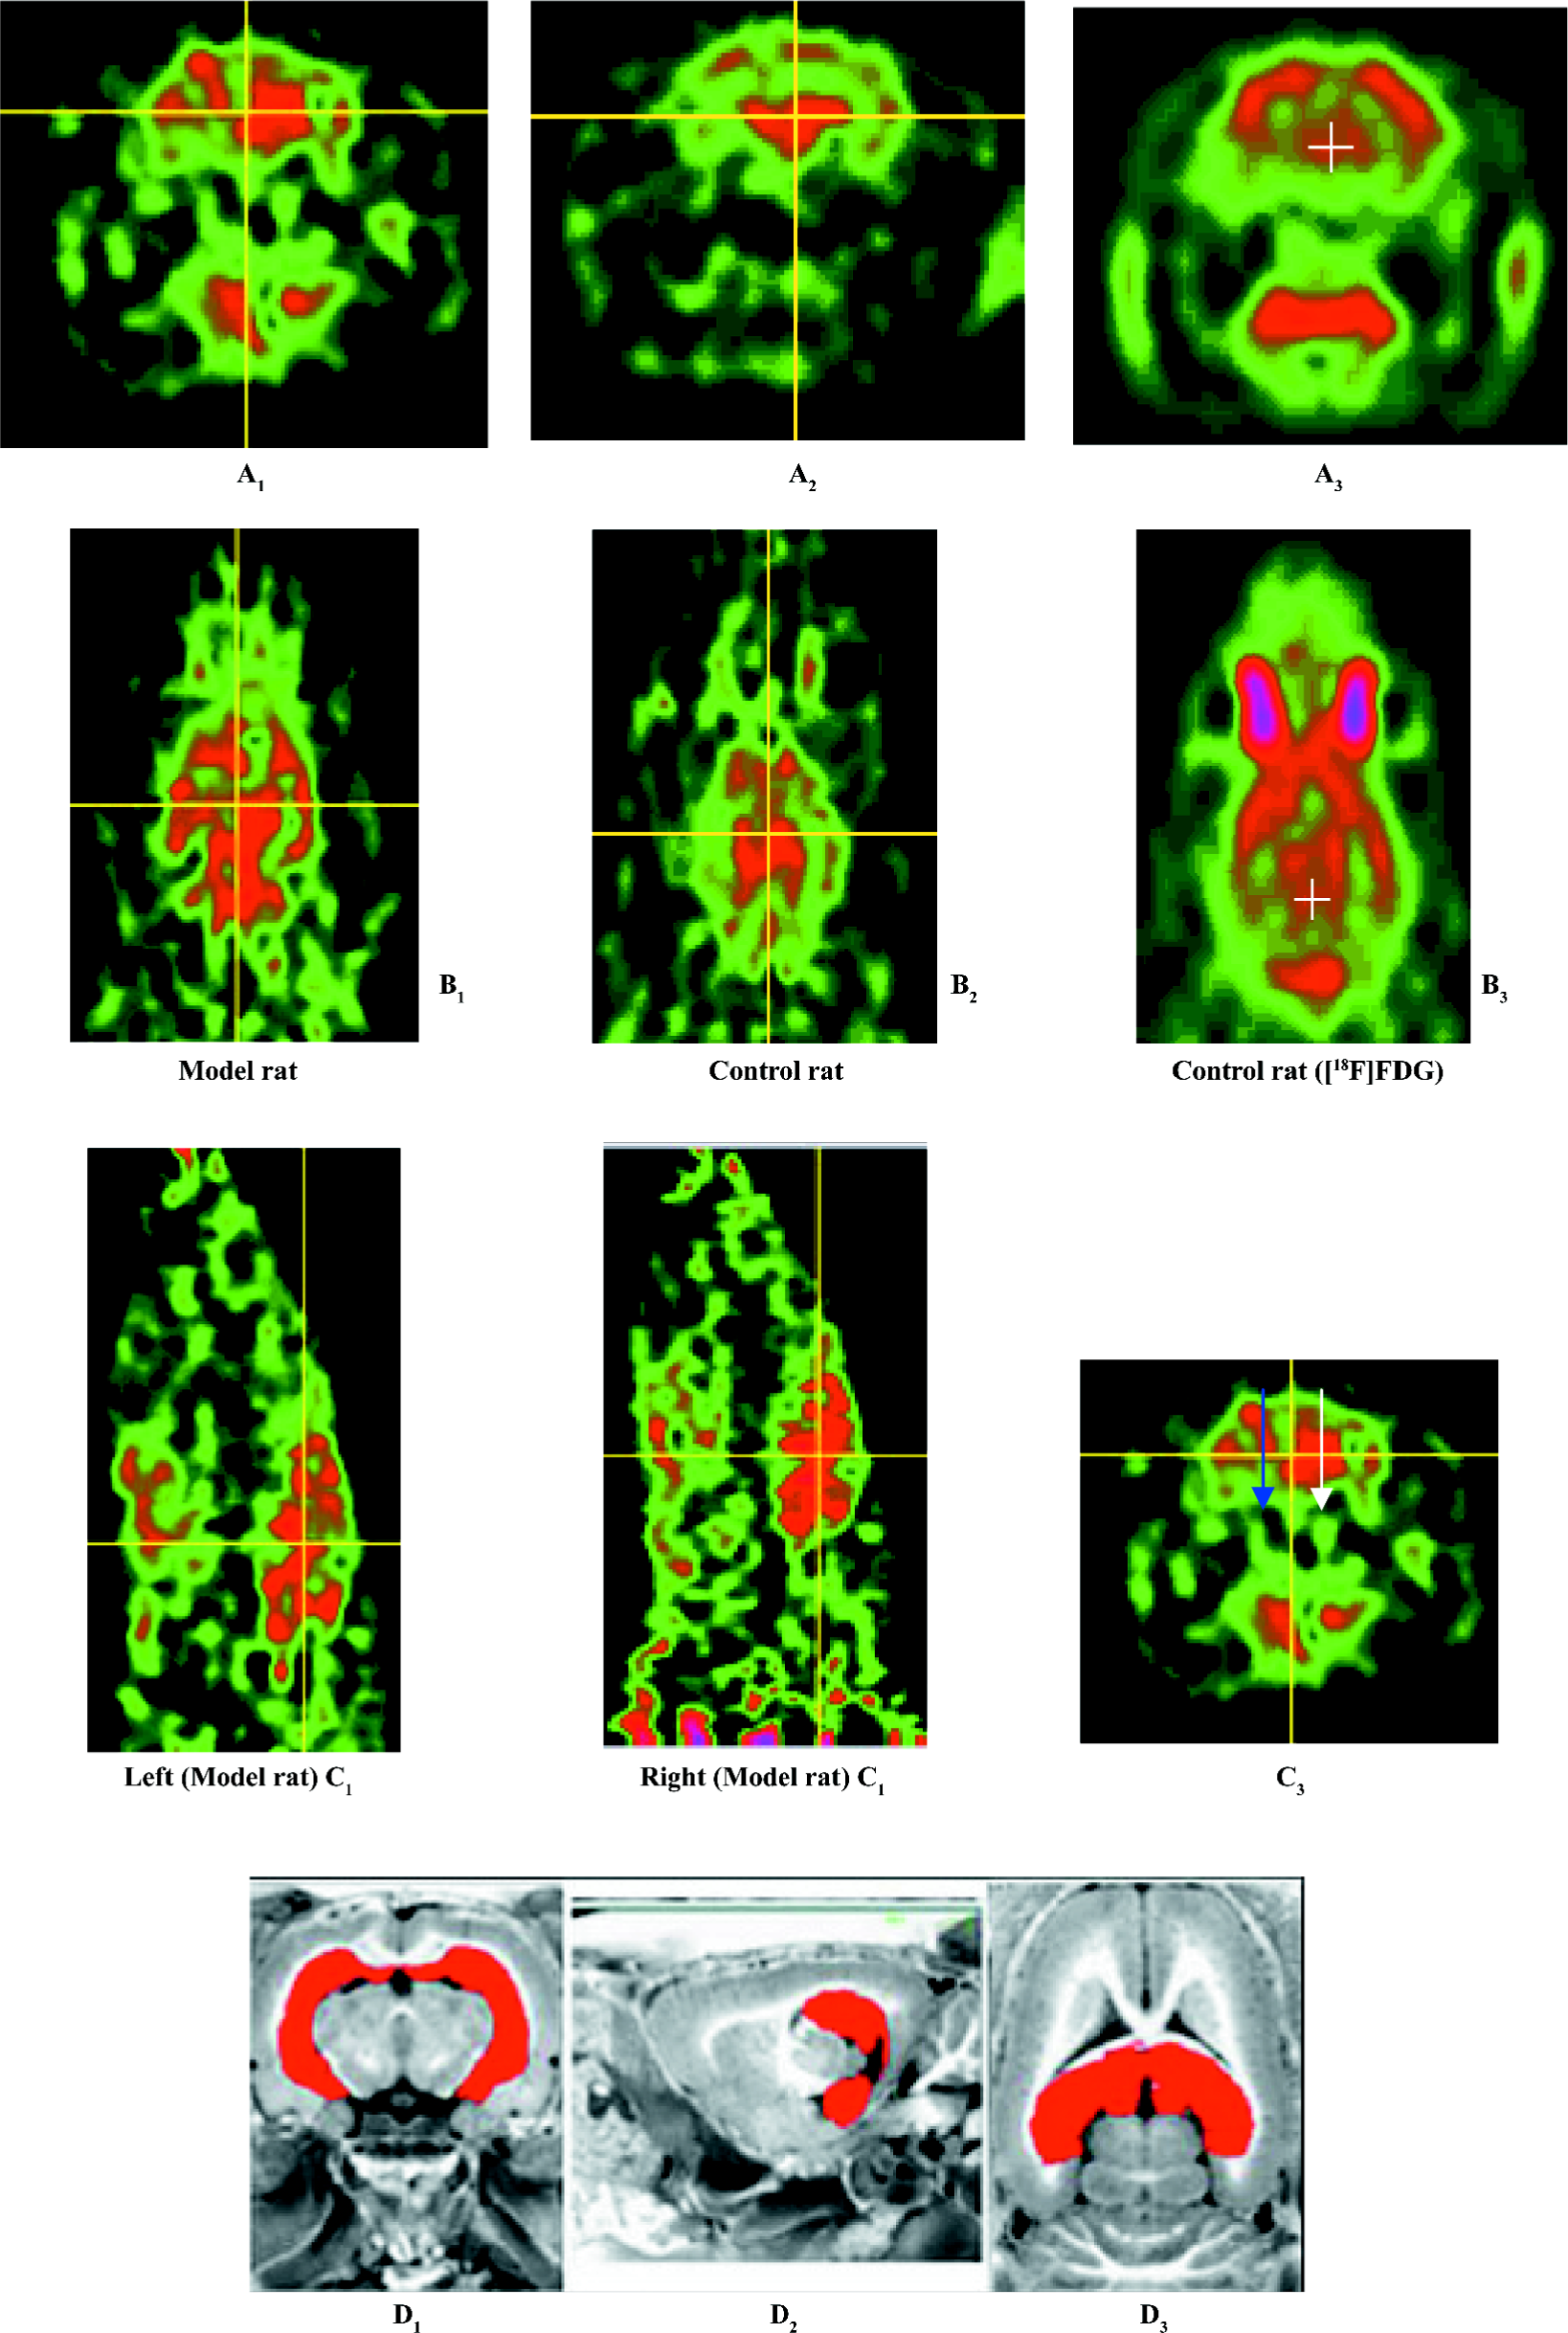
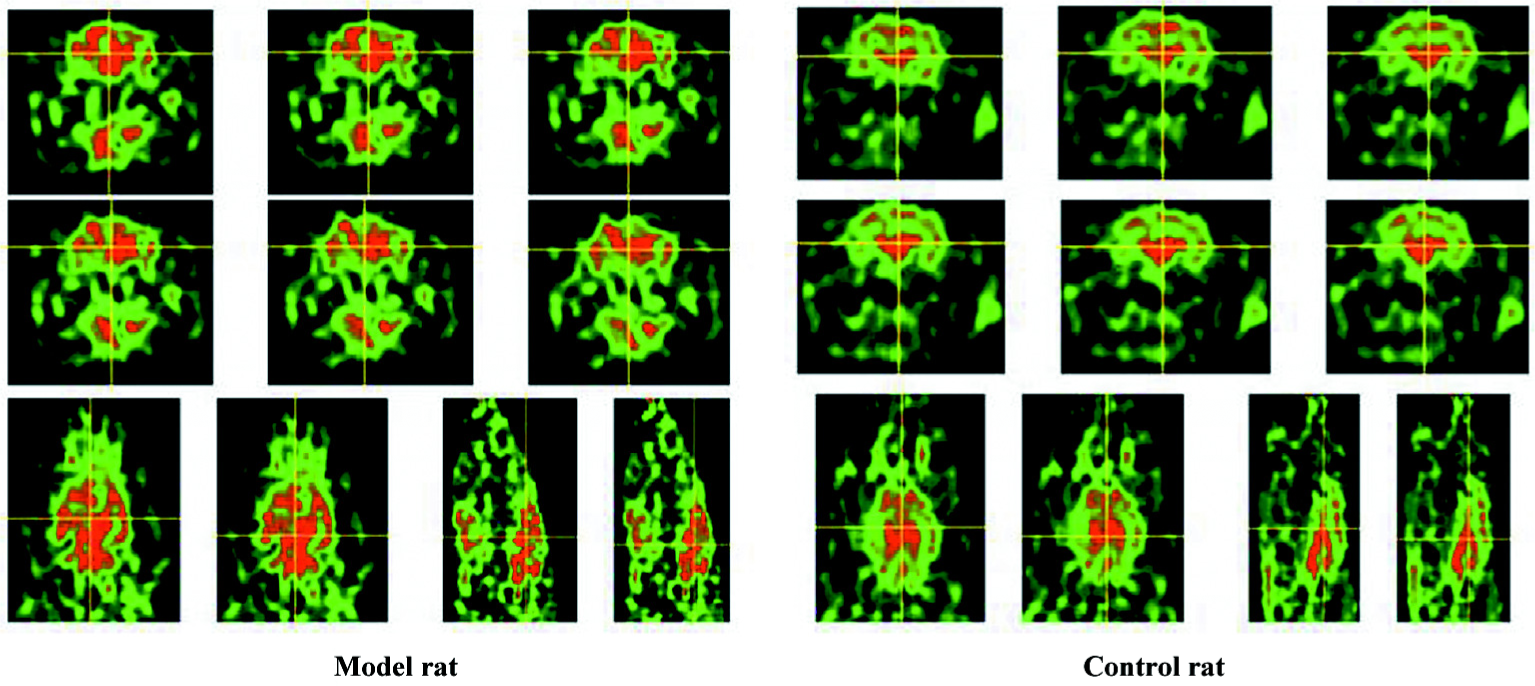
The distribution of [18F]O-FEt-PIB in the rat brains in vivo using micro-PET is also shown (Figures 4–7), and the results are interesting. Figure 4 shows the representative summed image of the dynamic scanning, which contained 23 frames of images. The fusional picture exhibited an unsymmetrical distribution of the radiotracer in the 2 hemicerebrums. The distribution of [18F]O-FEt-PIB in the single images, which were neither from early time (recorded at 0–5 min) or at late time (recorded at 30–40 min) showed no distinct difference in 2 hemicerebrums because the images were blurry or radioactivity was low (Figure 3). Figure 5 shows the increased aggregates of radioactivity in the right hemicerebrum in the AD model rats infused with 6 µg β-amyloid (1–40). Figure 5 shows a similar uptake of the radio tracer between the 2 hemicerebrums. This result indicated that the surgery could not induce an increased aggregate of the tracer after recovery. Figure 6 shows the adjacent transverse slices (each 0.12 mm thick), which confirmed the special distribution of the tracer in the special regions (the areas adjacent to the hippocampus) of the rat brains. ROI were defined on the 3-D digital map, and the mean activities were auto-given by the microPET ASIPro (Figure 7). The ADV(HT) was approximately 14.6% in the AD model rats, which was approximately 4 times great than that of the control rats (3.9%). The ADV in the cortex was 2.9% in the model rats compared to 5.6% in the control rats.
Discussion
Animal models of AD play an important role in understanding the pathology of the disease, the diagnosis, or therapeutic drugs. Although no current model has developed the full pathological spectrum of the disease, the transgenic rodent model was an ideal choice. However, recent studies have shown that although a large amount of amyloid plaques exist in the transgenic mouse brain, not enough high-binding sites could “capture” enough amounts of the [11C]PIB to form an aimed images using micro-PET imaging. Nitta et al and Wang et al have reported an injected rat model, which shows that injected β-amyloid could impair memory and elicit a degree of Alzheimer-type neurodegeneration. In the present study, we tried to apply this rat model for the in vivo imaging of β-amyloid deposits in the right hippocampus with micro-PET using a new synthesized PET tracer, [18F]O-FEt-PIB instead of [11C]PIB. In the present study, the brain, blood, and bone uptake and micro-PET imaging demonstrated excellent brain uptake of radioactivity in the rat brains. To our knowledge, this study is the first to show an increased aggregate of a small molecular PET probe for the aggregates of β-amyloid using in vivo micro-PET imaging with an AD-injected rat model. Further studies about new tracers and new AD rodent models are currently being undertaken in our laboratory.
Acknowledgements
The authors will thank the Amersham Kexing Pharmaceuticals (Jiading, Shanghai, China) for supplying the non-carrier-added [18F]F– solution. The authors also thank Prof Jiang-ning ZHOU from Hefei National Laboratory for Physical Sciences at Microscale and the Department of Neurobiology, School of Life Sciences, University of Science and Technology of China (Hefei, Anhui, China) for his help in the analyses of the micro-PET images.
References
- Cai LS, Innis RB, Pike VW. Radioligand development for PET imaging of β-amyloid (Aβ)-current status. Curr Med Chem 2007;14:19-52.
- Klunk WE, Lopresti BJ, Ikonomovic MD, Lefterov IM, Koldamova RP. Binding of the positron emission tomography tracer Pittsburgh compound-B reflects the amount of amyloid-β in Alzheimer’s disease brain but not in transgenic mouse brain. J Neurosci 2005; 25: 10 598–606.
- Toyama H, Ye D, Ichise M, Liow JS, Cai LS, Jacobowitz D, et al. PET imaging of brain with the β-amyloid probe, [11C]6-OH-BTA-1, in a transgenic mouse model of Alzheimer’s disease. Eur J Nucl Med Mol Imag 2005;32:593-600.
- Cai LS, Ye D, Liow JS, Hong J, Cohen RM, Pike VW, et al. PET imaging of transgenic mice TG2576 using the beta-amyloid radioligand, [C-11]PIB. Neuroimage 2006;31:T44-T186.
- Shimadzu H, Suemoto T, Suzuki M, Shiomitsu T, Okamura N, Kudo Y, et al. Novel probes for imaging amyloid-β: F-18 and C-11 labeling of 2-(4-aminostyryl)benzoxazole derivatives. J Label Compd Radiopharm 2004;47:181-90.
- Zheng MQ, Yin DZ, Shen YM, Li GC. Syntheses of 2-(p-aminophenyl)-6-substituent-benzothiazoles. Chin J Organ Chem 2007;27:1369-73. Chinese..
- Mathis CA, Holt DP, Wang Y, Huang GF, Debnath ML, Klunk WE. F-18-labeled thioflavin-T analogs for amyloid assessment. J Nucl Med 2002;43:166.
- Zheng MQ, Yin DZ, Zhang L, Cheng DF, Wang YX, Cai HC. Synthesis and evaluation of 18F-labelled PIB as amyloid imaging agents. J Label Compd Radiopharm 2007;50 Suppl 1:S401.
- Cheng DF, Yin DZ, Li GC, Wang MW, Li SQ, Zheng MQ, et al. Radiolabeling and in vitro and in vivo characterization of [18F]FB-[R8,15,21, L17]-VIP as a PET imaging agent for tumor overexpressed VIP receptors. Chem Biol Drug Design 2006;68:319-25.
- Zheng MQ, Yin DZ, Qiao JP, Zhang L, Wang YX. Syntheses and evaluation of fluorinated benzothiazole anilines as potential tracers for β-amyloid plaques in Alzheimer’s disease. J Fluorine Chem 2008;129:210-6.
- Wang R, Zhang HY, Tang XC. Huperzine A attenuates cognitive dysfunction and neuronal degeneration caused by β-amyloid protein (1–40) in rat. Eur J Pharmacol 2001;421:149-56.
- Nitta A, Tuktta T, Hasegawa T, Nabeshima T. Continuous infusion of beta-amyloid protein into the rat cerebral ventricle induces learning impairment and neuronal and morphological degeneration. Jpn J Pharmacol 1997;73:51-7.
- Cai HC, Yin DZ, Zhang L, Yang XF, Xu XY, Liu WG. Preparation and biological evaluation of 2-amino-6-[18F]fluoro-9-(4-hydroxy-3-hydroxy-methylbutyl) purine (6-[18F]FPCY) as a novel PET probe for imaging HSV1-tk reporter gene expression. Nucl Med Biol 2007;34:717-25.
- Rubins DJ, Melega WP, Lacan G, Way B, Plenevaux A, Luxen A, et al. Development and evaluation of an automated atlas-based image analysis method for microPET studies of the rat brain. NeuroImage 2003;20:2100-18.
- Mathis CA, Wang Y, Holt DP, Huang GF, Debnath ML, Klunk WE. Synthesis and evaluation of 11C-labeled 6-substituted 2-arylbenzothiazoles as amyloid imaging. Agents J Med Chem 2003;46:2740-54.