
Comparative proteomic analysis of human osteosarcoma and SV40-immortalized normal osteoblastic cell lines1
Introduction
Osteosarcoma (OS) is the most common non-hematological malignant bone tumor appearing in the first 2 decades of life with an annual incidence rate of 5.6 per million[1]. It is characterized by osteoid material produced by malignant osteoblastic cells. After an initial diagnosis, patients usually receive standard treatment, such as neoadjuvant chemotherapy and surgical resection. Unfortunately, only 60%–70% of the adolescents with non-metastatic OS are cured by standard treatments[2,3]. Although given more intensive upfront systemic treatment using more powerful drugs and maximally aggressive surgery of the primary tumor and all metastatic foci, one-third of the patients ultimately deceased due to respiratory failure because of a poor response to multi-agent chemotherapy and progressive pulmonary metastasis[2]. The challenge is that patients exhibiting a poor histological response to presurgical chemotherapy (tumor necrosis rate <90%) will have a worse prognosis[3]. It is thus important to identify tumor cell-specific biomarkers for the early detection and prognosis, which will hasten appropriate diagnoses and the initiation of therapeutic intervention. Understanding the underlying molecular mechanisms that lead to OS will contribute to the identification of such candidate biomarkers.
Comparative proteomic studies using 2-D gel electrophoresis coupled to mass spectrometric identification has been applied in studies of various cancers, including hepatomas[4], lung cancer[5], prostate[6], and ovarian cancers[7]. The search for markers and vaccines at the protein level is more reliable than at the transcriptional level, as the translation process is often unpredictable and the spatiotemporal in situ localization of a given protein is not often correlated with its in situ expression pattern[8]. Although several genomic studies have been performed using pediatric OS primary tumor tissues or cells[9,10], comparative proteomic studies on OS are rare. Recently, a preliminary investigation on the difference between SaOS-2 and primary osteoblastic cell cultures was performed[11].
Molecular studies of OS face technical challenges of obtaining adequate material after presurgical necrotizing chemotherapy and the need for decalcification of specimens[1]. In addition, the overall rarity of OS significantly contributes to the difficulty in studying OS. The human immortalized osteoblastic cell line carries more similar biological aspects and phenotypes than primary osteoblastic cell cultures compared with OS cell lines. In the present study, we selected 3 human OS cell lines (U2OS, SaOS-2, and IOR/OS9) and the SV40-immortalized normal osteoblastic cell line (hFOB1.19) as a model system. To investigate differences in the protein levels between OS cells and control cells, we performed differential protein level analyses using 2-D gel electrophoresis and matrix-assisted laser desorption/ionization-time of flight (MALDI–TOF) mass spectrometry. We identified 26 proteins, the levels of which were either enhanced or decreased in OS cells relative to the control cells. The overproduction of activator of 90 kDa shock protein ATPase homolog 1 (AHA1) and stomatin-like protein 2 (SLP-2) was further evaluated by Western blot analyses. We demonstrate for the first time that AHA1 is overproduced in OS tumor cells and confirm the overproduction of SLP-2 in OS cells, which was also observed in other tumor cells[12]. The latter proteins and others may be useful in identifying novel biomarkers for OS.
Materials and methods
Reagents and materials Electrophoresis reagents including acrylamide, methylenebisacrylamide, N,N,N',N'-tetramethylethyl-diamide, hydroxymethyl aminomethane (Tris), glycine, SDS, dithiothreitol (DTT), iodoacetamide, α-cyano-4-hydroxy-cinnamic acid, urea, and thiourea were obtained from Sigma-Aldrich (St Louis, MO, USA). 3-(3-[Cholamidopropyl] dimethyl-ammonio)-1-propane-sulfonate (CHAPS), Immobiline DryStrips, Immobilized pH gradient (IPG) buffer, the 2D Clean-up Kit, the 2D Quant Kit, and the Deep Purple Kit were purchased from Amersham Pharmacia (Uppsala, Sweden). Trypsin was obtained from Boehringer Mannheim (Mannheim, Germany).
Dulbecco’s modified Eagle’s medium (DMEM) and fetal bovine serum (FBS) were purchased from Gibco (Carlsbad, CA, USA). Culture plates were obtained from Corning Costar (Corning, NY, USA).
Cell culture Human osteogenic sarcoma cell lines U2OS and SaOS-2, and the normal osteoblastic cell line hFOB1.19 (expressing SV40 large T antigen), were originally obtained from the American Type Culture Collection (Manassas, VA, USA). The IOR/OS9 cell line was a generous gift from Dr Massimo SERRA (Rizzoli Institute, Bologna, Italy). All of the cells were adherent and epithelial. IOR/OS9 was established from a bone metastasis of a high-grade OS[9]. The patient had received chemotherapy with adriamycin, cisplatin, and methotrexate before establishment of the cell line. The OS cell lines were cultured in DMEM, and hFOB1.19 was cultured in a 1:1 mixture of Ham’s F12 medium and DMEM without phenol red and with 2.5 mmol/L L-glutamine and 0.3 mg/mL G418, both containing 10% FBS, 100 units/mL penicillin, and 100 μg/mL streptomycin. All cultures were maintained in 10 cm diameter plates in a humidified atmosphere of 5% CO2 at 37 oC. U2OS, IOR/OS9, and hFOB1.19 cells were passaged every 2 to 3 d, and SaOS-2 cells were passaged every 4 to 5 d. The cells were collected when confluence was obtained.
Sample preparation Monolayers were washed 3 times with 10 mL ice-cold Tris-buffered sucrose (10 mmol/L Tris, 250 mmol/L sucrose; pH 7) and then lysed by incubation for 10 min on ice at room temperature with 300 µL extraction buffer containing 7 mol/L urea, 4% CHAPS, 2 mol/L thiourea, and 30 mmol/L Tris (pH 8.5). The cells were harvested using a cell scraper and sonicated on ice. The cytosolic fraction was separated by centrifugation at 12 000×g for 30 min at 4 oC. The supernatant was collected and stored in aliquots of 500 µL in microcentrifuge tubes at -80 oC. Prior to use, the samples were desalted using the 2D Clean-up Kit, and the protein concentration was determined using the 2D Quant Kit, according to the manufacturer’s instructions.
2-D gel electrophoresis Total cytosolic protein fractions (400 µg) were mixed with 225 µL loading buffer and rehydration buffer containing 7 mmol/L Urea, 2 mmol/L thiourea and 4% CHAPS to be separated using IPG strips and to obtain a final volume of 450 µL. The samples were applied to the gel for re-swelling with a dry IPG of 24 cm, pH 3–10 non-linear gradient strips on an IPGPhor II system (Amersham Pharmacia, Uppsala, Sweden). Complete sample uptake into the strips was achieved after electrophoresis for 12 h at 30 V. Focusing was performed at 500 V for 1 h and at 1000 V for 1 h, and then at 8000 V up to total 85 000 V·h. The current was limited to 50 µA/strip and the temperature was kept at 20 oC for all IEF steps. For SDS-PAGE, the IPG strips were incubated for 15 min twice, once in equilibration buffer A containing 50 mmol/L Tris-HCl (pH 8.8), 6 mol/L urea, 2% SDS, 30% glycerol, and 1% DTT, and once in equilibration buffer B, containing 50 mmol/L Tris-HCl (pH 8.8), 6 mol/L urea, 2% SDS, 30% glycerol, and 2.5% iodoacetamide. Electrophoresis was carried out at 20 oC using an Ettan Daltsix system (Amersham Pharmacia, Uppsala, Sweden) with 25 mmol/L Tris added to the running buffer containing 192 mmol/L glycine and 0.1% SDS, at 2 W/gel for 50 min and at 17 W/gel for almost 5 h, until the bromophenol blue front had reached the bottom of the gel. Samples were run 3 times for 3 independent cell culture experiments.
Analysis of gel images Gels were stained with Deep Purple according to the manufacturer’s instructions. Stained 2-D gels were scanned using Image scanner Typhoon 9400 (Amersham Pharmacia, Uppsala, Sweden) and analyzed using ImageMaster 2D Platinum software 5.0 (Amersham Pharmacia, Uppsala, Sweden). After automatic spot detection, the background was removed from each gel and the images were manually edited (eg adding, splitting, and removing spots). One gel was chosen as the master gel and used for the automatic matching of spots in the other 2-D gel electrophoresis. The average volume of each spot was calculated using 3 gels. 2-D images of the OS cell lines were compared to those obtained using hFOB1.19 cells. Proteins, the levels of which were at least enhanced or decreased by 2.0-fold, were considered as significant (P<0.05 according to Student’s t-test).
In-gel trypsin digestion Spots corresponding to the proteins of interest were excised from the prepared 2-D gels and subjected to fully automated spot handling in an Ettan Spot Handling Workstation (Amersham Pharmacia, Uppsala, Sweden). The gel plugs were removed using a 1.4 µm picking head and destained at room temperature, twice in 50% methanol/50 mmol/L ammonium bicarbonate and once in 75% acetonitrile before drying. The dried gel pieces were rehydrated with 20 µL of 50 mmol/L ammonium bicarbonate (pH 8), containing 20 µg/mL trypsin and allowing protein digestion at 37 oC overnight. The samples were then dried in a vacuum centrifuge and dissolved in 3 µL matrix containing 5 mg/mL recrystallized α-cyano-4-hydroxy-cinnamic acid. In the last step, 0.3 µL dissolved sample was spotted on the target slides.
MALDI-TOF mass-mediated identification and database searching The samples were then analyzed to generate peptide mass fingerprinting (PMF) by an Ettan MALDI-TOF mass spectrometer (Amersham Pharmacia, Uppsala, Sweden) equipped with a 337.1 nm nitrogen laser and the delayed extraction facility. All spectra were acquired in the positive ion reflector mode and an average of 200 laser shots were recorded per sample. Tryptic monoisotopic peptide masses were searched for in the SwissProt database, using Mascot software (http://www.matrixscience.com) with a mass tolerance setting of 100 ppm, one missed cleavage site as fixed parameters, and cysteine carbamidomethylation and methionine oxidation as variable modification.
Western blotting Thirty-microgram aliquots of cell lysates were separated on denaturing 10% polyacrylamide gels, electroblotted onto nitrocellulose membranes (Amer-sham Pharmacia, Uppsala, Sweden), and blocked with 4% skim milk powder in TBS. Subsequently, the membranes were incubated at 4 oC overnight with monoclonal antibodies against AHA1 (1:500 dilution; Santa Cruz Biotechnology, CA, USA) or SLP-2 (1:200 dilution; BD, Bedford, MA, USA) followed by incubation with horseradish peroxidase-conjugated anti-goat or anti-mouse IgG for 1 h, respectively. Thereafter, the membranes were washed with TBS containing 0.05% Tween-20. Signals were developed using an enhanced chemi-luminescence system (Amersham Pharmacia, Uppsala, Sweden).
Results
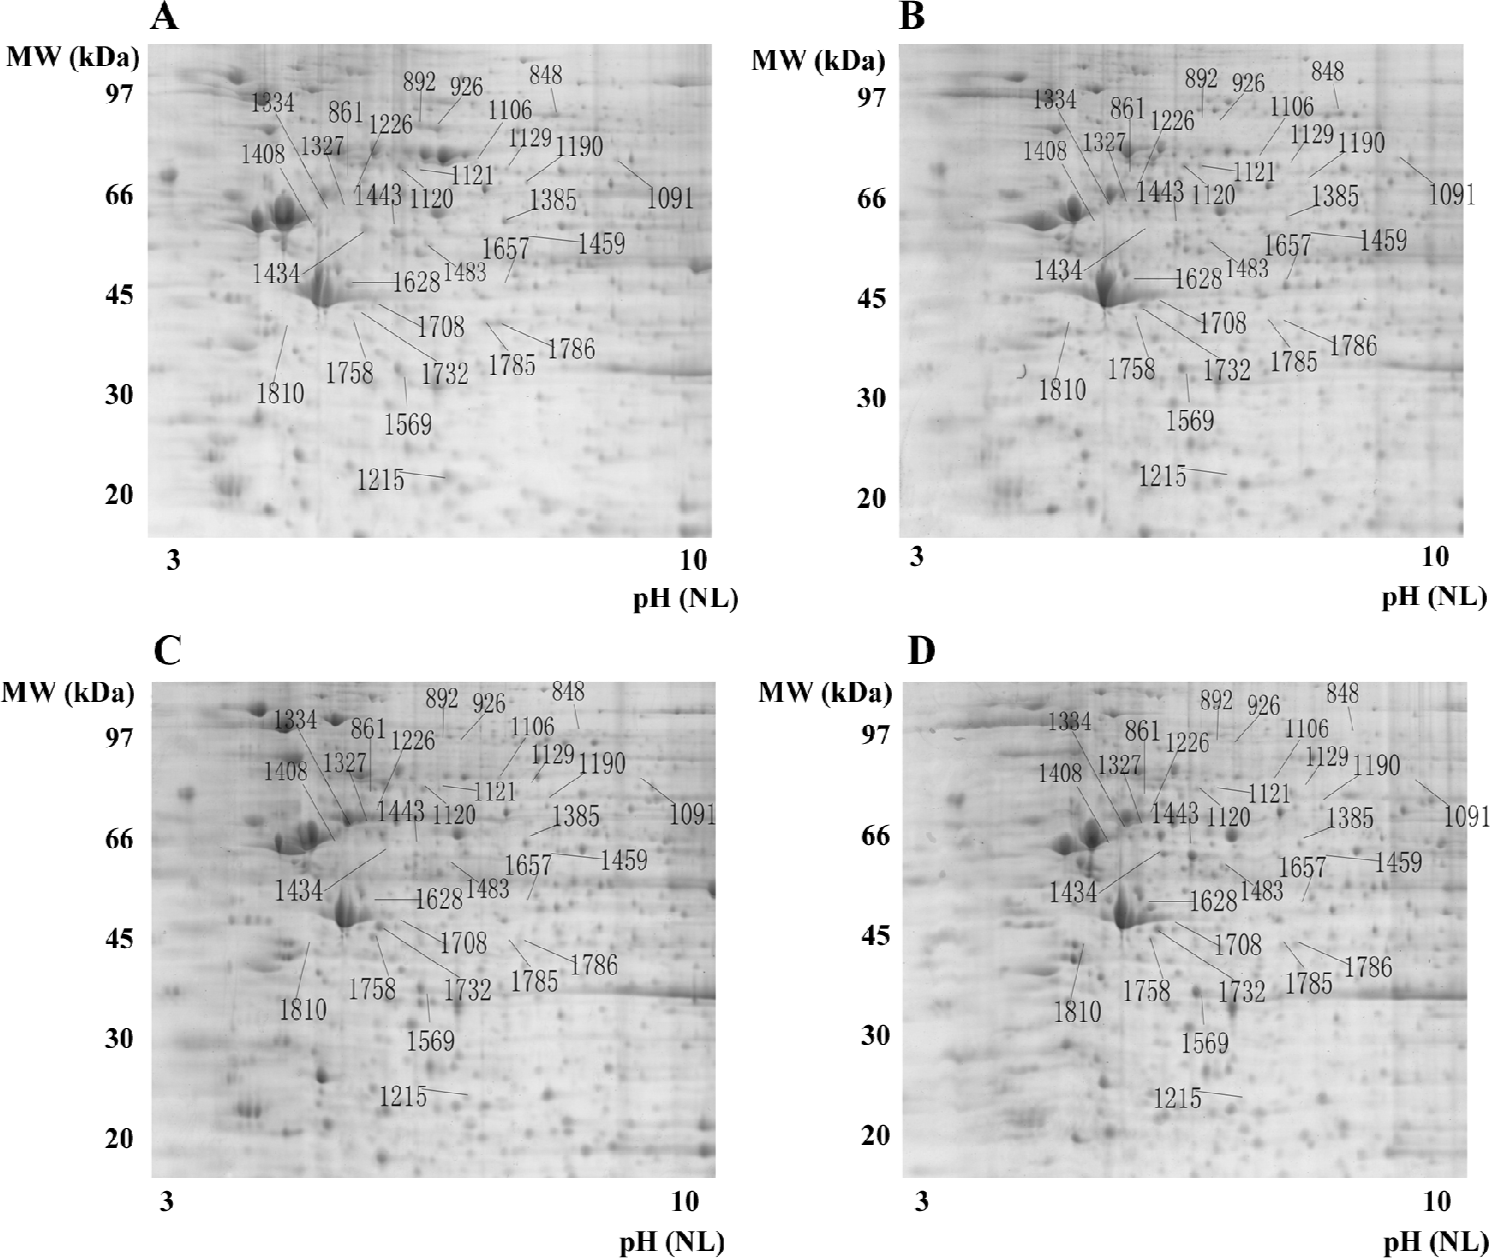
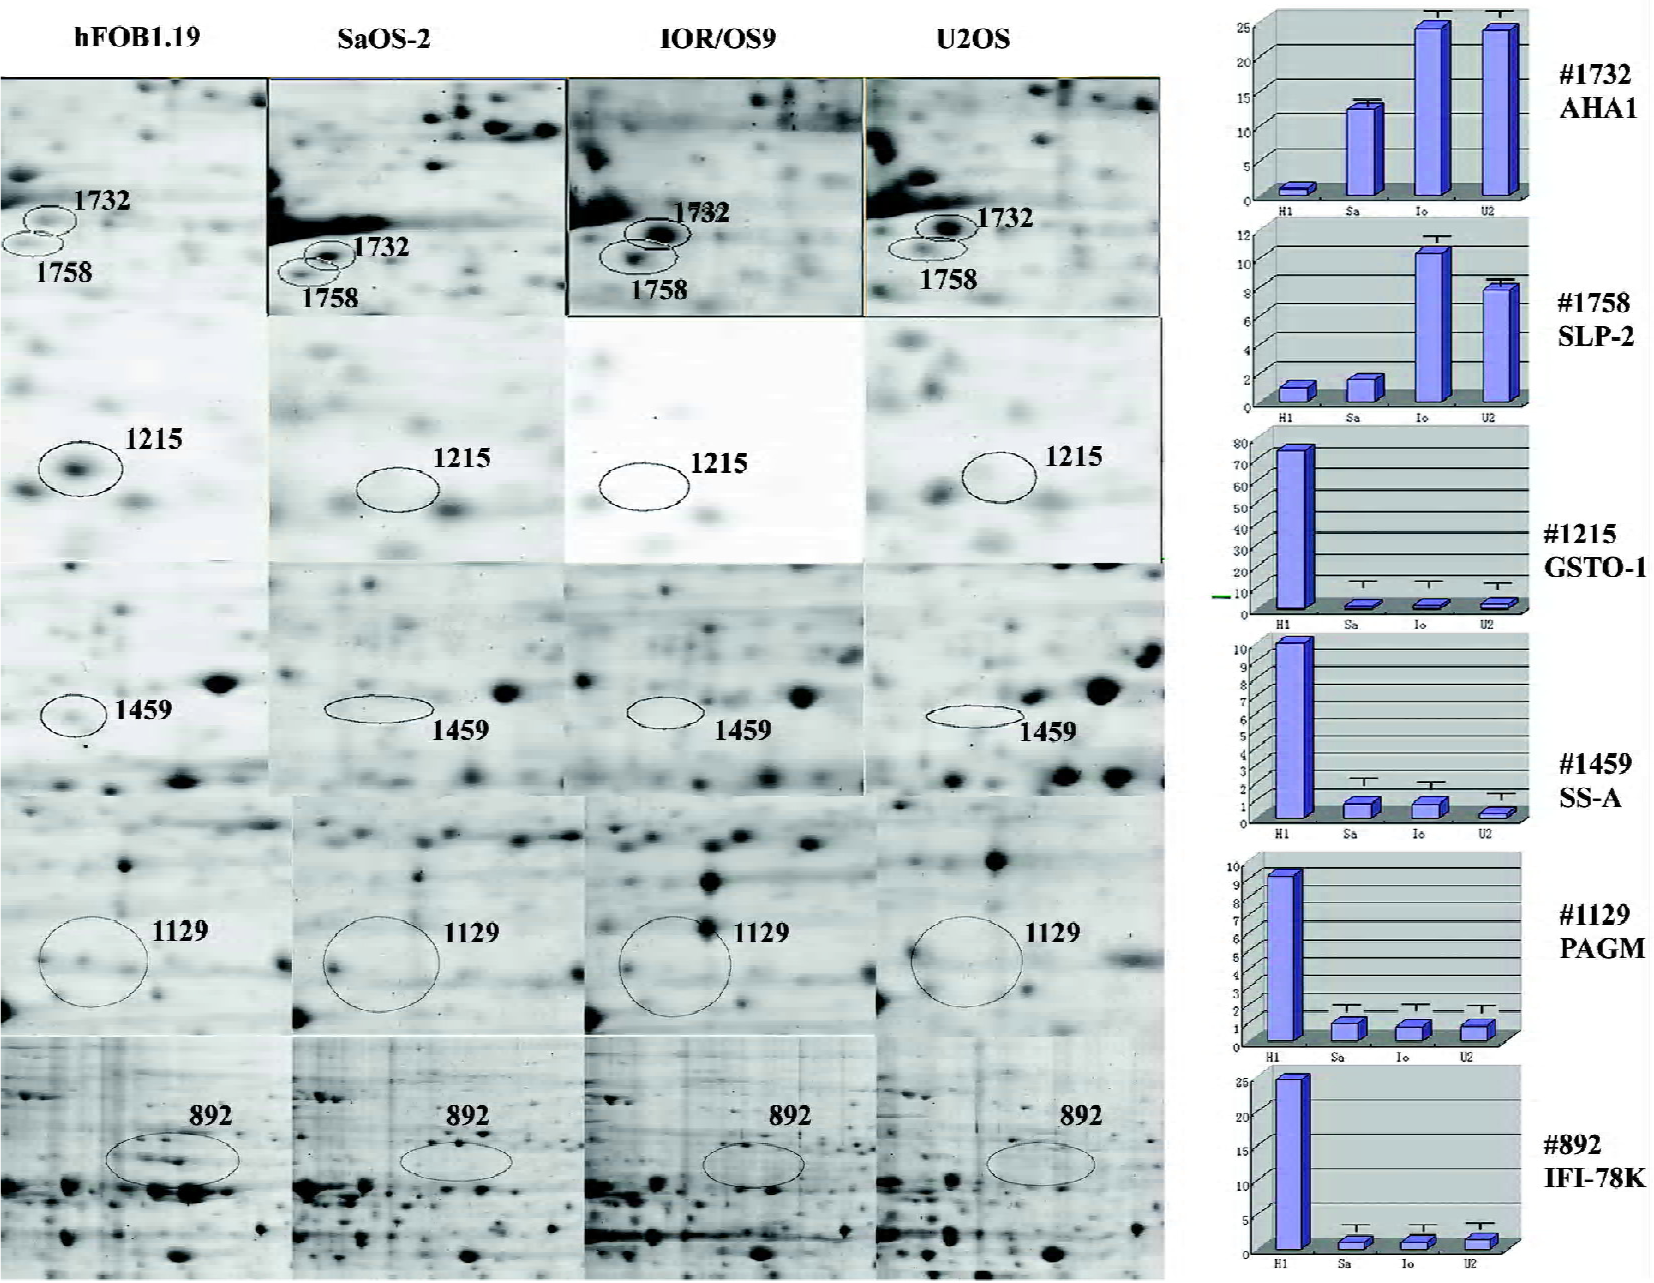
Evaluation of protein patterns of OS and control cells using 2-D gel electrophoresis 2-D gel electrophoresis was performed 3 times for each cell line (U2OS, SaOS-2, and IOR/OS9) to ensure reproducibility. Approximately 2000 protein spots were detected on the Deep Purple-stained gel by ImageMaster (1885±82 spots in hFOB1.19, 1826±121 spots in U2OS, 1892±81 spots in SaOS-2, and 1870±90 spots in IOR/OS9 protein samples; Figure 1). After matching the patterns obtained by the 3 independent experiments, the patterns of the U2OS, SaOS-2, and IOR/OS9 protein samples were compared with that of hFOB1.19 cells. Several series of proteins, the levels of which appeared to be at least enhanced or decreased by 2-fold in the OS cell lines as compared to the control cells were determined. Among those, we identified AHA1, the level of which increased 12.4-, 24.1-, and 23.8-fold in SaOS-2, IOR/OS9, and U2OS cells, respectively with respect to normal osteoblastic cells (Figure 2, #1732), SLP-2, the level of which increased 10.4- and 7.8-fold in IOR/OS9, and U2OS cells, respectively, but no obvious changes were observed in SaOS-2 cells (Figure 2, #1758). On the contrary, the level of glutathione transferase omega-1 (GSTO-1) decreased 74.1-, 47.2-, and 35.1-fold (Figure 2, #1215), the level of the 52 kDa Ro protein (SS-A) decreased 12.1-, 12.6-, and 45.5-fold (Figure 2, #1459), the level of phosphoacetylglucosamine mutase (PAGM) decreased 9.2-, 11.2-, and 10.8-fold (Figure 2, #1129), and the level of interferon-induced GTP-binding protein Mx (IFI-78K) decreased 24.6-, 22.9-, and 18.2-fold (Figure 2, #892) in SaOS-2, IOR/OS9, and U2OS cells, respectively for hFOB1.19. Fifty-eight differentially-produced proteins of interest were selected for subsequent analysis by mass spectrometry.
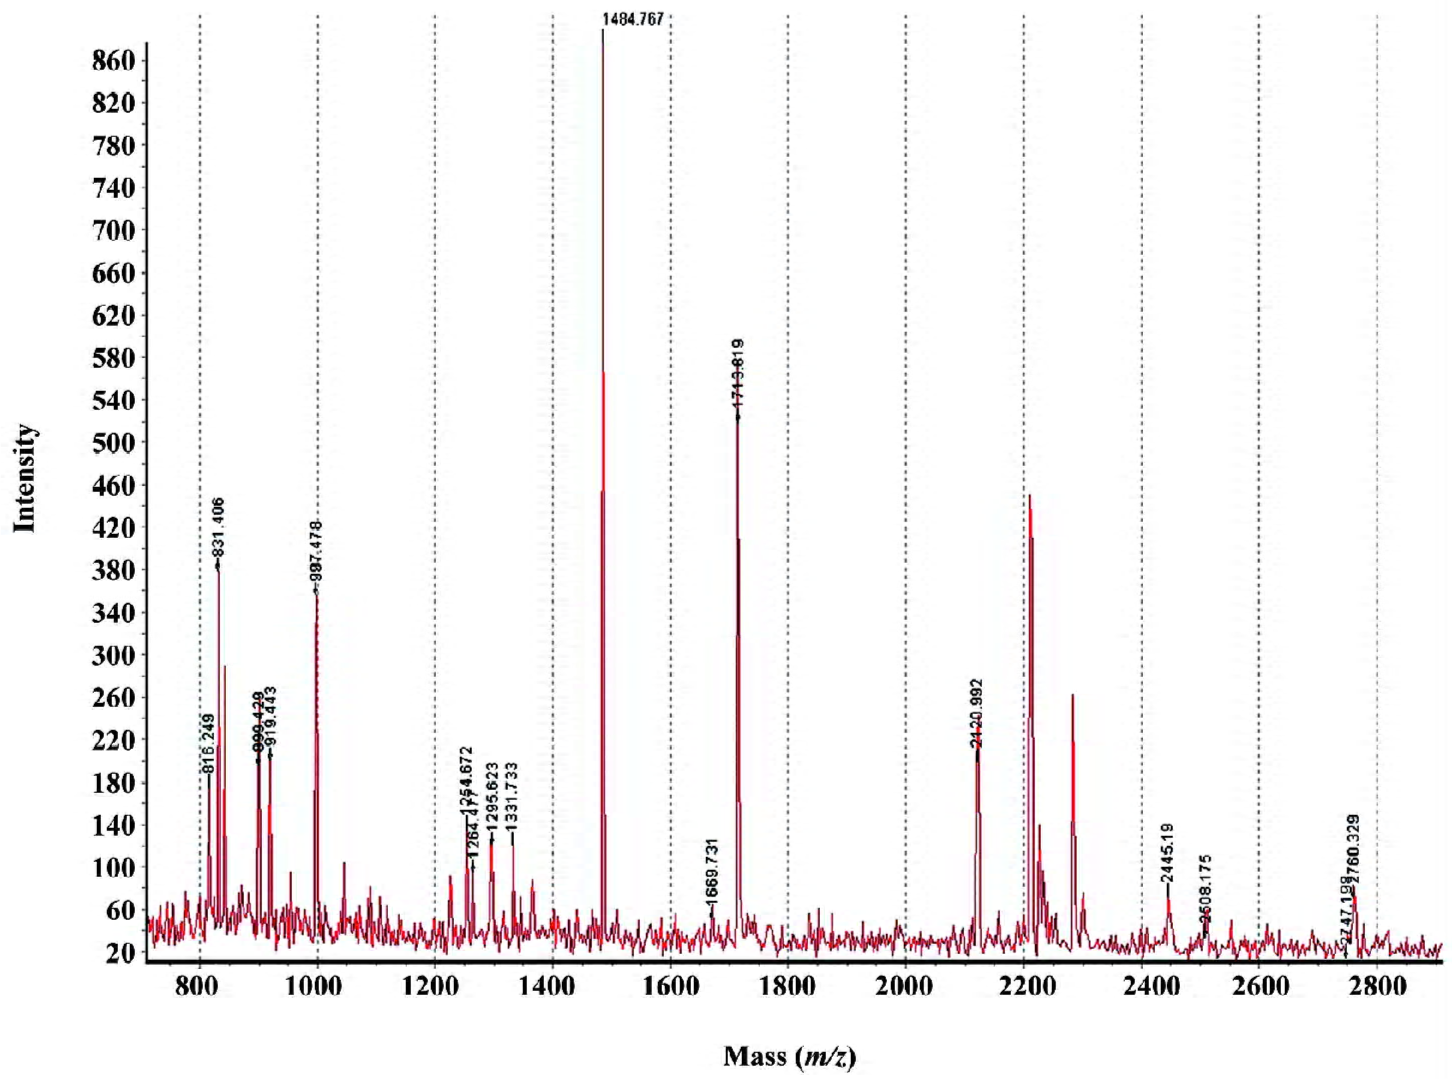
MALDI-TOF mass spectrometry-mediated protein identification and peptide mass fingerprinting The selected protein spots from the Deep Purple-stained gels were excised and subjected to in-gel tryptic digestion. The extracted peptides were analyzed by MALDI-TOF mass spectrometry to generate PMF. In total, we successfully identified 29 differentially produced protein spots from the 58 spots that were selected. Although some corresponded to the same protein, for example spots #892 and #926 identified as the same protein (interferon-induced GTP-binding protein Mx1), 26 proteins, the levels of which were either enhanced or decreased, were identified by PMF searching against the SwissProt database (Table 1). Spot #1732 was identified as the activator of 90 kDa heat shock protein ATPase homolog 1 (AHA1) by database searching using PMF (Figure 3).
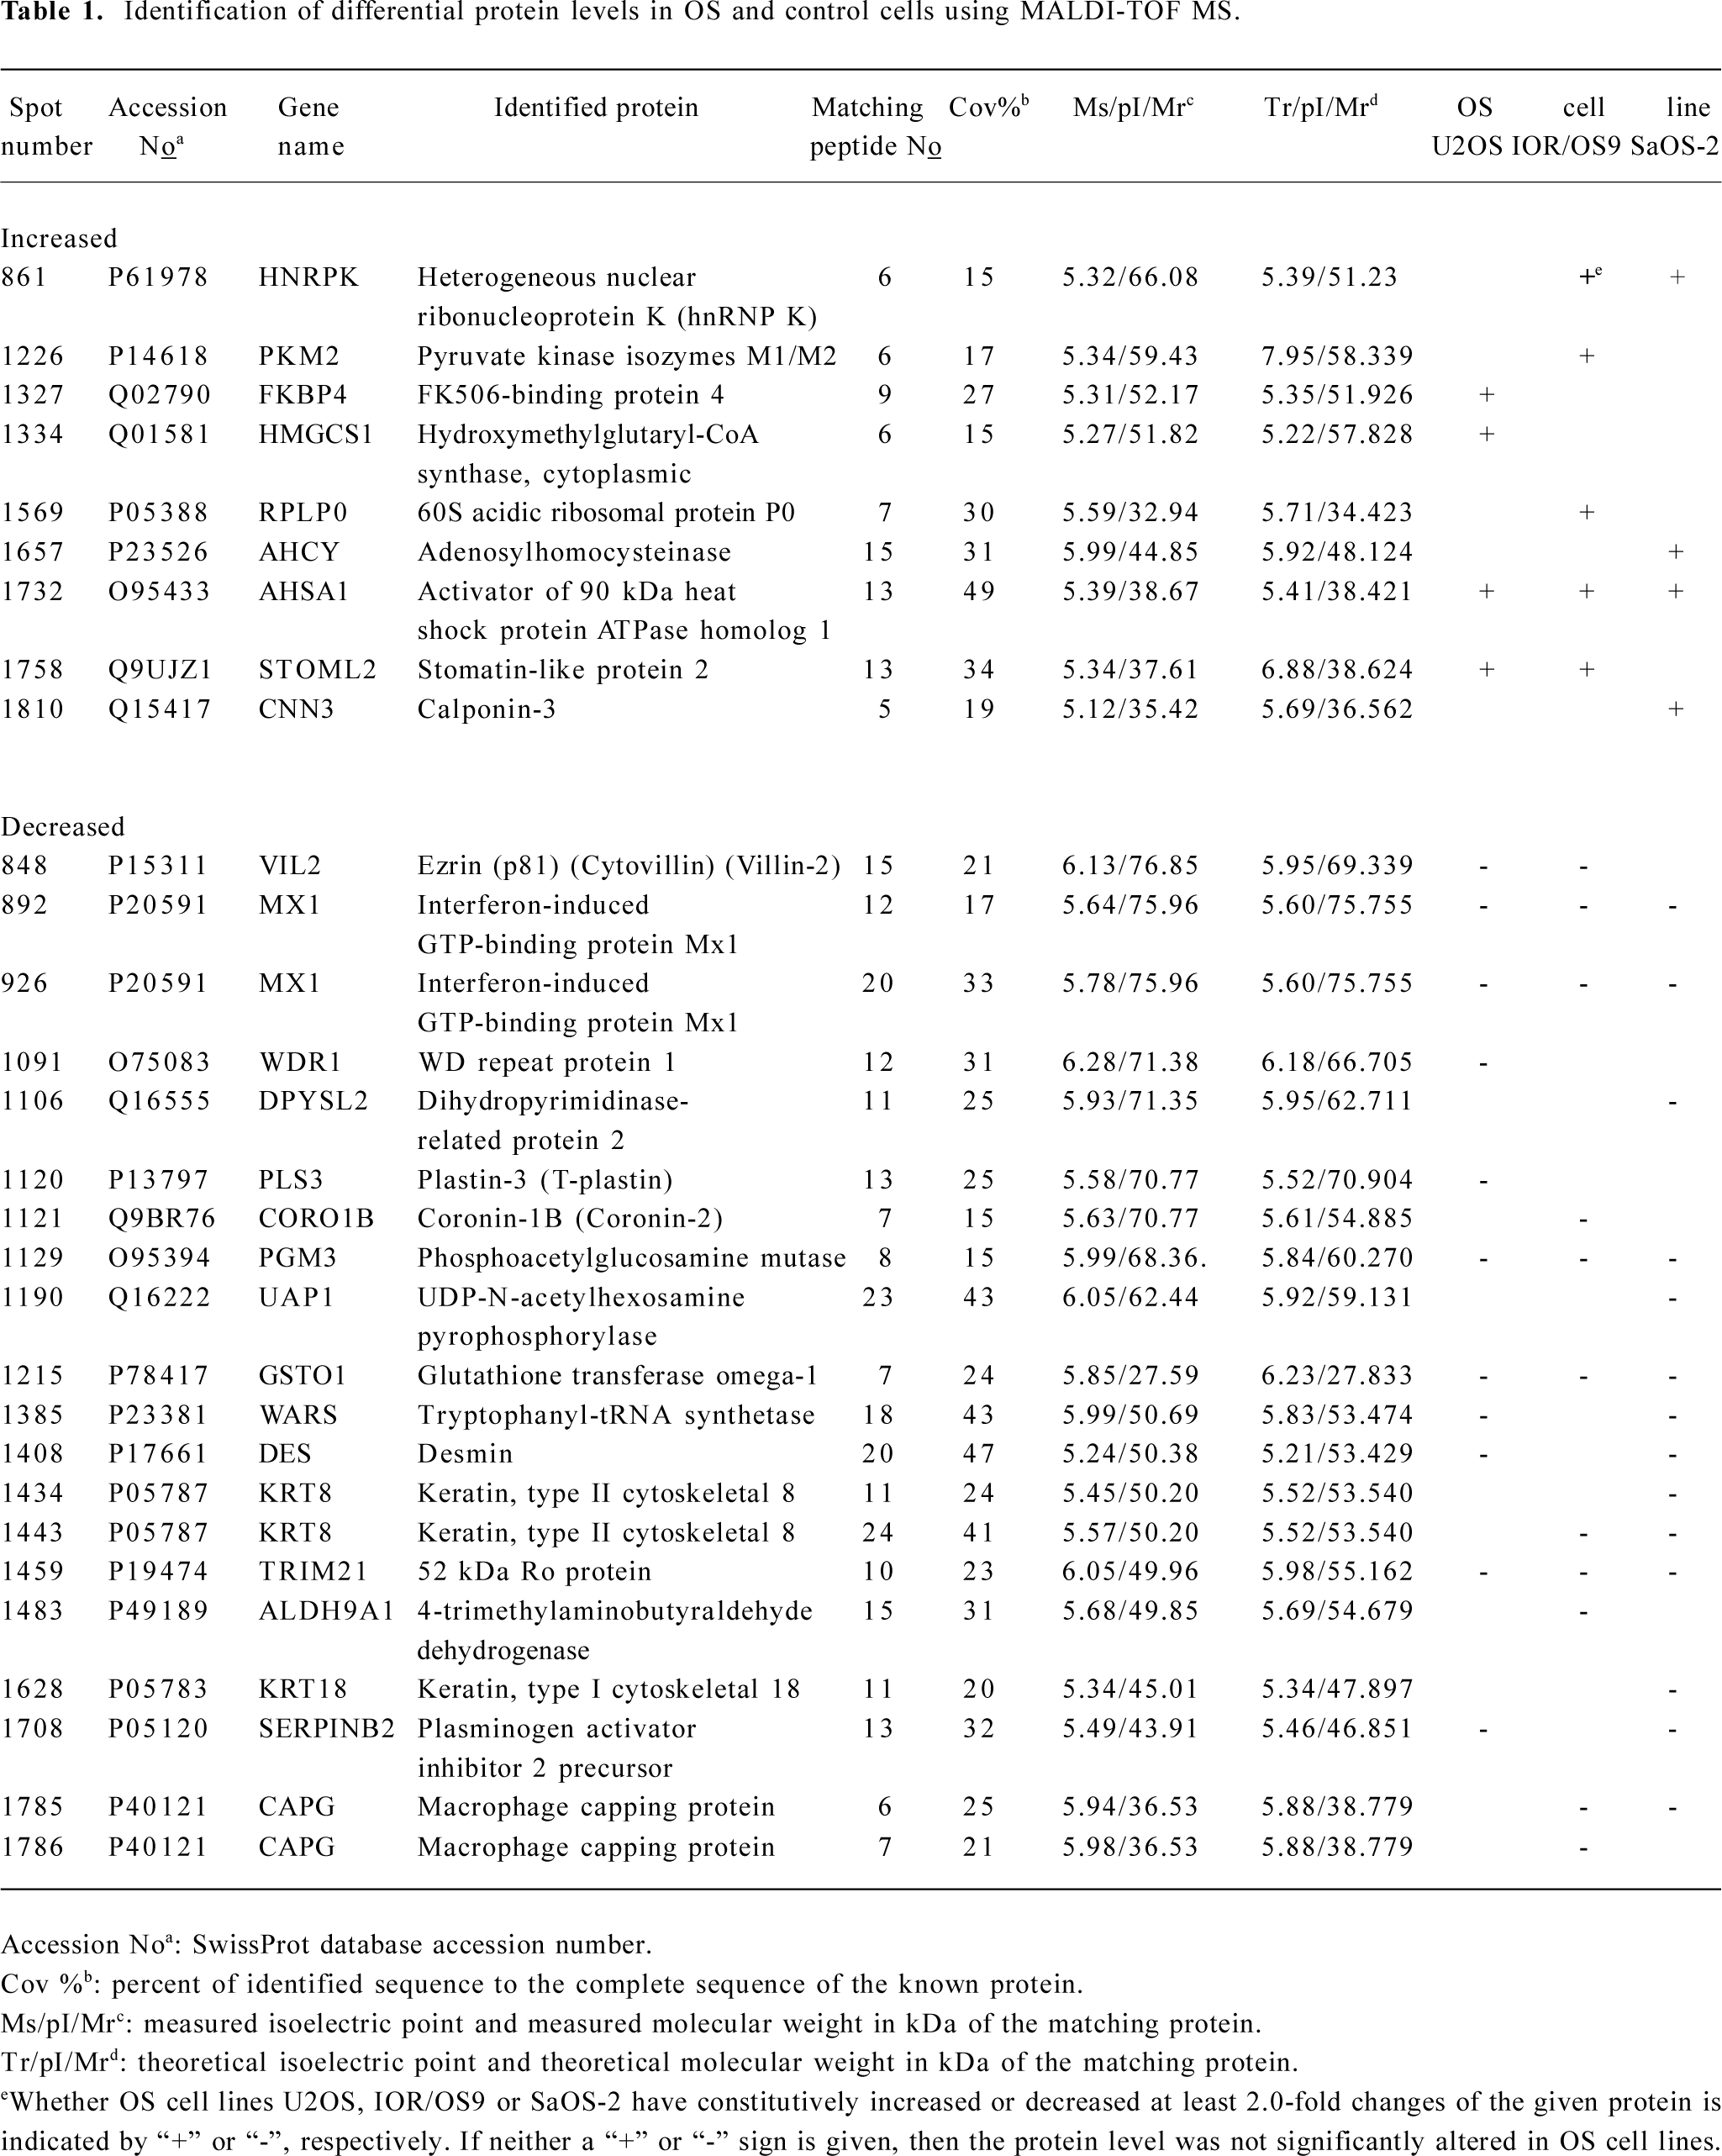
Full table
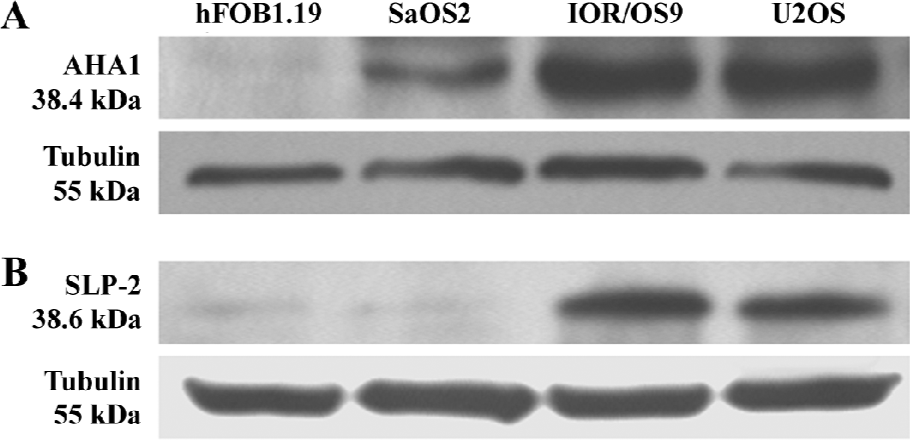
Western blot analyses Two over-produced proteins of interest, AHA1 and SLP-2, were selected for further validation by Western blot analyses. The Western blot results confirmed that the level of AHA1 was significantly increased in U2OS, IOR/OS9, and SaOS-2 for hFOB1.19 cells (Figure 4A). Similarly, the level of SLP-2 was significantly increased in U2OS and IOR/OS9, but no obvious changes were observed in SaOS-2 cells (Figure 4B). The results obtained by the Western blots are in accordance with the observations based on the comparative proteomic analyses.
Discussion
The comparative proteomic analysis has been widely accepted as a tool in gaining insight into different protein expressions reflecting complex cellular states, such as tumor versus normal tissue[5]. In this study, we identified 26 proteins, the levels of which were either enhanced or decreased in human OS cells as compared to the SV40-immortalized normal human immortalized osteoblastic cells using 2-D gel electrophoresis coupled to MALDI-TOF mass spectrometry.
We identified 9 up-regulated proteins, among which heterogeneous nuclear ribonucleoprotein K and glycolytic isoenzyme pyruvate kinase type M2 have already been reported as tumor markers contributing to neoplastic transformation[13,14]. The up-regulation of pyruvate kinase in SaOS-2 cells with respect to the primary osteoblastic cultures reported recently[11] supports our observations.
Among the up-regulated proteins, AHA1 increased most significantly in all 3 OS cell lines when compared to hFOB1.19. It is known that AHA1 stimulates the inherent ATPase cycle of Hsp90 and plays a determining role in Hsp90 client protein binding and activation cycle in vivo[15–17]. AHA1 and its yeast homolog, Hch1, stimulate the ATPase activity and are the first Hsp90 co-chaperones identified with such activity[18], whereas some other co-chaperones of Hsp90 (Hop, Cdc37, p23) has been reported to inhibit ATPase activity[19]. AHA1 appears to be a general upregulator of Hsp90 function rather than a stage-specific co-chaperone due to its ability to coexist in complexes with early but also with late co-chaperones without interfering with binding or their activity[20]. The presence of Hsp90 with high ATPase activity may facilitate malignant tumor progression[21]. Interestingly, we report here for the first time that AHA1 is up-regulated in OS cells compared to normal osteoblastic cells based on comparative proteomics and further verification using Western blot analyses. Because of the crucial role in the activation and stimulation of Hsp90 ATPase which may be essential for tumor cell growth and/or survival under non-optimal environment through activating multiple and overlapping signaling pathways for Hsp90 facilitating the proper folding, maturation, and activity of a number of oncogenic proteins[22], AHA1 may obviously serve as a novel and effective target for OS therapy.
Furthermore, our studies demonstrate that SLP-2 is up-regulated in U2OS and IOR/OS9 cells, but not in SaOS-2 cells. SLP-2 is a novel and unusual stomatin homologue with unknown functions and is ubiquitously expressed at low levels in human organisms[23]. Thus far, the primary structure of SLP-2 is still not completely elucidated and the etiology of increased SLP-2 expression in human cancers is unknown[12,24]. Based on its homology to stomatin, SLP-2 was predicted to be located in the cytoplasm[25]. Zhang et al[12] detected that SLP-2 was overproduced in human esophageal squamous cell carcinoma, lung cancer, laryngeal cancer, and endometrial adenocarcinoma. Transfection with SLP-2 antisense oligonucleotides inhibited tumor cell growth and proliferation. Our findings suggest that SLP-2 might be a potential candidate biomarker of OS, but more information regarding the role of SLP-2 in tumorigenesis needs to be obtained. Other proteins, the levels of which were significantly increased in the 3 selected OS cell lines, also appear to be candidate biomarkers for OS. We also detected 5 other increased proteins, at least in 1 of the 3 OS cell lines selected, including the Fk506-binding protein 4, calponin-3, 60S acidic ribosomal protein P0, adenosylhomocysteinase, and hydroxymethylglutaryl-CoA synthase.
The comparative proteomic analysis also revealed 17 proteins, the production of which was inhibited in OS cells, which may be valuable for understanding the biochemical mechanisms associated with OS tumorigenesis. This group includes plasminogen activator inhibitor 2 precursor, which was detected as being under-expressed, and has been already reported as tumor marker[26].
We detected a remarkable decrease in the level of GSTO-1, SS-A, PAGM, and IFI-78K in all 3 OS cell lines. GSTO-1 exhibits glutathione-dependent thiol transferase and dehydroascorbate reductase activity and influences the age of onset of both Alzheimer’s and Parkinson’s disease[27]. GSTO-1 also plays a role in regulating the intracellular Ca2+ concentration, potentially by protecting cells from radiation damage and apoptosis induced by Ca2+ mobilization from intracellular stores[28]. Marahatta et al[29] demonstrated that polymorphisms within the GSTO gene act as a risk in some cancers. SS-A presents as an independent serum marker in connective tissue disease[30]. SS-A is detected in some patients with esophageal squamous cell carcinoma[31], but its function remains unknown. The level of IFI-78K was significantly decreased in the 3 OS cell lines, and the level of tryptophanyl-tRNA synthetase was decreased in 2 of the detected cell lines, which may be explained by the fact that hFOB1.19 was SV40-transfected cell line. Although this observation has been reported previously[32], it illustrates the usefulness of differential 2-D gel electrophoresis-based proteomics validity.
The level of several proteins belonging to the intermediate filament family (eg cytokeratin-8, cytokeratin-18, and desin) decreased in all 3 OS cell lines. Loss of CK8, CK18, and CK19 is involved in epithelial-mesenchymal transition in human micrometastatic and primary breast carcinoma cells[33]. Furthermore, we observed that the level of some other proteins that are closely related in the intermediate filament family decreased in at least 1–2 of the OS cell lines selected, including macrophage capping protein, ezrin, WD repeat protein 1, plastin-3, and coronin-1B.
In conclusion, a differential proteomic analysis offers the possibility of directly identifying relative protein levels in OS cells with respect to normal osteoblastic cells. Besides the identification of proteins that may play a role in OS tumor development, maintenance, or metastasis, this method is useful in identifying effective biomarkers for OS which will contribute to strategies for early detection, prognosis, and effective intervention. Future studies with more cell lines and primary tumors are required to confirm and supplement these data and to better clarify the role of AHA1 in the Hsp90 system and the possible impact for use in OS therapy.
Acknowledgements
We thank Dr Massimo SERRA (Rizzoli Institute, Bologna, Italy) for kindly providing OS cell lines and Shao-jun LIU, Wei LIU, Li-na WANG, and Xiao-hui HUANG for technical support.
References
- Sandberg AA, Bridge JA. Updates on the cytogenetics and molecular genetics of bone and soft tissue tumors: osteosarcoma and related tumors. Cancer Genet Cytogenet 2003;145:1-30.
- Marina N, Gebhardt M, Teot L, Gorlick R. Biology and therapeutic advances for pediatric osteosarcoma. Oncologist 2004;9:422-41.
- Bielack SS, Kempf-Bielack B, Delling G, Exner GU, Flege S, Helmke K, et al. Prognostic factors in high-grade osteosarcoma of the extremities or trunk: An analysis of 1,702 patients treated on neoadjuvant cooperative osteosarcoma study group protocals. J Clin Oncol 2002;20:776-90.
- Zeindl-Eberhar E, Haraida S, Liebmann S, Jungblut PR, Mayer D, Jager G, et al. Detection and identification of tumor-associated protein variants in human hepatocellular carcinomas. Hepatology 2004;39:540-49.
- Li C, Chen Z, Xiao Z, Wu X, Zhan X, Zhang X, et al. Comparative proteomics analysis of human lung squamous carcinoma. Biochem Biophys Res Commun 2003;309:253-60.
- Johansson B, Pourian MR, Chuan YC, Byman I, Bergh A, Pang ST, et al. Proteomic comparison of prostate cancer cell lines LNCaP-FGC and LNCaP-r reveals heat shock protein 60 as a marker for prostate malignancy. Prostate 2006;66:1235-44.
- An HJ, Kim DS, Park YK, Kim SK, Choi YP, Kang K, et al. Comparative proteomics of ovarian epithelial tumors. J Proteome Res 2006;5:1082-90.
- Afjehi-Sadat L, Shin JH, Felizardo M, Lee K, Slavc I, Lubec G. Detection of hypothetical proteins in 10 individual human tumor cell lines. Biochim Biophys Acta 2005; 1747: 67–80.
- Wolf M, El-Rifai W, Tarkkanen M, Kononen J, Serra M, Eriksen EF, et al. Novel findings in gene expression detected in human osteosarcoma by cDNA microarray. Cancer Genet Cytogenet 2000;123:128-32.
- Atiye J, Wolf M, Kaur S, Monni O, Bohling T, Kivioja A, et al. Gene amplifications in osteosarcoma-CGH microarray analysis. Genes Chromosomes Cancer 2005;42:158-63.
- Spreafico A, Frediani B, Capperucci C, Chellini F, Paffetti A, D’Ambrosio C, et al. A proteomic study on human osteoblastic cells proliferation and differentiation. Proteomics 2006;6:3520-32.
- Zhang L, Ding F, Cao W, Liu Z, Yu Z, Wu Y, et al. Stomatin-like protein 2 is overexpressed in cancer and involved in regulating cell growth and cell adhesion in human esophageal squamous cell carcinoma. Clin Cancer Res 2006;12:1639-46.
- Lynch M, Chen L, Ravitz MJ, Mehtani S, Korenblat K, Pazin MJ, et al. HnRNP K binds a core polypyrimidine element in the eukaryotic translation initiation factor 4E (eIF4E) promoter, and its regulation of eIF4E contributes to neoplastic transforma-tion. Mol Cell Biol 2005;25:6436-53.
- Mazurek S, Boschek CB, Hugo F, Eigenbrodt E. Pyruvate kinase type M2 and its role in tumor growth and spreading. Semin Cancer Biol 2005;15:300-8.
- Panaretou B, Prodromou C, Roe SM, O’Brien R, Ladbury JE, Piper PW, et al. ATP binding and hydrolysis are essential to the function of the Hsp90 molecular chaperone in vivo. EMBO J 1998;17:4829-36.
- Obermann WM, Sondermann H, Russo AA, Pavletich NP, Hartl FU. In vivo function of Hsp90 is dependent on ATP binding and ATP hydrolysis. J Cell Biol 1998;16:901-10.
- Lotz GP, Lin H, Harst A, Obermann WM. Aha1 binds to the middle domain of Hsp90, contributes to client protein activation, and stimulates the ATPase activity of the molecular chaperone. J Biol Chem 2003; 278: 17 228–35.
- Mayer MP, Nikolay R, Bukau B. Aha, another regulator for Hsp90 chaperones. Mol Cell 2002;10:1255-6.
- Stiligardi G, Panaretou B, Meyer P, Singh S, Woolfson DN, Pearl LH, Regulation of Hsp90 ATPase activity by the co-chaperone Cdc37p/p50cdc37. J Biol Chem 2002; 277: 20 151–9.
- Panaretou B, Siligardi G, Meyer P, Maloney A, Sullivan JK, Singh S, et al. Activation of the ATPase activity of Hsp90 by the stress-regulated cochaperone Aha1. Mol Cell 2002;10:1307-18.
- Kamal A, Thao L, Sensintaffar J, Zhang L, Boehm MF, Fritz LC, et al. A high-affinity conformation of Hsp90 confers tumour selectivity on Hsp90 inhibitors. Nature 2003;425:407-10.
- Neckers L. Hsp90 inhibitors as novel cancer chemotherapeutic agents. Trends Mol Med 2002;8:S55-61.
- Wang Y, Morrow JS. Identification and characterization of human SLP-2, a novel homologue of stomatin (band 7.2b) present in erythrocytes and other tissues. J Biol Chem 2000;275:8062-71.
- John JP, Anrather D, Pollak A, Lubec G. Mass spectrometrical verification of stomatin-like protein 2 (SLP-2) primary structure. Proteins 2006;64:543-51.
- Owczarek CM, Treutlein HR, Portbury KJ, Gulluyan LM, Kola I, Hertzog PJ. A novel member of the STOMATIN/EPB72/mec-2 family, stomatin-like 2 (STOML2), is ubiquitously expressed and localizes to HSA chromosome 9p13.1. Cytogenet Cell Genet 2001;92:196-203.
- Hasina R, Hulett K, Bicciato S, Di Bello C, Petruzzelli GJ, Lingen MW. Plasminogen activator inhibitor-2: a molecular biomarker for head and neck cancer progression. Cancer Res 2003;63:555-9.
- Whitbread AK, Masoumi A, Tetlow N, Schmuck E, Coggan M, Board PG. Characterization of the omega class of glutathione transferases. Methods Enzymol 2005;401:78-99.
- Dulhunty A, Gage P, Curtis S, Chelvanayagam G, Board P. The glutathione transferase structural family includes a nuclear chloride channel and a ryanodine receptor calcium release channel modulator. J Biol Chem 2001;276:3319-23.
- Marahatta SB, Punyarit P, Bhudisawasdi V, Paupairoj A, Wongkham S, Petmitr S. Polymorphism of glutathione S-transferase omega gene and risk of cancer. Cancer Lett 2006;236:276-81.
- Peene I, Meheus L, Keyser SD, De-Keyser S, Humbel R, Veys EM, et al. Anti-Ro52 reactivity is an independent and additional serum marker in connective tissue disease. Ann Rheum Dis 2002;61:929-33.
- Kuboshima M, Shimada H, Liu TL, Nomura F, Takiguchi M, Hiwasa T, et al. Presence of serum tripartite motif-containing 21 antibodies in patients with esophageal squamous cell carcinoma. Cancer Sci 2006;97:380-6.
- Roers A, Hochkeppel HK, Horisberger MA, Hovanessian A, Haller O. MxA gene expression after live virus vaccination: a sensitive marker for endogenous type I interferon. J Infect Dis 1994;169:807-13.
- Willipinski-Stapelfeldt B, Riethdorf S, Assmann V, Woelfle U, Rau T, Sauter G, et al. Changes in cytoskeletal protein composition indicative of an epithelial-mesenchymal transition in human micrometastatic and primary breast carcinoma cells. Clin Cancer Res 2005;11:8006-14.