
Real-time detection of α1A-AR movement stimulated by phenylephrine in single living cells1
Introduction
Membrane receptors often play key roles in a large number of physiological and pathophysiological conditions. These receptors are the targets of a large number of therapeutic drugs. Visualizing and tracking receptors stimulated by agonists in living cells will be helpful in understanding the molecular mechanisms of receptor activation. However, by using classic biochemical techniques, it is impossible to investigate receptor movement in single living cells in real time, so it is not enough for the study of receptor regulation. Future research on the dynamic characters of receptor trafficking will enhance not only our understanding of receptors in cellular function, but will also be beneficial for novel drug design and improving treatment of the vast array of receptor-related conditions.
Real-time microscopy with high-tempo resolution is believed to have a great impact in the function of proteins[1]. Recently, single or few molecule detection techniques have made rapid progress in the research of life sciences. These techniques have allowed us to record the behavior of individual particles in real time[2,3]. Since the desensitization and internalization of receptors have been studied in real-time imaging in living cells with minute temporal resolution[4], the challenge now is to investigate the dynamics of receptor movement in real time or rapidly-occurring events in single living cells with millisecond resolution. For this goal, good labeling detection methods are important.
The α1-adrenergic receptors (AR) are members of the G protein-coupled receptor (GPCR) family. The α1-AR play a major role in mediating contraction and growth responses in vascular smooth muscle cells[5]. Three genes encoding unique receptor subtypes, α1A-, α1B-, and α1D-AR, have been cloned and pharmacologically characterized[6]. According to a past investigation, α1A -AR express not only on the cellular surface, but also in the cytoplasm[7]. We then labeled α1A-AR by the use of a monoclonal anti-FLAG(a kind of tag) antibody and Cy3-conjugated goat anti-mouse IgG (Cy3-IgG), and recorded the trajectory of their transport process by the use of high-tempo resolution fluorescence imaging techniques stimulated by agonist, phenylephrine (PE). Using this method, we were able to specifically detect surface receptors and record the behavior of individual particles of receptors with 50 ms exposure time in real time in single living cells. We first obtained trajectories of α1A-AR internalization stimulated by agonist in real time and analyzed its dynamic, which was difficult to explore by use of classic biochemical techniques or laser scanning confocal microscope with minute temporal resolution.
In this study, we developed an approach for labeling the receptors on the living cell surface and tracked the internalized receptors in single living cells by the use of high-tempo resolution fluorescence imaging techniques. This method can provide new insights into the investigation of mechanisms and dynamic properties of receptor transport.
Materials and methods
Cell culture, transfection, and selection of stably-expressed cells FLAG-tagged human α1A-AR in the pDoubleTrouble vector (pDT; α1A-AR/pDT) was kindly provided by Prof Kenneth P. MINNEMAN (Emory University, Atlanta, GA, USA). The human embryonic kidney 293A cells (HEK293A) were propagated in DMEM(Dulbecco’s Modified Eagle’s Medium) (Invitrogen, Carlsbad, CA, USA) with 10% (v/v) fetal bovine serum (FBS) at 37 ℃ in a 5% CO2 environment. Using Lipofectamine 2000 transfection reagent (Invitrogen, Carlsbad, CA USA) according to the manufacturer’s recommendations, the cells were transfected with an α1A-AR constructor for 24 h. Cells stably expressing α1A-AR were selected with 800 µg/mL G418 (Sigma, St Louis, MO, USA), and the expression of α1A-AR was determined by radioligand binding assays as indicated previously[8]. HEK293A-α1A cells were plated at a density of 1×10⁵ cells/mL on coverslips and maintained in DMEM with 10% FBS for 1–2 d before the experiments.
Living cell labeling by Cy3-IgG Living cells were incubated for 10 min at 37 ℃ in an anti-FLAG monoclonal antibody (12.5 µg/mL, Sigma, USA) and Cy3-IgG (3.75 µg/mL, dye/protein ≈3.9; Jackson ImmunoResearch, West Grove, PA, USA), sequentially. Before the fluorescence experiments, the cells were washed in PBS (pH 7.4) 3 times.
Calcium response To detect the response to PE by HEK293A-α1A cells, Fluo-3 (Molecular Probes Inc, Eugene, OR, USA) was used to indicate the increase of calcium signal with PE stimulation. The cells were incubated with medium containing 4 µmol/L Fluo-3 for 60 min at 37 ℃ before the experiments. After washing 3 times with PBS, the cells were observed by the epi-fluorescence microscope. PE 10 µmol/L was added as a PE pulse, and at the same time, the fluorescence from Fluo-3 was detected. The microscope system used to measure Fluo-3 fluorescence was the same that was used for the epi-flourescence imaging, and a 488 nm laser beam (Model 163C, Spectra-Physics, Millennia IIs USA), a ×40 objective (NA=0.6, Nikon, Tokyo, Japan), and a dichroic mirror (505 nm long-pass, Chroma Technology, Rockingham, VT, USA) were used. The emission fluorescence through a 535/50 nm band-pass filter was collected by the same CCD(Charge Coupled Device).
Drug treatments To study the internalization of α1A-AR under PE stimulation, the cells were incubated with medium containing 10 µmol/L PE (Sigma, USA) for 20 min before the experiments. The concentration of PE was maintained in the cell culture throughout the experiments or PE was added to the cultures transiently during observation.
Immunofluorescence Living HEK293A-α1A cells were incubated for 10 min at 37 ℃ in an anti-FLAG monoclonal antibody (12.5 µg/mL, Sigma, USA) and FITC(Fluorescein isothiocynate)-conjugated goat anti-mouse IgG (Jackson ImmunoResearch, USA), sequentially. Then the cells were incubated with medium containing 10 µmol/L PE (Sigma, USA) for 20 min. After that, the cells were fixed for 15 min in 4% paraformaldehyde in PBS and permeabilized with 0.2% Triton X-100. Following washes with PBS, the cells were incubated with TRITC (Tetramethyl Rhodamine Isothiocyanate)-labeled phalloidin (Sigma) for 25 min and then washed and mounted in Vectashield (Vector Laboratories, Burlingham, CA, USA). Images were acquired using a confocal laser-scanning microscope.
Laser confocal microscopy The samples were imaged with a Spectra-Physics (USA) laser scanning confocal microscope with a Plan-Apo ×60 oil immersion objective lens (Leica, Wetzlar, Germany). The software used to collect the images was the Leica TCS NT, version 1.6.587 (Germany). The images were transferred to a computer for reduction and analysis with Adobe Photoshop version 4.0 (Adobe Systems, Mountain View, CA, USA). The setting on the laser was constant for all experiments. However, both FITC and TRITC signals were digitally enhanced by adjusting the photomultiplier tube (PMT). The initial adjustment of the PMT allowed us to minimize the background signal while maximizing the fluorescent signals of interest.
Epi-fluorescence imaging The cells were excited with a 532 nm laser beam (Millennia IIs, Spectra-Physics, USA) which was reflected to the sample by a dichroic mirror (575 nm long-pass, Chroma Technology, USA). The fluorescent emission from Cy3 was collected by a ×100 objective (NA= 1.40, oil, Nikon, Japan) and mounted on an inverted fluorescence microscope (TE300, Nikon, Japan). Through a 605/40 nm band-pass filter or a long-pass 565 nm filter (Chroma Technology, USA), the scattering light was blocked and Cy3 fluorescent images were obtained with a back-illuminated, frame-transfer CCD (Cascade 512B, Roper Scientific, Tucson, Arizona, USA). By using only part of the CCD, the frame rate could be increased and we successfully measured high quality point-spread functions at 50 ms time resolution. Image acquisition, storage, and display were performed using MetaView software (Universal Imaging Co, Downingtown, PA, USA) and WinView32 software (Roper Scientific, USA). The whole observation was conducted at room temperature.
Image analysis Each complex of α1A-AR and labeling antibody forms a diffraction-limited image. The pixel data of each spot was least-squares fitted by a 2-D Gaussian function to obtain the center value[9] with a precision less than 10 nm[10]. The whole fitting was via a user-defined program in Matlab (MathWorks Inc., Natick, MA, USA).
Statistical analysis Data are given as mean±SEM of at least 3 individual experiments. Comparisons between means were performed by using Student’s t-test with SPSS software (SPSS Inc., Chicago, IL, USA).
Results
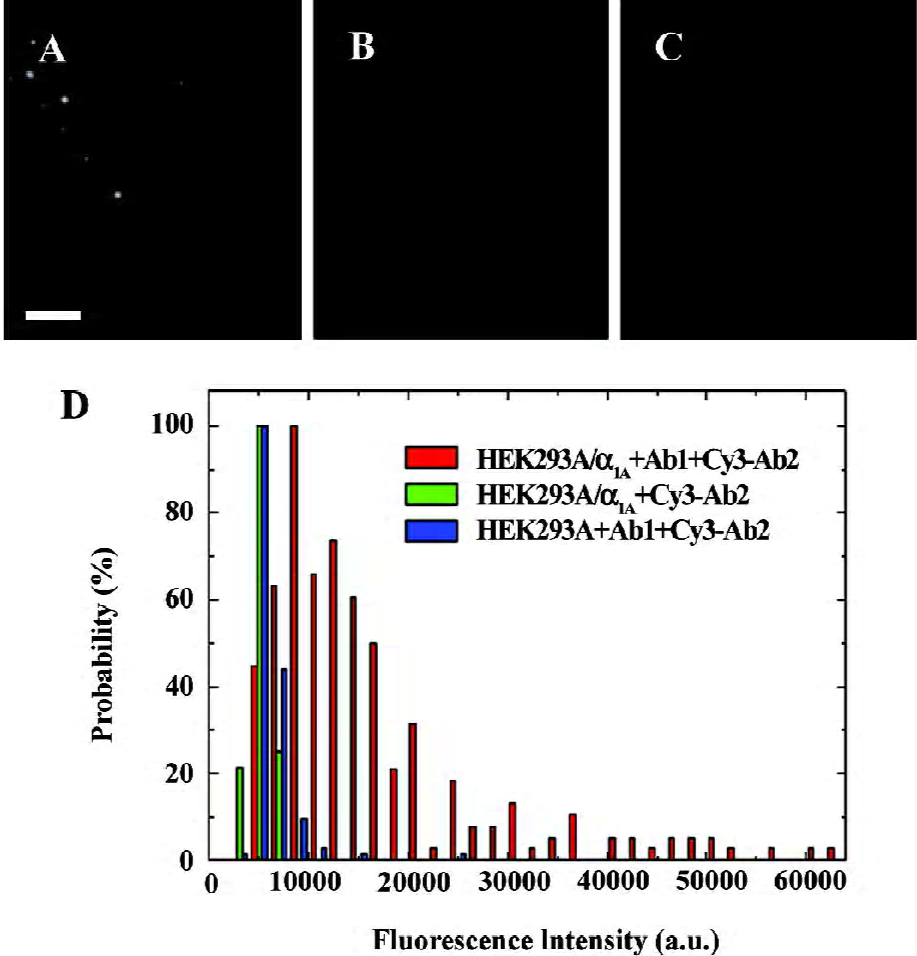
α1A-AR were labeled specifically on the surface of living cells The specific detection of α1A-AR on the surface of living HEK293A-α1A cells was achieved by the use of a monoclonal primary antibody and Cy3-IgG (Figure 1A). Each complex of α1A-AR and labeling antibody forms a diffraction-limited image. The individual spots are the images of the complex of α1A- AR and labeling antibody on the cell surface, and each spot may contain more than 1 α1A-AR. Under the same brightness, the unspecific adsorption of the primary antibody and Cy3-IgG in HEK293A cells (Figure 1B), and without the primary antibody, the unspecific adsorption of Cy3-IgG in HEK293A-α1A cells (Figure 1C) were very low. The histograms of the different fluorescence intensity are shown in Figure 1D, among which, α1A-AR labeled specifically by the primary antibody and Cy3-IgG in living HEK293A-α1A-cells are shown in red, the unspecific adsorption of the primary antibody and Cy3-IgG in HEK293A cells are shown in blue, and without the primary antibody, the unspecific adsorption of Cy3-IgG in HEK293A-α1A cells is shown in green (Figure 1D). So by this method, we can specifically label the receptors on the living cell surface.
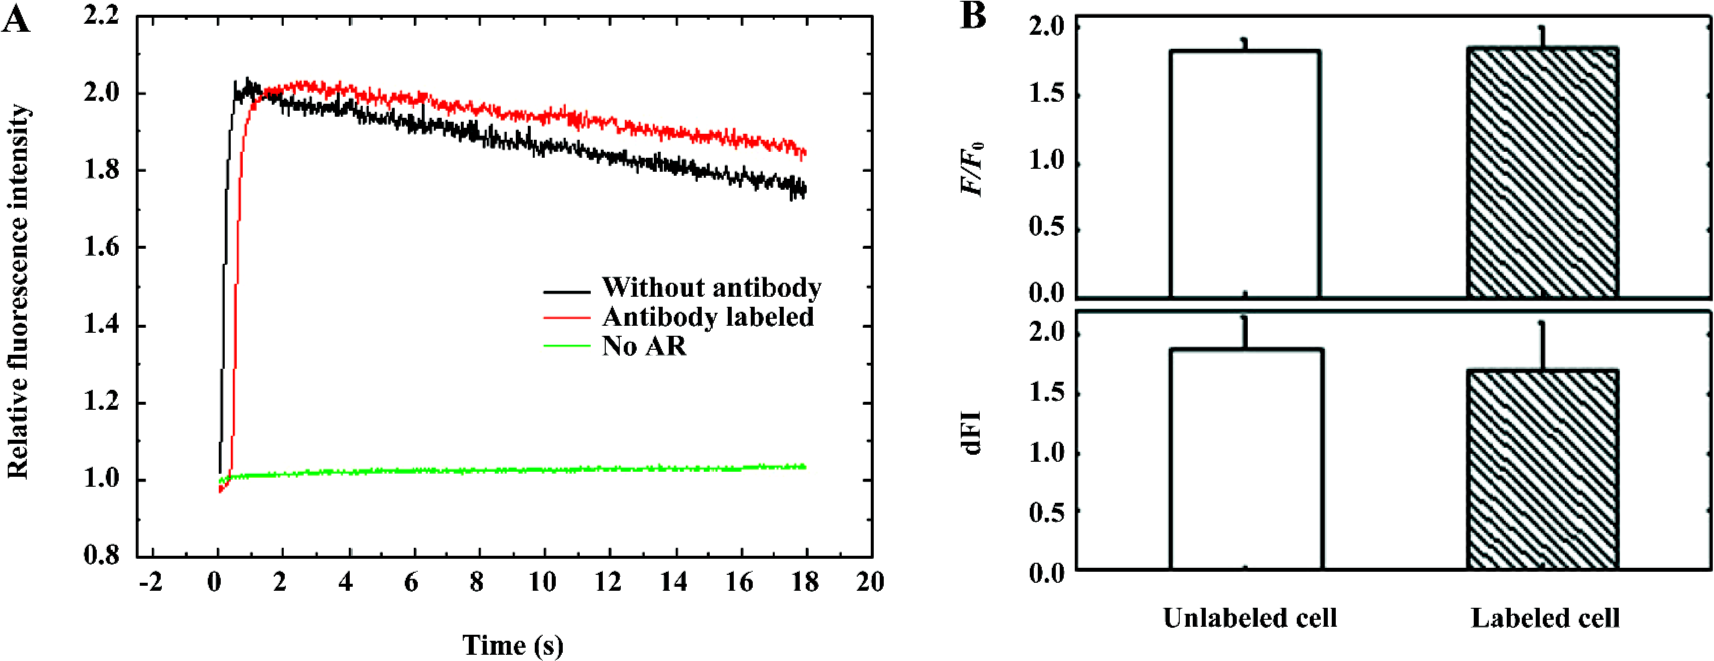
Labeling with the antibody does not affect the activity of α1A-AR To check the biological activity of α1A-AR after labeling with the antibody, 10 µmol/L PE was added to label HEK293A-α1A cells to induce a calcium response which was indicated by Fluo-3 (Figure 2A). Two Ca2+ transient charac-teristics, the amplitudes of Ca2+ transient increase (presented as a ratio of fluorescence/background fluorescence, F/F0), and the rate of the Ca2+ transient upstroke rise (presented as the change of relative fluorescence intensity per second, dFI), are obtained from the initial time course of Fluo-3 fluorescence increase in whole cells. Three independent experiments were measured individually with 20 ms exposure time per frame. The F/F0 of labeled cells was 1.86±0.15, and that of unlabeled cells was 1.83±0.07 (mean±SEM). The dFI of labeled cells and unlabeled cells were 1.70±0.41 and 1.88± 0.26 (mean±SEM), respectively (Figure 2B). These data demonstrate that labeling with the antibody does not affect the activity of α1A-AR.
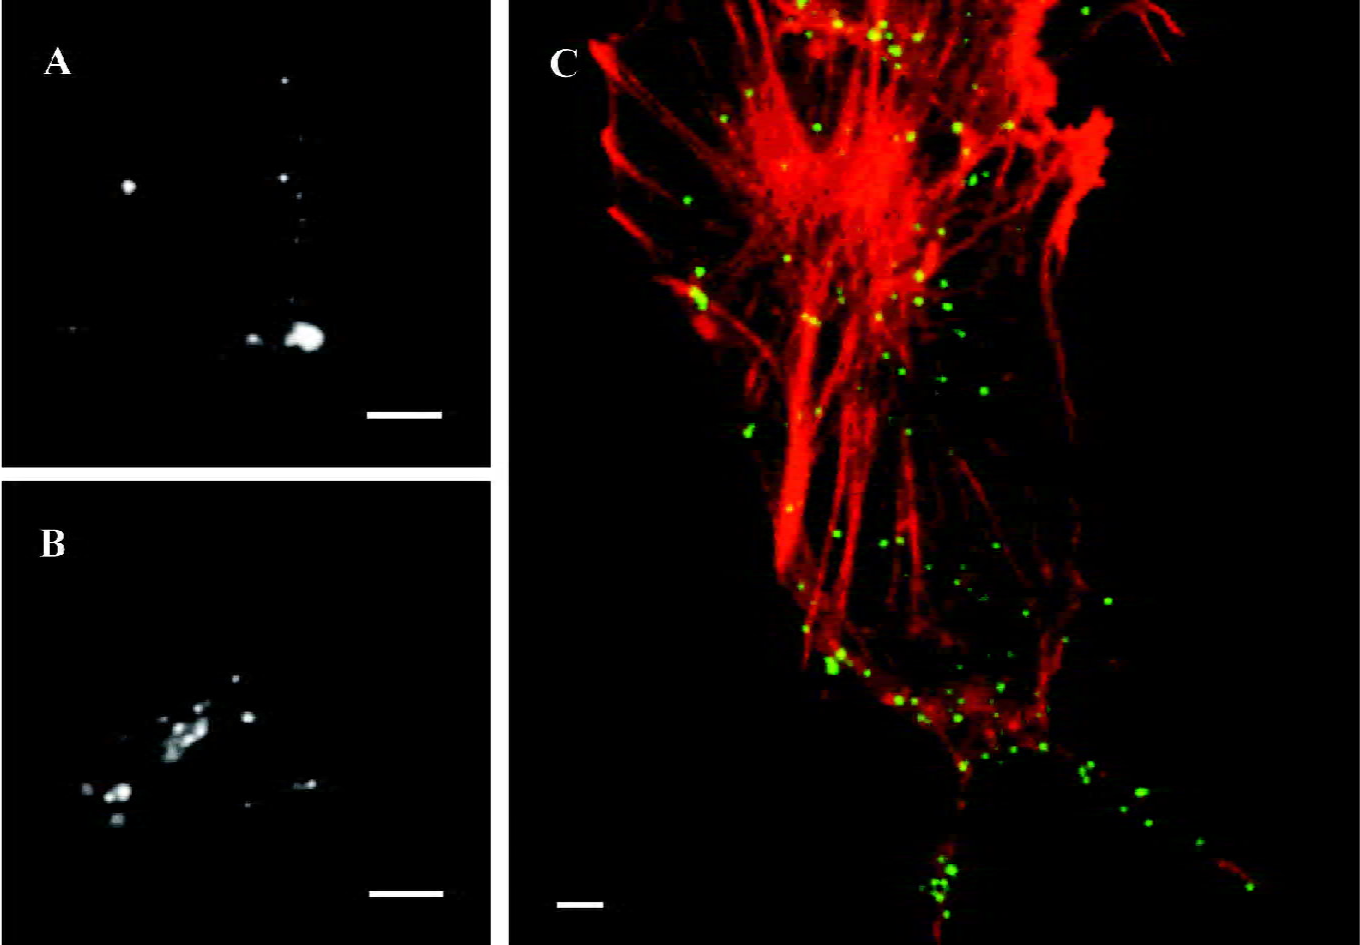
α1A-AR internalize under stimulation of agonist, PE With the extrinsic fluorescence labeling method, we monitored individual HEK293A-α1A cells by epi-fluorescence microscopy. After incubation with PE for 20 min, part of the particles appeared within the cells (Figure 3B). On the contrary, if there was a lack of PE stimulation, the fluorescence spots indicated that α1A-AR stayed on the cell surface after the cells were immersed in DMEM for 20 min (Figure 3A). To estimate the ratio of internalized α1A-AR against total α1A-AR, we counted the number of intracellular fluorescent spots versus the number of whole spots in a focus plane among 39 cells that exhibited internalization from 7 separate experiments. The ratio of α1A-AR internalization within 20 min was 41%±14%. By laser confocal microscopy, we observed that living HEK293A-α1A cells were labeled with FITC-IgG (green) and the F-actins were labeled with TRITC-phalloidin (red). After the cells were stimulated with PE for 20 min, apparent colocalization was found between α1A-AR and F-actins (Figure 3C).
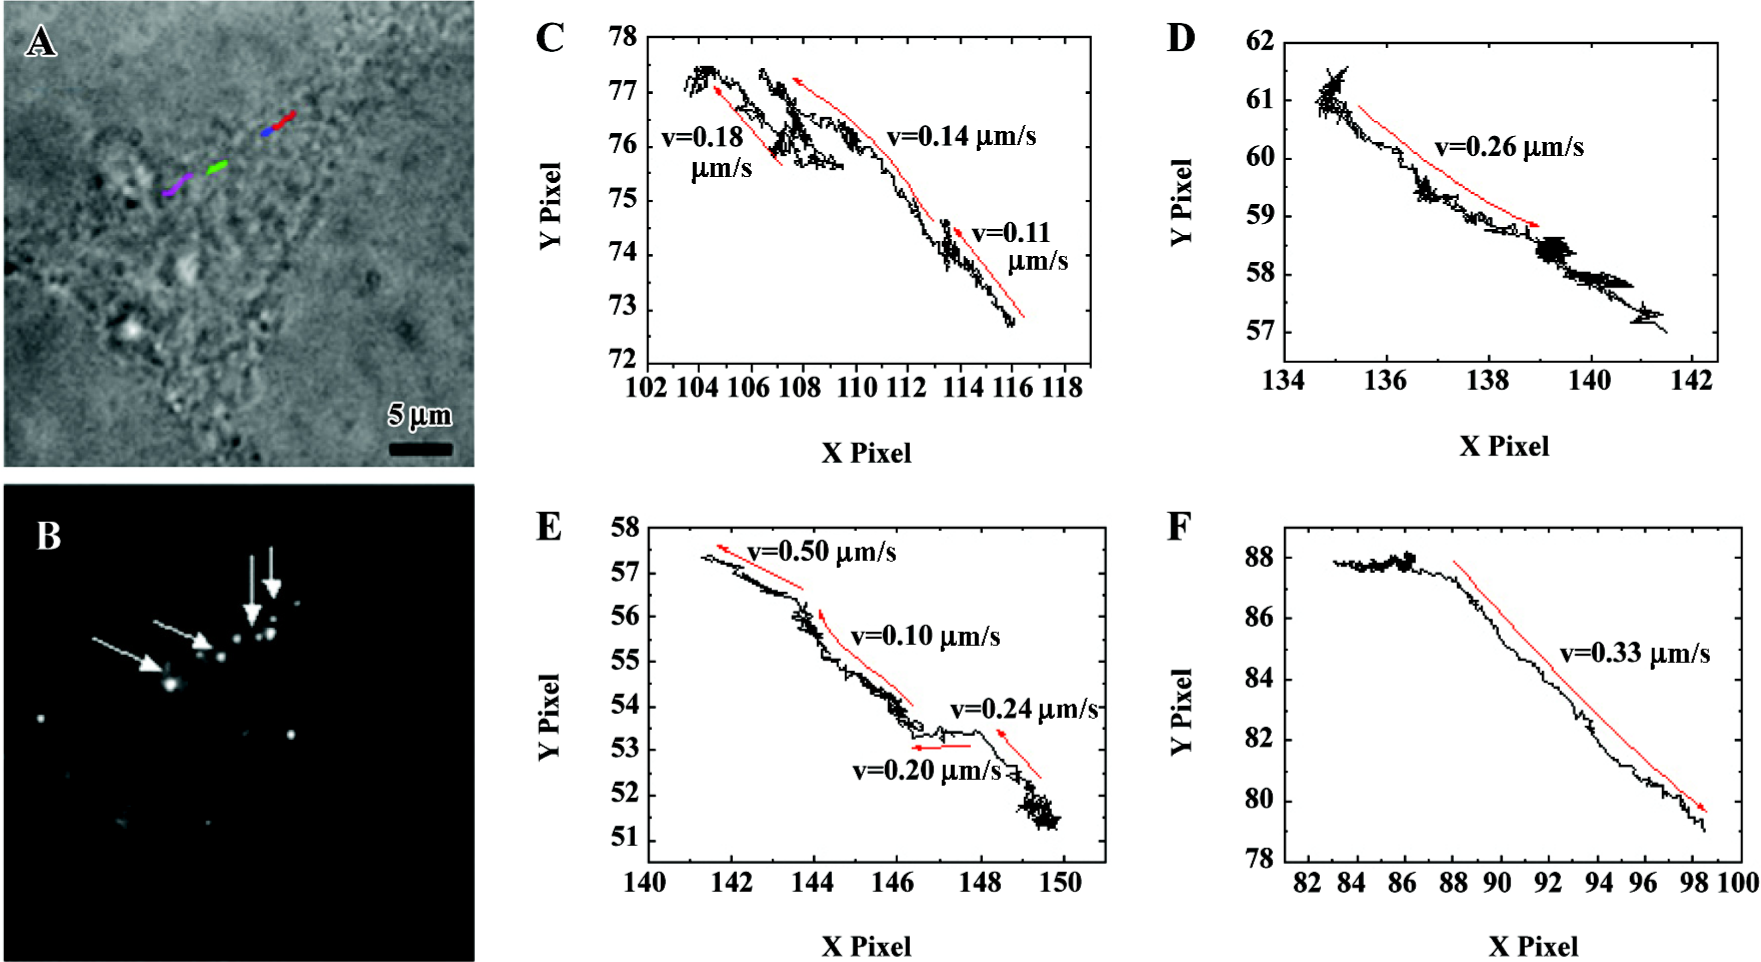
Tracking of α1A-AR stimulated by PE in single living cells in real time An analysis of α1-AR trajectories in cells in response to PE provides information about the dynamic properties and mechanisms of receptor transport. To measure the displacement of α1-AR in living cells, 50 ms exposure time of stack frames was chosen and a 7×7 pixel array of each diffraction-limited spot was fitted to a 2-D Gaussian peak to increase precision of spatial localization[9]. After 40 min stimulation of 10 μmol/L PE, trajectories of approximate linear motion in HEK293A-α1A (Figure 4) cells were recorded. The 4 different colored lines in Figure 4A indicate the representative trajectories. The arrows in Figure 4B indicate the beginning points of the representative trajectories. To display the details of displacement of the labeled α1A-AR, we enlarged the trajectory plots of HEK293A-α1A cells (Figure 4C–4F). For all the trajectories of active transport, the velocity of the representative α1-AR trajectories was from 0.10 to 0.50 µm/s, as shown in Figure 4.
Discussion
The primary antibody and secondary antibody have been well used in classic biochemical experiments, such as Western blotting and ELISA. However, this method has been seldom used in the research of single living cells. Here we developed this method for tagging living cell surface proteins with extracellular tags within a total labeling time as short as 10 min at 37 ℃. We incorporated a FLAG tag which is a short peptide sequence (8 amino acids) into α1A-AR extracellular domains. Using this labeling method, we not only recorded the trajectories in the course of internalization of receptors in real time, but also analyzed the dynamic properties of α1A-AR stimulated by PE. This method can provide some new insights into the investigation of mechanisms and dynamic properties of receptor transport. Along with the diverse forms of commercially-available, labeled antibodies, this method of tagging membrane receptors is a very versatile approach that can be generally applicable to membrane proteins.
It is known that GPCR signaling is tightly regulated by a series of cellular proteins that promote receptor desensitization and internalization[11]. In an early study performed in HEK293 cells with a transient transfection of α1A-AR/GFP (Green Fluorescent Protein), the analysis of the increase of intracellular fluorescent intensity suggests that the significant internalization of α1A-AR occurs under stimulation of agonist PE after 20 min[12]. However, the authors could not distinguish the internalized receptors from the intracellular α1A-AR/GFP because it is very hard to distinguish intracellular pools of GFP-tagged membrane proteins from extracellular pools in living cells, so the internalization process of α1A-AR could not be investigated directly. It is also difficult for tracking single GFP particles in living cells because the intensity of GFP fluorescence is too weak to detect single GFP molecules. Auto-fluorescence of the living cell also increases the difficulty of detecting the single GFP molecule. Here we developed an approach for labeling the receptors on the living cell surface and for tracking the internalized receptors in living cells. With this approach, we were able to investigate the dynamics of receptor movement in real time or rapidly-occurring events in living cells with a millisecond resolution. The labeling is restricted to cell surface proteins because the antibody is not permeable through the cell membrane. By this method, we were able to specifically detect surface receptors, and it was concluded from the coherence of the calcium response among the labeled cells and control that the labeling with the antibody did not impair the receptors’ activity. So this kind of specific labeling method, which labels the receptors on the living cell surface, can provide a convenient means in the real-time detection of the behavior of receptors.
Furthermore, using this labeling method, we recorded the trajectories in the course of internalization of receptors in real time. The ratio of α1A-AR internalization within 20 min was 41%±14% (mean±SD). This result is a little higher than Chalothorn’s study mentioned above[12]. The difference between the 2 experiments could be explained by the different labeling methods. α1A-AR localize not only on the cell surface, but also intracellularly[7]. The internalized α1A-AR/GFP cannot be distinguished from the intracellular or newly-produced α1A-AR/GFP as in previous studies. Thus, the newly-produced α1A-AR/GFP and the α1A-AR/GFP transported to the membrane may interrupt the detection of internalization quantity. On the contrary, the extrinsic labeling we used could avoid the influence of intracellular α1A-AR and reduce the interference from the cell metabolism[2].
An analysis of α1-AR trajectories in cells in response to PE provides information about the dynamic properties, and we can even study the mechanisms of receptor transport. Stimulated with 10 µmol/L PE for 20 min, apparent colocalization was found between α1A-AR and F-actin, which was observed by laser confocal microscopy (Figure 3C). It indicated that the internalization of α1A-AR was closely related to the cytoskeleton. After 40 min stimulation of 10 µmol/L PE, trajectories of approximate linear motion in HEK293A-α1A cells were recorded. We can calculate the velocity of the representative α1-AR trajectories which ranged from 0.10 to 0.50 µm/s. So using this labeling method, we can not only record the trajectories in the course of internalization of receptors in real time, but also analyze the dynamic properties of α1A-AR. In this research, we first obtained trajectories of α1-AR internalization stimulated by an agonist in real time that was difficult to explore by using classic biochemical techniques or a laser scanning confocal microscope with minute temporal resolution.
In conclusion, the specific labeling method of the living cell surface provides a convenient means of real-time detection of the behavior of surface receptors. By this method, we were able to specifically detect α1-AR, record the behavior of individual particles of receptors within 50 ms exposure time in real time in single living cells, and analyze its dynamic properties. This work can provide some new insights into the investigation of mechanisms and dynamic properties of receptor transport.
References
- Weiss S. Fluorescence spectroscopy of single biomolecules. Science 1999;283:1667-95.
- Seisenberger G, Ried MU, Endress T, Buning H, Hallek M, Brauchle C. Real-time single-molecule imaging of the infection pathway of an adeno-associated virus. Science 2001;294:1929-32.
- Lakadamyali M, Rust MJ, Babcock HP, Zhuang X. Visualizing infection of individual influenza viruses. Proc Natl Acad Sci USA 2003;100:9280-5.
- Price RR, Morris DP, Biswas G, Smith MP, Schwinn DA. Acute agonist-mediated desensitization of the human α1a-adrenergic receptor is primarily independent of carboxyl terminus regulation: implications for regulation of α1a-AR splice variants. J Biol Chem 2003;277:9570-9.
- Piascik MT, Perez DM. Alpha1-adrenergic receptors: new insights and directions. J Pharmacol Exp Ther 2001;298:403-10.
- Graham RM, Perez DM, Hwa J, Piascik MT. alpha 1-Adrenergic receptor subtypes. Molecular structure, function, and signaling. Circ Res 1996;78:737-49.
- Hirasawa A, Sugawara T, Awaji T, Tsumaya K, Ito H., Tsujimoto G. Subtype-specific differences in subcellular localization of α1-adrenoceptors: Chlorethylclonidine preferentially alkylates the accessible cell surface alpha(1)-adrenoceptors irrespective of the subtype. Mol Pharmacol 1997;52:764-70.
- Zhang YY, Xu KM, Han CD. α1-Adrenoceptor subtypes mediating inotropic responses in rat heart. J Pharmacol Exp Ther 1999;291:829-36.
- Cheezum MK, Walker WF, Guilford WH. Quantitative comparison of algorithms for tracking single fluorescent particles. Biophys J 2001;81:2378-88.
- Thompson RE, Larson DR, Webb WW. Precise nanometer localization analysis for individual fluorescent probes. Biophys J 2002;82:2775-83.
- Lefkowitz RJ. New roles for receptor kinases and beta-arrestins in receptor signaling and desensitization. J Biol Chem 1998; 273: 18 677–80.
- Chalothorn D, McCune DF, Edelmann SE, Garcia-Cazarin ML, Tsujimoto G, Piascik MT. Differences in the cellular localization and agonist-mediated internalization properties of the α1-adrenoceptor subtypes. Mol Pharmacol 2002;61:1008-16.