
Pharmacokinetic-pharmacodynamic modeling of telmisartan using an indirect response model in spontaneously hypertensive rats1
Introduction
The renin-angiotensin-aldosterone system (RAAS) is a direct contributor to both hypertension and the associated pathological changes that develop in the heart and vasculature. Angiotensin II (Ang II), a multi-functional hormone and major effector molecule of the RAAS, has a pivotal role in regulating extracellular volume and vascular resistance[1,2]. Telmisartan inhibits AT1 receptor selectively and inconvertibly, which is used for treatment of hypertension without action on other receptor, especially those in the cardiovascular system. Its efficacy, tolerability, and clinical uses are reviewed in several reports[3–5]. In humans, telmisartan 40 mg provided rapid-onset, well-tolerated, and certain inhibition of Ang II-induced hypertension, with maintenance of the inhibitory effect for 48 h[6].
In recent years, the pharmacokinetic (PK) and the pharmacodynamic (PD) properties of telmisartan have been reported[7]. It is evident that telmisartan resides in the plasma for a long time and has a slow dissociation rate from the AT1 receptor, which extends the occupancy time of the receptor protein and duration of action. However, very little information is available on the relationship between PK and PD of telmisartan. For antihypertensive agents, a suitable relationship of dose-concentration-effect is helpful for clinical application. A proper PK-PD model has made it possible to predict the time course of plasma concentration and the intensity of the pharmacological effect just based on clinical dosage. In this study, a PK-PD model based on the hypotensive mechanism of telmisartan was proposed in spontaneously hypertensive (SH) rats after oral drug administra-tion. The objective of the current report was to resolve the PK and the PD characteristics of telmisartan.
Materials and methods
Chemicals and animals Telmisartan and candesartan were supplied by the Department of Pharmaceutical Analysis of China Pharmaceutical University (Nanjing, China). Acetonitrile (Merck Corporation, Darmstadt, Germany) was of HPLC grade, and all other reagents were of analytical grade. Male SH rats (200–230 g) were obtained from Beijing Vitalriver Experiment Animal Corporation (Beijing, China). The animals were kept on a 12 h light/dark cycle for a minimum of three days before the experiments with free access to water and a standard diet. The studies were approved by the Animal Ethics Committee of China Pharmaceutical University.
Animal study Twenty male SH rats with systolic blood pressure (SBP)>200 mmHg, diastolic blood pressure (DBP)>150 mmHg were randomized into one control and three experimental groups for oral administration of 2, 4, and 8 mg/kg of telmisartan. At 0, 0.5, 1, 2, 3, 4, 6, 8, 12, 24, 48, 72, and 96 h after administration, blood pressure was measured by tail-cuff manometry (BESN-II BioSystems, Nanjing, China), and the blood samples (0.2 mL) were collected by puncture of retro-orbital sinus simultaneously.
Drug assay The quantitative analysis of telmisartan, according to the established method with little modifications[8], was performed using a Shimadzu HPLC/ESI/MS 2010 EV system (Shimadzu Corporation, Kyoto, Japan) with a Shim-pack C18 column (150×2.0 mm ID, 5 μm, Shimadzu, Japan). The mobile phase was acetonitrile-5 mmol/L ammonium acetate (50:50, v/v), and the column temperature was maintained at 40 ºC. A constant mobile phase flow rate of 0.2 mL/min was employed throughout the analyses. Target ions were monitored at m/z 515.1 for telmisartan and m/z 611.1 for candesartan (internal standard) in the positive ion-selected ion-monitoring mode. The samples were prepared as follows: 50 μL plasma samples together with 10 µL (2 µg/mL) internal standard were mixed after vortex shaking; 4 mL of ether was added and the mixture was vortexed for 3 min. After centrifugation at 1500×g for 10 min, the upper organic layer was quantitatively transferred and evaporated to dryness using an evaporator at 50 ºC. The residue was reconstituted in 100 μL of the mobile phase, and a 10 μL aliquot of the solution was injected into the HPLC/ESI/MS system for analysis. Under these conditions, the method was also validated according to the requirement of the biopharmaceutical analysis. The limit of quantitation for telmisartan was 2 ng/mL; at this concentration the accuracy was 92.9% while precision was 12.7%. During validation, within-batch accuracy ranged from 91.5% to 112.0%, while within-batch precision remained below 10.6%. The between-batch accuracy was between 94.6% and 109.1%, while precision remained below 13.7%. Short-term stability showed that telmisartan was stable in plasma for at least 16 h at room temperature, while long-term stability studies showed that telmisartan was stable in plasma for at least 7 d when stored at -20 ºC.
Pharmacokinetic analysis The PK parameters were estimated by the BAPP2.3 software package (Nanjing, China). The terminal half-life (t1/2) was determined by linear regression of the terminal elimination of the plasma concentration. The mean residence time (MRT) was calculated by a moment method. The area under the plasma concentration-time curve from 0 to the last measurable plasma concentration point (AUC0–τ) was calculated by the linear trapezoidal method. Extrapolation to time infinity (AUC0–∞) was calculated as follows: AUC0–∞=AUC0–τ+Ct/ke. The maximum drug plasma concentration (Cmax) and the time to reach the maximum concentration (Tmax) were taken directly from the observed data. According to the observed data, the hypotensive curve was fitted using a nonlinear least-squares regression analysis after oral doses.
Pharmacodynamic analysis Microsoft Excel software (Microsoft, Redmond, WA) was used to develop the algorithm[10]. The hypotensive effect was assessed by measurement of SBP and DBP, and then the mean arterial blood pressure (MABP) was evaluated as follows: MABP=DBP+(SBP-DBP)/3. The relationship between the plasma concentration and pharmacological effect was quantified by a physiological indirect effect model that was similar to the indirect suppression model proposed by Dayneka et al[9]. The diagram of the model is shown in Figure 1.
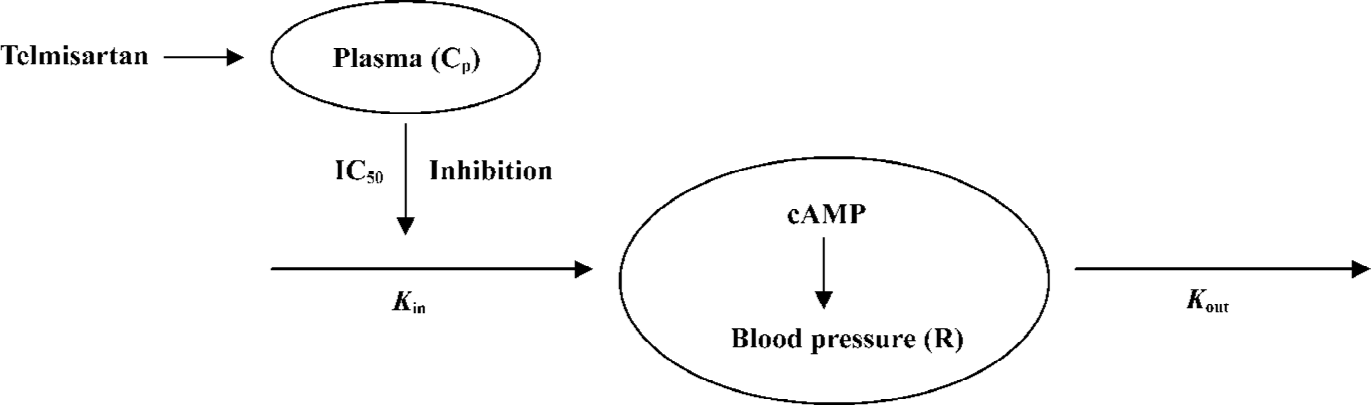
The PD modeling was based on a scheme that blood pressure was produced with a zero-order input rate constant (Kin) and dissipated with a first-order output rate constant (Kout). Telmisartan inhibited the input rate of production (Kin), thus, the effect of telmisartan was modeled as an inhibitory factor of input rate, and the changes of blood pressure in SH rats can be expressed as:
The response variable (R) begins to a predetermined baseline value (R0), changes with time following drug administration, and eventually returns to R0. Thus, R0=Kin/Kout, where IC50 is the concentration which yielded 50% effect of the maximum inhibition effect. The effect compartment model uses a modified Emax model to calculate the PK-PD parameters[11]. An equation of the modified Emax model is:
The goodness of fitting are determined by the Akaike’s information criterion (AIC) values.
Statistical analysis The statistical difference of PK and PD parameters at three doses was tested by ANOVA.
Results
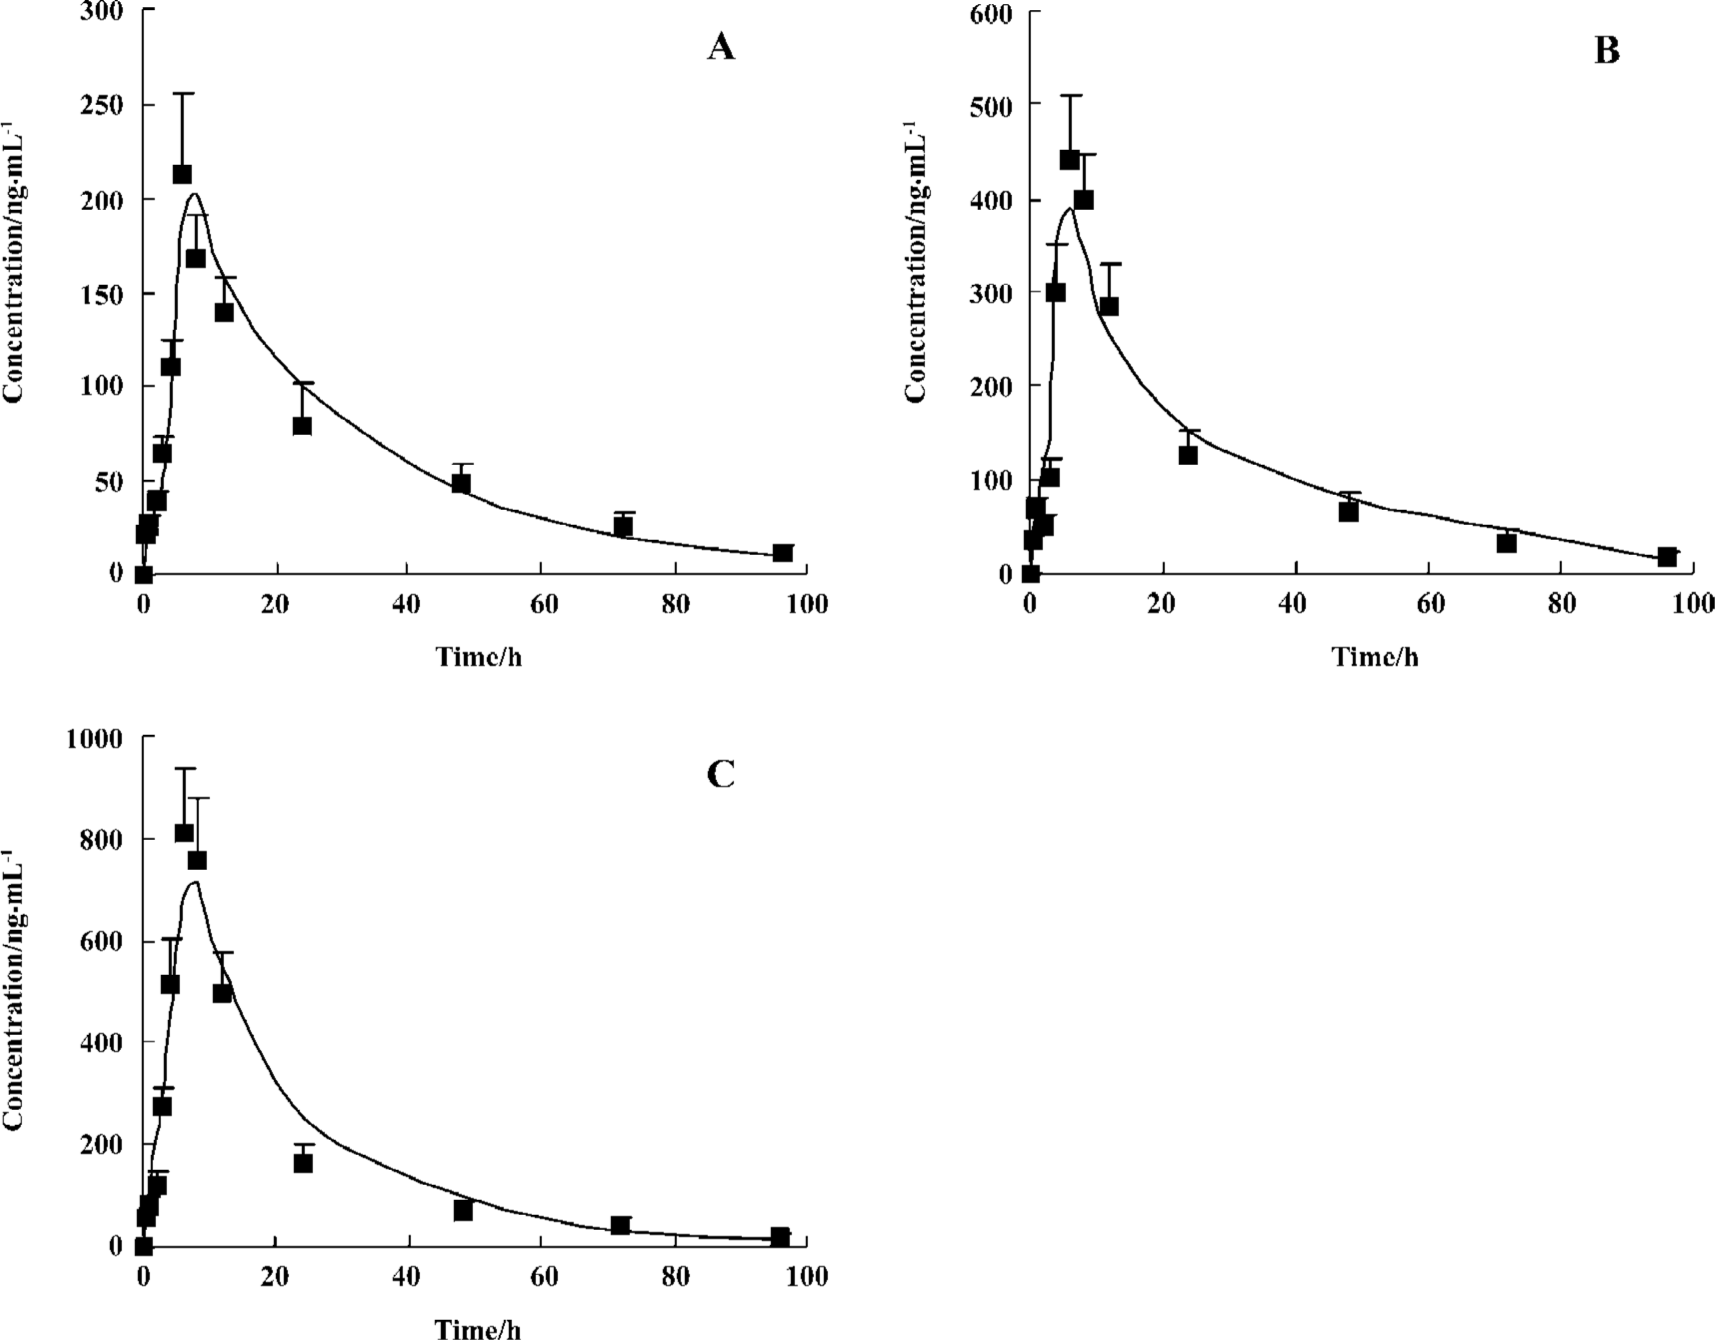
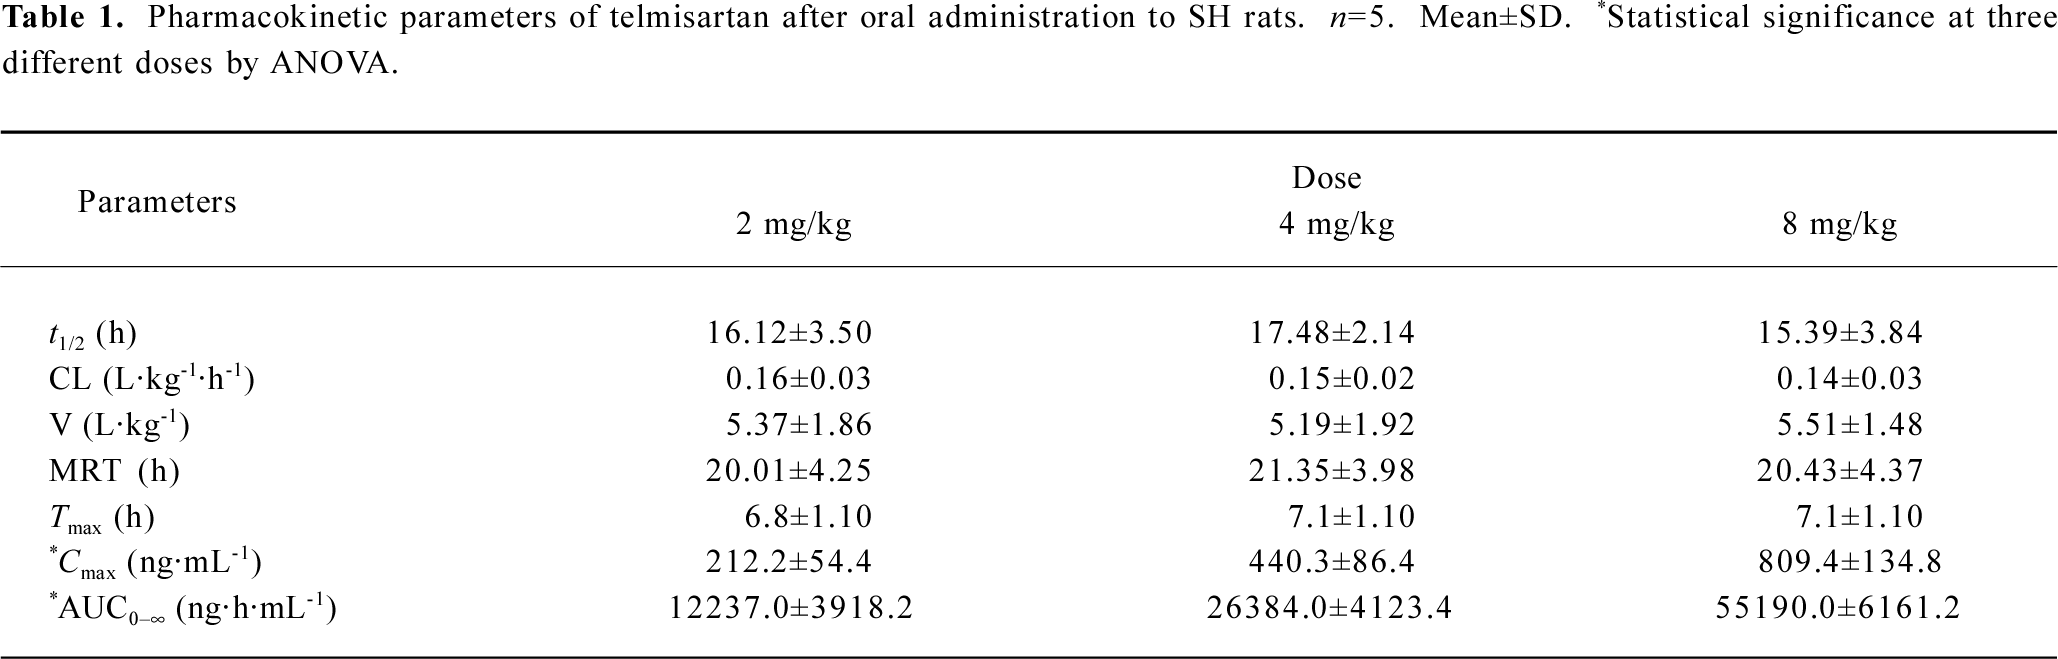
Pharmacokinetics The plasma concentration-time profiles of telmisartan after oral administration were shown in Figure 2, and the PK parameters were summarized in Table 1. The analysis of variance of the t1/2 and clearance (CL) showed no differences (P>0.05), while the AUC had significant differences among the three doses of treatments after oral administration (P<0.05). These results indicated that t1/2 and CL did not vary with doses. The AUC increased with increasing doses for oral administration, and the regression analysis of the AUC-dose plot indicated good linearity (r>0.98).
Full table
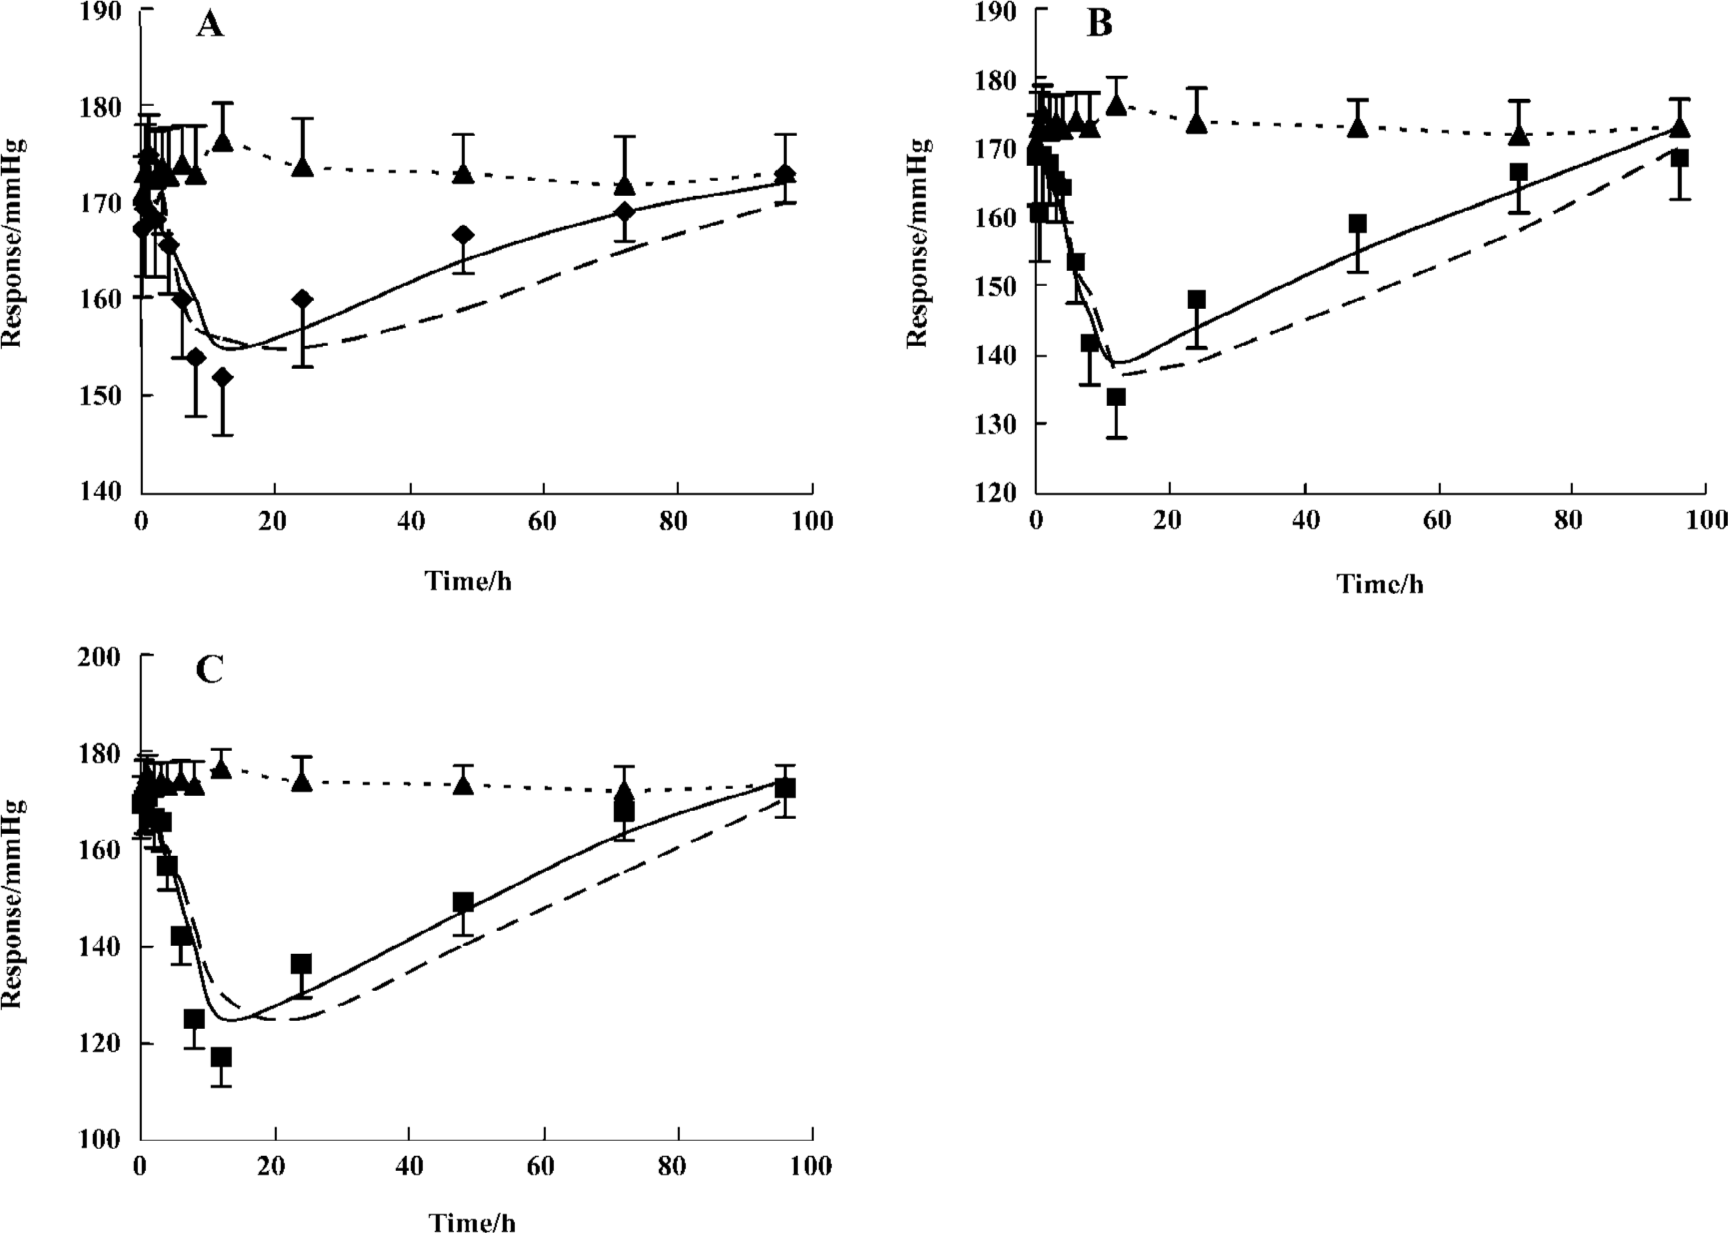
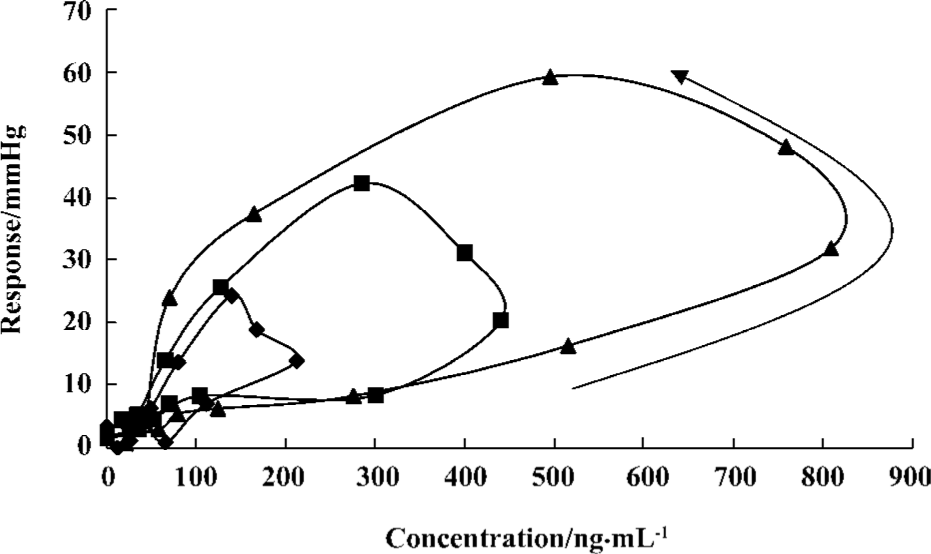
Pharmacodynamics The observed and fitted hypotensive effects by various PK-PD models after oral administration were displayed in Figure 3. Telmisartan caused a slow onset and marked reduction of blood pressure at three experimental doses. Blood pressure levels were lowered by 13.4%±4.0%, 23.5%±6.3%, and 33.2%±5.8% of the basal levels after doses of 2, 4, and 8 mg/kg respectively. The analysis of variance of the hypotensive effect showed statistical differences among the three doses of treatments after oral administration (P<0.05). The hypotensive effects rose to a peak at 12 h and were still observed at 72 h. Blood pressure returned to baseline at 96 h at all doses. As shown in Figure 4, the peak level of hypotensive effects occurred later than the plasma peak concentration, indicating a delay in eliciting the pharmacological effect. The PK-PD parameters simulated by the indirect response model and effect-compartment model at three different doses were shown in Table 2. The determined AIC values for the indirect response model were lower than those for the effect-compartment model at three dose levels, respectively. This suggested that the indirect response model was more adequate for the PK-PD modeling of telmisartan than the effect-compartment link model. The analysis of variance of AUEC showed statistical analysis at three doses in two models. There was no significant difference in the other parameters at different dose levels, which suggested that these parameters were dose-independent.
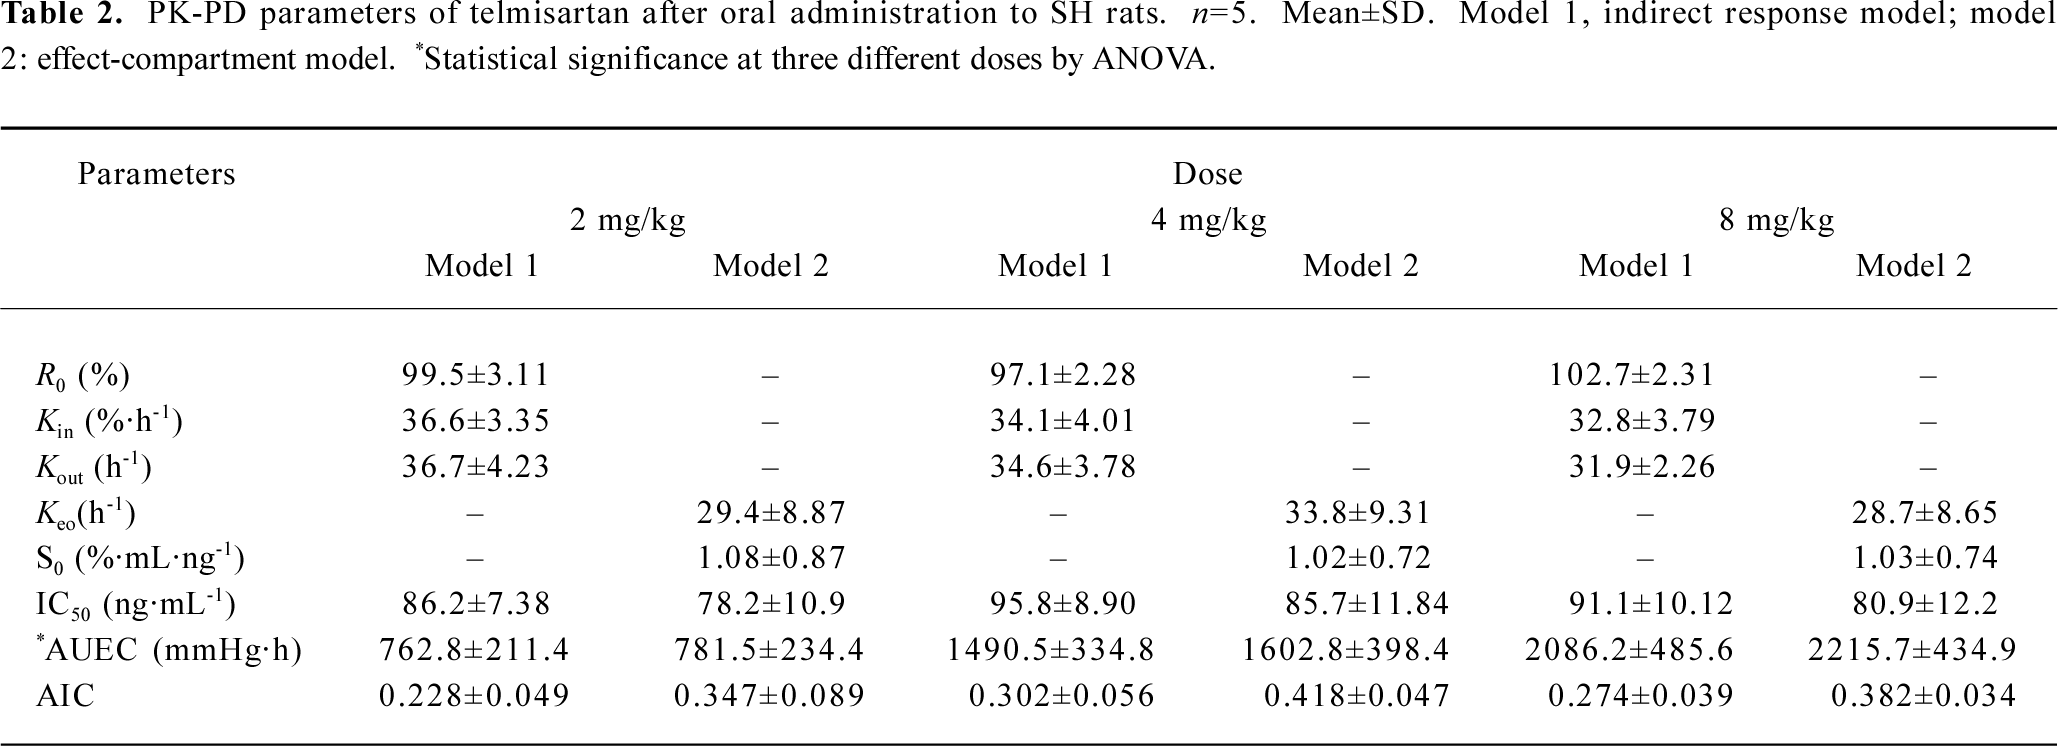
Full table
Discussion
A link model (effect-compartment model) was used to describe the PD of the AT1 inhibitor[12]; however, this model is physiologically unrealistic for the mechanism of this class drug which may be largely determined by the elimination rate of the physiological substance rather than the distribution of the drug to the site of action[13,14]. An indirect response model has been proposed for many drugs[15–17], such as the inhibition or simulation of the growth or decline of factor controlling the response measured experimentally. Despite the fact that the PK character and the mechanism of the hypotensive action of telmisartan have been described[7], the relationship between its PK and PD has not yet been established with a proper model. Based on the mechanism of telmisartan hypotensive action, the indirect response model was introduced for the investigation of the PK-PD relation-ship. As the present results indicated, the indirect response model provided a good prediction of the time course of the pharmacological effect. One of the objectives for this investigation was to compare the indirect PD response model with the effect-compartment link model for the PK-PD modeling of telmisartan based on the resultant AIC data listed in Table 2. The relationship between plasma concentrations of telmisartan and its hypotensive effect has been better fitted by the indirect PD response models than by the effect-compartment link model. The results suggested that the hypotensive effect of telmisartan could be better described by an indirect response mechanism.
An important issue regarding any PD model is its ability to reflect the underlying mechanism. Drugs/ligands that interact with the corresponding receptor have gained considerable interest for therapeutic use. It is reported that the hypotensive effect of telmisartan are mediated by blocking the AT1 receptor as the case for other sartans. The hypotensive mechanism of telmisartan is caused by the inhibition of adenylate cyclase (AC) by the AT1 receptor at many target sites, which inhibits the formation of cyclic adenosine monophosphate (cAMP) from cytoplasmic adenosine triphosphate. A decrease in the cAMP inhibited the cAMP-mediate protein kinase, which exhibits the blood pressure lowering through several routes, such as decreasing vasoconstriction, renal sodium re-absorption, aldosterone secretion, and sympathetic nervous system activity. It is assumed that production of cAMP is a zero-order process with a rate constant (Kin), whereas cAMP is eliminated by phosphodiesterase with a first-order rate constant (Kout). Telmisartan induces the blood pressure lowering through the inhibition of the production of cAMP with an inhibition constant of IC50. Hypotensive effect in turn is assumed to be proportional to the cAMP level. Therefore, the PD part of the model was also based on the scheme that blood pressure was produced by an input function (Kin) and dissipated by an output function and that telmisartan inhibits the factor of input of response. The initial decline of blood pressure reflected the inhibition of Kin values, whereas the return to baseline was controlled by the disappearance of telmisartan. In the present study, the change rate of the plasma concentration and hypotensive effect were fitted to a time-dependent function.
The investigation employed an indirect response PD model to describe the hypotensive effect dependent on the concentration of telmisartan. The study had provided the parameters (ie Kin, Kout, IC50) to estimate the duration, the intensity, and the rate of the hypotensive effects. In the PD profile, the blood pressure returned to the basal level in a relatively long time. This may be attributed to close drug-receptor binding, as well as slow dissociating from the receptor. In addition, the long duration of the pharmacological effect was justified by the finding that the IC50 of telmisartan was low, which suggested that telmisartan was a potent and longer acting blood pressure-lowering drug. The Cmax and AUC increased in proportion to the administered doses (r=0.98 and 0.99, respectively), while the ΔMABPmax and AUEC did not increase proportionally with dose increasing. This finding could be explained by the fact that antihypertensive drugs have a flat dose-response curve for the hypotensive effect[18].
In conclusion, we have characterized the PK and PD profiles of telmisartan, an AT1 receptor antagonist, in SH rats. An integrated indirect response PK-PD model was successfully developed to characterize the PK-PD profile after oral administration. The hypotensive response to telmisartan could be predicted accurately by using the indirect response model than the effect-compartment link model. The modeling procedure employed here may be useful for optimizing the therapeutic schedule of telmisartan.
References
- David HG, Smith MD. Treatment of hypertension with an angiotensin II-receptor antagonist compared with an angiotensin-converting enzyme inhibitor: a review of clinical studies of relmisartan and enalapril. Clin Ther 2002;24:1484-501.
- Unger T, Culman J, Gohlke P. Angiotensin II receptor blockade and end-organ protection: Pharmacological rationale and evidence. J Hypertens 1998;16:3-9.
- Karlberg BE, Lins LE, Hermansson K. Efficacy and safety of telmisartan, a selective AT, receptor antagonist, compared with enalapril in elderly patients with primary hypertension. J Hypertens 1999;17:293-302.
- Unger T, Sandmann S. Angiotensin receptor blocker selectivity at the AT1- and AT2-receptors: conceptual and clinical effects. J Renin Angiotensin Aldosterone Syst 2000;l Suppl 2:6-9.
- Mallion JM, Sich C J, Lacourciere Y. ABPM comparison of the antihypertensive profiles of the selective angiotensin II receptor antagonists telmisartan and losartan in patients with mild-to-moderate hypertension. J Hum Hypertens 1999;13:657-64.
- Neutel JM, Smith DH. Dose response and antihypertensive efficacy of the AT1 receptor antagonist telmisartan in patients with mild to moderate hypertension. Adv Ther 1998;15:206-17.
- Hammerlein A, Derendorf H, Lowenthal DT. Pharmacokinetic and pharmacodynamic changes in the elderly. Clin Pharma-cokinet 1998;35:49-64.
- Li P, Wang Y, Wang Y, Tang Y, Fawcett JP, Cui Y, et al. Determination of telmisartan in human plasma by liquid chromatography-tandem mass spectrometry. J Chromatogr B Anal Technol Biomed Life Sci 2005;828:126-9.
- Dayneka NL, Gary V, Jusko WJ. Comparison of four basic models of indirect pharmacodynamic response. J Pharmacokinet Biopharm 1993;21:457-78.
- Sriram K, Guenther H, Hartmut D. An interactive algorithm for the assessment of cumulative cortisol suppression during inhaled corticosteroid therapy. AAPS Pharmsci 2002;2:1-10.
- Schoemaker RC, van Gerven JMA, Cohen AF. Estimating potency for the Emax-model without attaining maximal effects. J Pharmacokinet Biopharm 1998;26:581-93.
- Huang XH, Qiu FR, Xie HT, Li J. Pharmacokinetic and pharmacodynamic of irbesartan in renal hypertensive dogs under non-steady-state and steady-state conditions. Eur J Drug Metab Pharmacokinet 2005;30:121-6.
- Jusko WJ, Ko HC. Physiologic indirect response models characterize diverse types of pharmacodynamic effects. Clin Pharmacol Ther 1994;56:406-19.
- Ebling WF, Matsumoto Y, Levy G. Feasibility of effect-controlled clinical trials of drugs with pharmacodynamic hysteresis using sparse data. Pharm Res 1996;13:1804-10.
- Erno AS, Henrik JMM, Adriaan PI, Meindert D. Physiological indirect effect modeling of the antilipolytic effects of adenosine A1-receptor agonists. J Pharmacokin Biopharm 1997;25:673-94.
- Lin SS, Chien YW. Pharmacokinetic-pharmacodynamic modeling of insulin: comparison of indirect pharmacodynamic response with effect-compartment link models. J Pharm Pharmacol 2002;54:791-800.
- Puchalski TA, Krzyzanski W, Blum RA, Jusko WJ. Pharmacodynamic modeling of lansoprazole using an indirect irreversible response model. J Clin Pharmacol 2001;41:251-8.
- Burnier M, Maillard M. The comparative pharmacology of angiotensin II receptor antagonists. Blood Press 2001;1:6-11.