
Efflux of potassium ion is an important reason of HL-60 cells apoptosis induced by tachyplesin1
Introduction
Tachyplesin, which is a kind of cationic peptide isolated from the hemocytes of horseshoe crabs, shows antibacterial activities with similar efficiencies for both gram-negative and gram-positive bacteria[1]. It consists of 17 amino acid residues and the structure determined by Edman degradation is: NH2-K-W-C-F-R-V-C-Y-R-G-I-C-Y-R-R-C-R-CONH2.
Tachyplesin is very stable in medium because it has a unique structure, which forms a rigid, antiparallel beta-sheet because of two intramolecular S-S linkages[1]. So it could be purified from horseshoe crabs hemocytes in a rigorous way. The cationic nature of tachyplesin interacts with anionic phospholipids present in the bacterial membrane and thereby disrupts membrane function[2–4].
We previously reported that the peptides could inhibit the growth of several tumor cells[5]. Li et al found tachyplesin could induce differentiation of human hepatocarcinoma cell line SMMC-7721[6]. Chen et al had shown that RGD-tachyplesin could induce apoptosis in both tumor and endothelial cells. RGD-tachyplesin activated caspase-9, caspase-8, and caspase-3 and increased the expression of the Fas ligand, Fas-associated death domain, caspase-7, and caspase-6[7]. Those studies gave a hint that tachyplesin is a potential anti-tumor peptide.
Tachyplesin can inhibit cell growth and induce cell apoptosis; however, the precise mechanism has not been elucidated. A major characteristic of apoptosis was shrinkage of cells[8]. Activation of K+ channels was an essential pathway in programmed cell death. The cell-volume decrease was coupled to K+ release from the cells[9,10]. In this paper, we investigated if apoptosis of HL-60 cells induced by tachyplesin was associated with the efflux of cell potassium and shrinkage of cell volume.
Materials and methods
Preparation of tachyplesin The hemolymph was collected and tachyplesin was prepared as described in a previous study[1]. Tachyplesin was solubilized in physiological saline. The concentration of tachyplesin was determined by the Bradford method[9].
Cell lines HL-60 cells(human promyelocytic leukemia cells), which grew in RPMI -1640 (Gibico BRL, Grand Island, NY, USA), containing penicillin100 µg/mL and streptomycin 100 µg/mL and supplemented with 10% fetal bovine serum (SIJIQING Laboratories, Hangzhou, China).
MTT viability assay HL-60 cells (1.0×10⁵ /mL) were cultured in 96-well plates (100 µL/well) and treated with 20 µg/mL tachyplesin in the presence or absence of 50 µmol/L z-VAD-fmk, DEVD-fmk, or IETD-fmk (Clontech, 1290 Terra Bella Ave. Mountain View, CA 94043, USA) for 24 h. In addition, HL-60 cells were treated with 20 µg/mL tachyplesin in the presence or absence of 5 mmol/L Ba2+ for 24 h. The number of viable cells in each well was estimated by adding 10 µL 0.5 mg/mL MTT (3-[4,5-dimethylthiazol-2-yl]-2,5-diphenyl-tetrazolium bromide) (Sigma,Louis,MO 63178, USA) solution. The cells were dissolved with 100 µL of solution that contained 20% SDS and 50% dimethy formamide after cells had been incubated for 4 h at 37 oC. The optical densities were quantified at a test wavelength of 570 nm and a reference wavelength of 630 nm using a multi-well spectrophotometer (Bio-Rad Model 540, 2000 Alfred Nobel Drive Hercules, CA 94547, USA). Results were calculated as the absorbance[5].
Subdiploid DNA analyzed by flow cytometry HL-60 cells (1.0×10⁶ cells) were treated with 20 µg/mL tachyplesin in the presence or absence of 50 µmol/L z-VAD-fmk, DEVD-fmk, or IETD-fmk for 24 h. In addition, HL-60 cells were treated with 20 µg/mL tachyplesin in the presence or absence of 5 mmol/L Ba2+ for 24 h. Cells were washed twice in 1×phosphate-buffered saline and incubated in 1×phosphate-buffered saline containing 100 µg/mL PI, 200 µg/mL RNase after cells were fixed with 70% ice-cool ethanol overnight. HL-60 cells were then analyzed at excitation wavelengths of 488 nm by flow cytometer (EPICS XL, Coulter Corporation, Fullerton, CA 92834-3100, USA). The percentage of degraded DNA was determined by the number of cells with subdiploid DNA divided by the total number of cells examined under each experimental condition[10].
Analysis of K+ in cells by flow cytometry HL-60 cells were treated with 20 µg/mL tachyplesin for 2, 4, 6, 8, and 10 h. In addition, HL-60 cells were treated with 20 µg/mL tachyplesin in the presence or absence of 5 mmol/L Ba2+ for 24 h. Intracellular potassium concentrations were determined as described in a previous study using flow cytometer[11]. HL-60 cells treated in the presence or absence of tachyplesin alone or and other reagents were loaded with the potassium-sensitive fluorescent dye potassium-binding benzofuran isophthalate (PBFI-AM, Sigma) to a final dye concentration of 5 µmol/L for 1 h at 37 °C, 5% CO2 atmosphere prior to examination. Cells were analyzed at excitation wavelengths of 350 nm by flow cytometry.
Measurement of mitochondrial membrane potential and analysis of cell shrinkage by flow cytometry HL-60 cells were treated with 20 µg/mL tachyplesin for 2, 4, 6, 8, and 10 h. In additions, HL-60 cells were treated with 20 µg/mL tachyplesin in the presence or absence of 5 mmol/L Ba2+ for 24 h. HL-60 cells were loaded with rhodamine 123(2-[6-amino-3-imino-3H-xanthen-9-yl]benzoic acid methyl ester) (Sigma) to a final dye concentration of 10 µg/mL at 37 °C or 15 min, 5% CO2 atmosphere prior to examination. Cells were examined at the designated time. Mitochondrial membrane potential and size of the cells were determined by flow cytometry. Cells were analyzed by excitation of the cells containing rhodamine 123 at 488 nm. The change of fluorescent intensity of rhodamine 123 indicated the change of mitochondrial membrane potential.
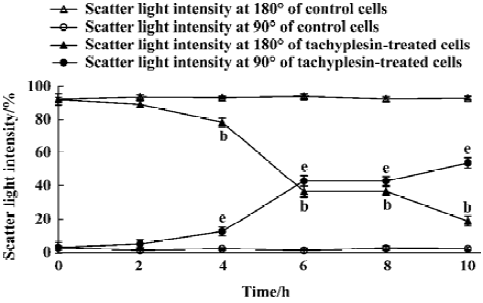
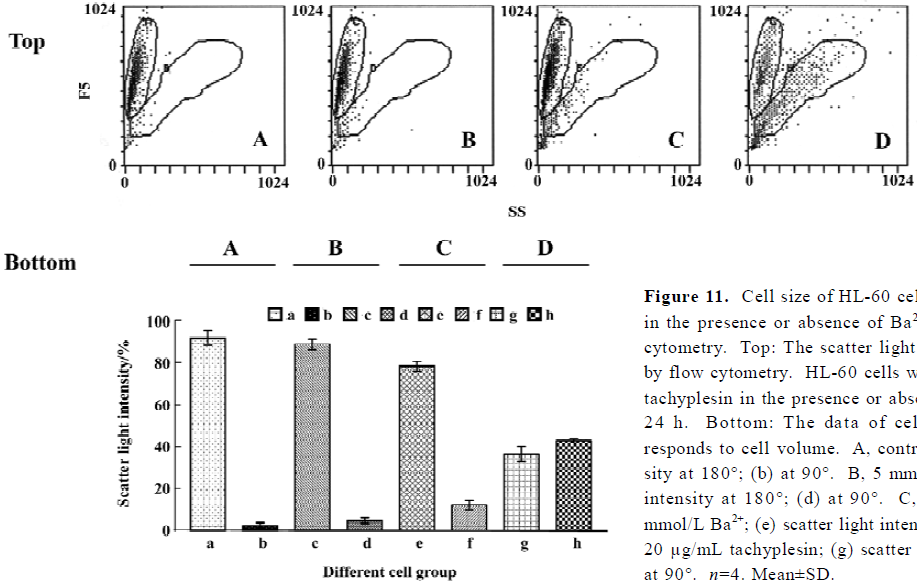
Cells were examined by exciting the cells with a 488 nm argon laser and determining their position on a forward-scatter and side-scatter dot plot. Light scattered in the forward direction (180o) was proportional to cell size, while light scattered at a 90o angle (side scatter) was proportional to cell density[11]. Therefore, as a cell shrinks or loses cell volume, a decrease in the amount of forward-scattered light was observed, along with a change in side-scattered light.
Data analysis Data were expressed as mean±SD. Statistical significance was evaluated using the Student’s t-test. P<0.05 was considered to be statistically significant.
Results
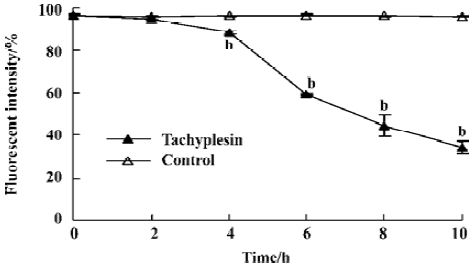
Change of intracellular potassium HL-60 cells were examined by flow cytometry using the fluorescent potassium indicator dye. Intracellular K+ was detected by PBFI (K+) fluorescence intensity. The loss of intracellular K+ was observed in a time-dependent manner (Figure1).
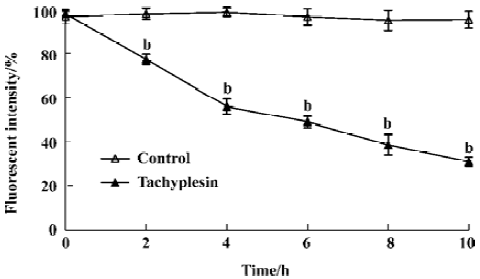
Loss of mitochondrial membrane potential coupled to the shrinkage of cells The fluorescent intensity of rhodamine 123 was examined to detect the changes of mitochondrial membrane potential. It was shown that the loss of the mitochondrial membrane potential of tachyplesin-treated HL-60 cells was in a time-dependent manner (Figure 2). Simultaneously, cells that decreased in cell volume had a reduced ability to scatter light in the forward direction (180°). Furthermore, these cells also showed an increase in their ability to scatter light at a 90° angle, indicating an increase in cellular density (Figure 3). Examinations of each cell size of various groups showed that the loss of cell volume accompanied the changes of mitochondrial membrane potential in cells.
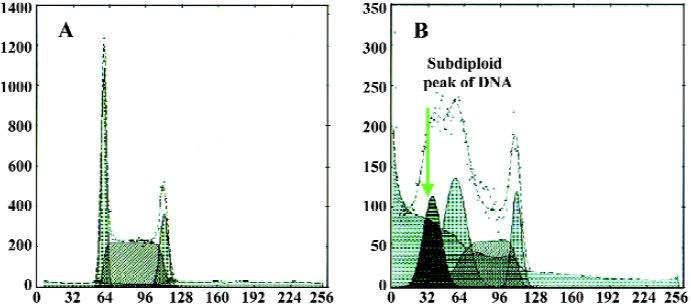
Different caspase inhibitors protected against DNA degradation but did not prevent the loss of HL-60 cell viability induced by tachyplesin HL-60 cells treated with tachyplesin for 24 h showed all of the classical characteristics of apoptosis, including DNA degradation, as determined by an increase in the number of cells with a subdiploid peak of DNA by flow cytometry (Figure 4).
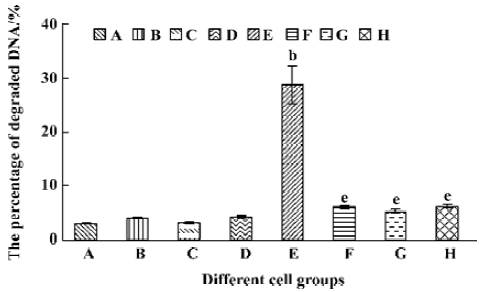
The presence of 50 µmol/L z-VAD completely inhibited DNA degradation of tachyplesin-treated HL-60 cells (Figure 5F). Similar results were observed when either 50 µmol/L DEVD (a caspase-3 inhibitor) (Figure 5G) or IETD (a caspase-8 inhibitor) (Figure 5H) were used, indicating that the concentration of caspase inhibitors used in these experiments were effective in preventing DNA degradation event.
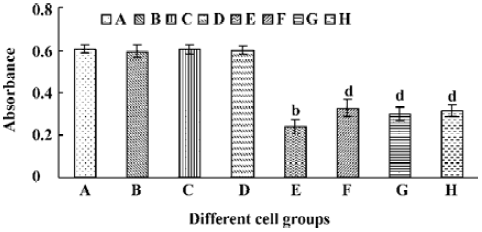
A significant fall of cell viability was detected by MTT method after HL-60 cells had been treated with tachyplesin for 24 h (Figure 6E). z-VAD, DEVD, and IETD were ineffective in preventing the loss of cell viability in cells treated with tachyplesin (Figure 6F–H). Interestingly, the loss of cell viability occurred (Figure 6F–H) in the absence of DNA degradation (Figure 5F–H). It was suggested that a cell viability change was independent of DNA degradation and, in a caspase-independent manner, induced by tachyplesin.
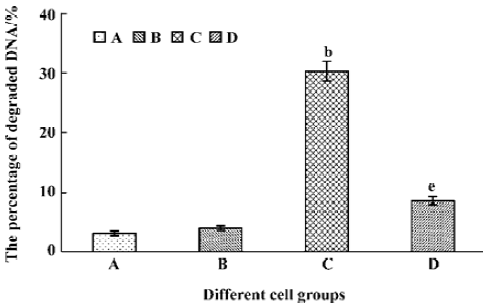
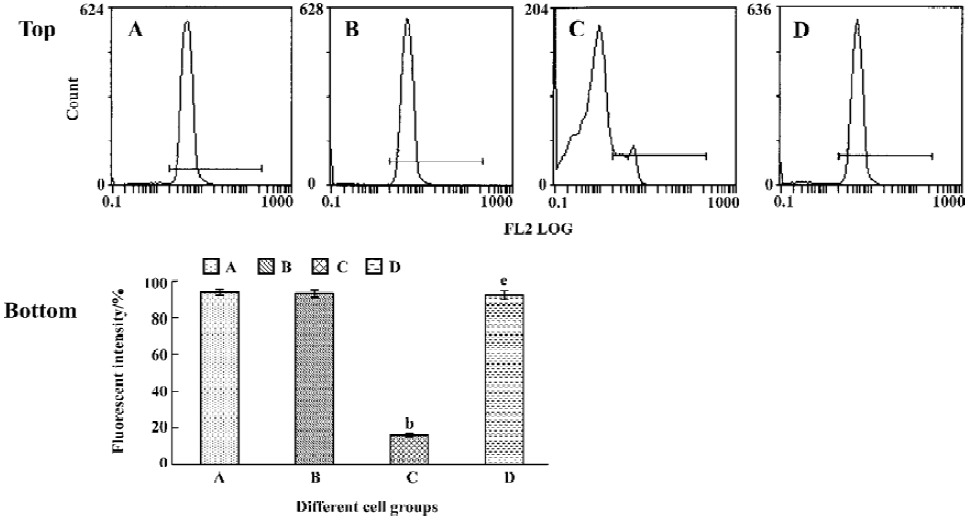
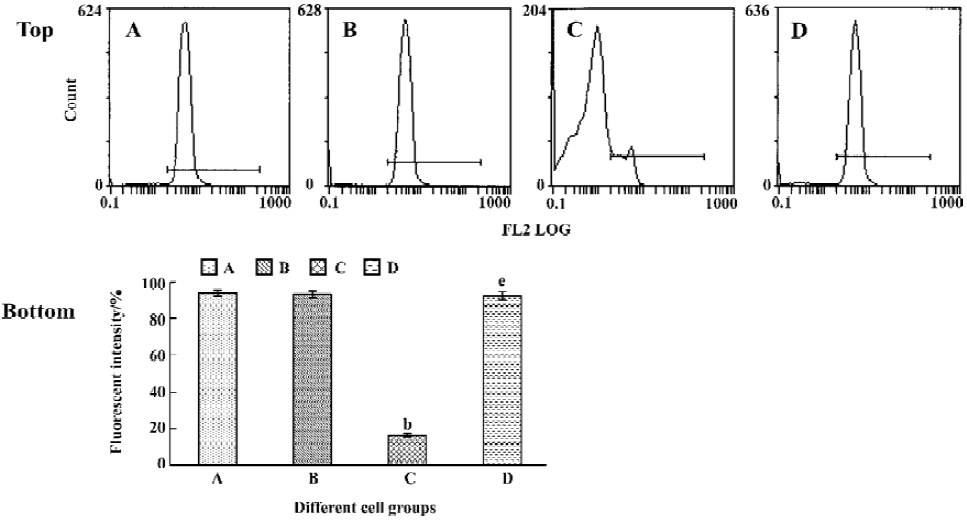
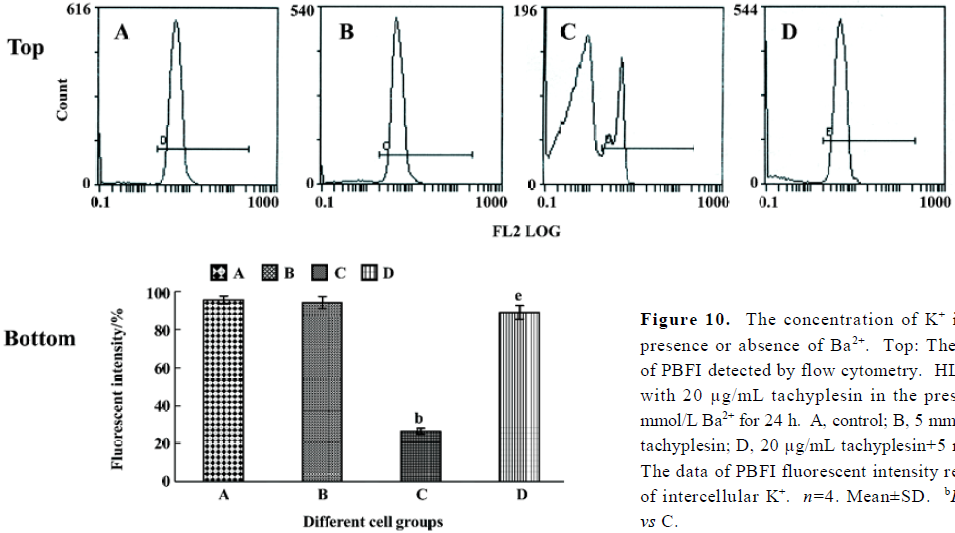
Tachyplesin sensitivity to Ba2+ The percentage of degraded DNA increased and cell viability reduced when HL-60 cells were treated with tachyplesin (Figures 5 and 6). It was completely inhibited by Ba2+ (BaCl2), which is a blocker of volume-regulatory K+ channels (Figures 7 and 8). The mitochondrial membrane potential was stable in the presence of Ba2+ when HL-60 cells were treated with tachyplesin (Figure 9). This indicated that Ba2+ suppressed the function of tachyplesin. In the meantime, the concentration of K+ was maintained in HL-60 cells in the presence of Ba2+ (Figure 10) and the effect of tachyplesin on cell size was eliminated by Ba2+ (Figure 11). It implied the efflux of cellular potassium ion was blocked by Ba2+. Ba2+ blocked efflux of the intracellular potassium to maintain cell size and mitochondrial membrane potential. These data indicated that efflux of the potassium was an important factor for HL-60 cell death induced by tachyplesin.
Discussion
Bortner and John reported that the loss of intracellular K+ could prompt cell apoptosis. A loss of intracellular K+ occurred in the shrunken population of apoptotic cells and the loss of mitochondrial membrane potential was also restricted to the shrunken population of cells. So they suggested that loss of cell volume, K+ efflux, and loss of the mitochondrial membrane potential were tightly coupled[11].
Depolarization of the cytoplasmic membrane was associated with tachyplesin-mediated activity. Matsuzaki et al’s detailed analysis found that the affinity of tachyplesin to the phosphatidylglycerol (PG) membranes was so strong that one tachyplesin molecule could bind to approx 200 lipid molecules and cause membranes to leak[4]. Other reports showed that tachyplesin could interact with anionic phospholipid membranes and thereby disrupt membrane function[2,3]. So tachyplesin can change cell membrane permeability to cause cell death.
The treatment of HL-60 cells with tachyplesin resulted in alterations of intracellular K+ and the fall of mitochondrial membrane potential in a time-dependent manner, which was coupled to the shrinkage of cells. These results indicated tachyplesin peptide could interact with cell membranes and affect ion channels. It then led to a leakage of cell membranes[4]. K+ effused out from the cells at last.
Cell volume is directly related to the movement of ions, with homeostasis being achieved by a balance of osmotic pressure across the plasma membrane. When the concentration of solute particles on each side of the membrane is equal, a net movement of water is inhibited, thus maintaining a constant cell size. Most cells achieve and maintain this osmotic balance through the continuous activity of the Na+/K+ ATPase pump, which creates and maintains an intracellular environment high in potassium and low in sodium. In contrast, the extracellular environment typically contains low levels of potassium and high levels of sodium. Despite the negative transmembrane potential, a net electrochemical gradient is established that favors the passive movement of potassium out of the cell[12,13]. Bortner et al’s results showed that potassium ion efflux prompted the movement of water molecules and caused cell-volume shrinkage in cell apoptosis[14]. In accordance with Bortner et al’s report, it was suggested that the intracellular water would be accompanied with efflux of K+ to lose in cell apoptosis induced by tachyplesin. Efflux of intracellular water caused cell volume to shrink.
A recent study by Arrebola et al supported our results that the loss of intracellular potassium occurred in cells that have lost their mitochondrial membrane potential[15]. It was reported that the initial stages of apoptosis were characterized by decreases in K+. The largest decreases were in mitochondrial membrane potential and occurred before the release of cytochrome c in U937 cells undergoing UV-induced apoptosis. Shimizu et al reported that mitochondrial membrane potential changed and cell death were inhibited if voltage-dependent anion channel were closed[16]. Bortner et al’s study indicated that decrease of mitochondrial membrane potential was accompanied by mitochondrial depolarization, an event which follows the onset of the mitochondrial permeability transition. Various proapoptotic factors such as cytochrome c and apoptosis-inducing factor were released from mitochondria to cause cell apoptosis[14]. Apparently, the decrease of mitochondrial membrane potential was associated with loss of intracellular potassium. According to our experimental data, loss of mitochondrial membrane potential was coupled with loss of intracellular K+ in tachyplesin-induced apoptosis. So loss of intracellular K+ induced cell apoptosis was related to mitochondrial membrane potential decrease in tachyplesin-induced apoptosis.
HL-60 cells treated with tachyplesin showed DNA degradation, which was the classical characteristic of apoptosis. Bortner et al’s study showed that high extracellular potassium inhibited caspase-3 activation and DNA degradation, and prevented the loss of cell viability and cell shrinkage[14]. Efflux of K+ caused the concentration of ions to fall and activate apoptosis-associated enzymes, including caspases. It is well known that activated caspases could lead to the formation of DNA degradation and caspase inhibitor can block this process. Our results showed DNA degradation of HL-60 cells was inhibited by the presence of several of caspase inhibitors, including z-VAD, DEVD, and IETD.
However, it was interesting that these caspase inhibitors did not prevent the loss of HL-60 cell viability induced by tachyplesin. This indicated that cell death was independent of DNA degradation. Ba2+ not only inhibited DNA degradation but also prevented cell death induced by tachyplesin. This means that DNA degradation was inhibited when the efflux of K+ was blocked by Ba2+. Arrebola et al’s and Bortner et al’s results showed that cell shrinkage occurred early in apoptosis and the changes of the intracellular K+ preceded apoptotic changes[14,15]. Bortner et al showed that activation of the procaspase by dATP and cytochrome c was effectively inhibited by physiological K+ concentrations, and an apoptotic cell from a state of high ionic strength to low ionic strength permitted both the loss in cell volume and the activation of enzymes that mediate apoptosis[14]. It gave a hint that efflux of K+ affected viability of tachyplesin-treatment HL-60 cells prior to the process of caspase activation and efflux of K+ may prompt cell death in a caspase-independent manner. Our results showed that tachyplesin had similarly cytotoxic mechanism of decreased intracellular potassium with thapsigargin and calcium ionophore A23187.
Cell size and the mitochondrial membrane potential of HL-60 cells was maintained stably in the presence of 5 mmol/L Ba2+. Shimizu et al reported that mitochondrial membrane potential changed and cell death were inhibited if voltage-dependent anion channel were closed[16]. It was suggested that Ba2+ could inhibit tachyplesin-induced HL-60 cell apoptosis by blocking the efflux of K+.
HL-60 cells treated by tachyplesin caused the permeability of cell membranes to change and K+ effused from the cells. The efflux of K+ causes water loss in the cells. The volume of cells shrank and caspases were activated. Furthermore, the changes of K+ in the cells affected the mitochondrial membrane potential of tachyplesin-treatment in HL-60 cells. Tachyplesin could induce cell apoptosis in a caspase-dependent manner. In addition, tachyplesin can prompt cell death in a caspase-independent manner because caspase inhibitors did not suppress cell death.
References
- Nakamura T, Furunaka H, Miyata T, Tokunaga F, Muta T, Iwanaga S, et al. Tachyplesin, a class of anti-microbial peptide from the hemocytes of the horseshoe crab (Tachypleus tridentatus). Isolation and chemical structure. J Biol Chem 1988;263:16709-13.
- Park NG, Lee S, Oishi O, Aoyagi H, Iwanaga S, Yamashita S, et al. Conformation of Tachyplesin I from Tachypleus tridentatus when interacting with lipid matrices. Biochemistry 1992;31:12241-7.
- Katsu T, Nakao S, Iwanaga S. Mode of action of an anti-microbial peptide, Tachyplesin I, on biomembranes. Biol Pharm Bull 1993;16:178-81.
- Matsuzaki K, Fukui M, Fujii N, Miyajima K. Interactions of an antimicrobial peptide, Tachyplesin I, with lipid membranes. Biochim Biophys Acta 1991;1070:259-64.
- Zhang HT, Zhu QF. Effect of peptide from horseshoe crab hemocyte on the growth of various tumor cell lines. Chin J Mod Appl Pharm 2001;18:208-9.
- Li QF, Ouyang GL, Liu QR, Hong SG. Tachyplesin-induced differentiation of human hepatocarcinoma cell line SMMC-7721. Chin J Cancer 2002;21:480-3.
- Chen YX, Xu XM, Hong SG, Chen JG, Liu NF, Charles BU, et al. RGD-tachyplesin inhibits tumor growth. Cancer Res 2001;61:2434-8.
- Wyllie AH, Kerr JF, Currie AR. Cell death: the significance of apoptosis. Int Rev Cytol 1980;68:251-306.
- Bradford MM. A rapid and sensitive method for the quantitation of microgram quantities of protein utilizing the principle of protein-dye binding. Anal Biochem 1976;72:248-54.
- Zhang HT, Cai KR, Zhu QF. Apoptosis of HL-60 cells induced by peptide from hemocyte of horseshoe crab. Chin J Cancer 2001;20:616-9.
- Bortner CD, John AC. Caspase independent/dependent regulation of K+, cell shrinkage, and mitochondrial membrane potential during lymphocyte apoptosis. J Biol Chem 1999;274:21953-62.
- Remillard CV, Yuan JXJ. Activation of K+ channels: an essential pathway in programmed cell death. Am J Physiol Lung Cell Mol Physiol 2004;286:L49-67.
- Cauvi D, Penel C, Nlend MC, Venot N, Allasia C, Chabaud O. Regulation of thyroid cell volumes and fluid transport: opposite effects of TSH and iodide on cultured cells. Am J Physiol Endocrinol Metab 2000;279:E546-53.
- Bortner CD, Francis MH Jr, John AC. A primary role for K+ and Na+ efflux in the activation of apoptosis. J Biol Chem 1997;272:32436-42.
- Arrebola F, Fernandez-Segura E, Campos A, Crespo PV, Skepper JN, Warley A. Changes in intracellular electrolyte concentrations during apoptosis induced by UV irradiation of human myeloblastic cells. Am J Physiol Cell Physiol 2006;290:C638-C49.
- Shimizu S, Konishi A, Kodama T. BH4 domain for anti-apoptotic Bcl-2 family members close voltage-dependent anion channel and inhibit apoptotic mitochondrial changes and cell death. Proc Natl Acad Sci USA 2000;97:3100-5.