
Chronic angiotensin (1-7) injection accelerates STZ-induced diabetic renal injury1
Introduction
The renin–angiotensin system (RAS), a potent regulator of blood pressure, plays a pivotal role in cardiovascular homeostasis, hydroelectrolyte balance, and cell functions. Attesting to its importance in regulating the internal environment is the fact that overactivity of RAS can lead to arterial hypertension, congestive heart failure, and renal insufficiency[1]. The RAS in diabetes has been studied in detail, including an assessment of the various components of this pathway in the kidney[2,3]. Furthermore, it has been postulated that in diabetes there is a role for the RAS in mediating many of the functional effects, such as changes in intraglomerular hemodynamics as well as structural changes in the diabetic kidney at both the glomerular and tubulointerstitial levels[4].
Angiotensin (Ang) II, which is cleaved from Ang I by angiotensin-converting enzyme (ACE), is a vasoconstrictor and growth stimulator when acting on the Ang II type 1 (AT1) receptor. Currently, therapies for different cardiovascular diseases are mainly based on the inhibition of ACE or Ang II receptor blockade[5,6]. Recently, a chemically-related enzyme, ACE2, was cloned and identified. It shared 42% homology with ACE at the metalloprotease catalytic domain[7,8], but differed from ACE in having only 1 enzymatic site. It has been shown that recombinant ACE2 hydrolyzes the carboxy terminal leucine from Ang I to generate Ang (1–9)[7,8]. ACE2 also has a high affinity for Ang II[9], resulting in its degradation to Ang (1–7)[7]. Ang (1–7) is another bioactive peptide besides Ang II in RAS. It is considered to play a counteracting effect to Ang II via acting on the Mas receptor. ACE2 is not inhibited by classic ACE inhibitors, such as captopril or lisinopril. The high expression levels of ACE2 in the normal kidney[7,10,11], together with the observations of reduced levels of ACE2 in diabetic rats and in human kidney diseases[12], imply that the ACE2 Ang (1–7) axis in RAS may be involved in kidney physiology and pathophysiology.
The inhibition of ACE blocks the metabolism of Ang (1–7) to Ang (1–5) and can lead to the elevation of Ang (1–7) levels in plasma and tissue. Ang (1–7) itself causes or enhances vasodilation and inhibits vascular contractions to Ang II[43–45]. Although the counterregulatory actions of Ang (1–7) have been well documented in animal models[46-48], no extensive studies have addressed the effects of Ang (1–7) on renal function and the changes of kidney local RAS brought by it. Therefore, we sought to study the effects of Ang (1–7) on tissue RAS in the progressing diabetic nephropathy model.
Materials and methods
Drugs and chemicals Streptozotocin (STZ) was purchased from Sigma (St Louis, MO, USA), the mini-osmotic pump was purchased from Alza (Palo Alto, CA, USA), TRIZOL reagent was purchased from Watson Biotechnologies (Shanghai, China), the Superscript first strand synthesis system for RT–PCR was purchased from Promega (Madison, WI, USA), and proteinase inhibitor was purchased from Upstate (Waltham, MA, USA). The Ang (1–7) polypeptide was synthesized by GL Biochem (Shanghai, China), prestained standards as molecular weight markers were purchased from Jingmei (Shanghai, China), the polyvinylidene difluoride (PVDF) membrane was purchased from Amersham (Piscataway, NJ, USA), the polyclonal rabbit antihuman ACE2 antibody was purchased from Abcam (Cambridge, UK), the monoclonal mouse antihuman TGF-β antibody was purchased from Chemicon (Malvern, PA, USA), the Western blotting analysis system was purchased from Amersham–Pharmacia Biotech (San Francisco, CA, USA), and the monoclonal anti-β-actin antibody was purchased from Sigma (St Louis, MO, USA). The anti-Ang II antibody and mono-iodinated [125I]-labeled Ang II was purchased from Furui Biotech (Beijing, China), the BCA protein assay kit was purchased from Shenergy Biocolor BioScience and Technology (Shanghai, China), the SYBR green QRT–PCR master mixture was purchased from Applied Biosystems (Tokyo, Japan), and other chemicals and reagents were of analytical grade.
Animal model Age-matched, 4-month-old male Sprague–Dawley rats, weighing 180–210 g, were provided by Department of Experimental Animal, Shanghai Medical College, Fudan University. All procedures were followed the Guide for Care and Use of Laboratory Animals of Fudan University (Shanghai, China). The animals were acclimatized for 5 d before the study and had free access to water and standard rat chow throughout the experiment.
The rats were rendered diabetic with a single injection of STZ (65 mg/kg, ip) dissolved in 0.1 mol/L sodium citrate buffer (pH 4.0). Only animals with plasma glucose concentrations >16.7 mmol/L 1 week after the induction of STZ were included in the study[13]. Body weight, 24 h urine protein, serum blood urea nitrogen (BUN), and creatinine were measured every 3 weeks. The rats were divided into 3 groups: (1) control rats, injected with vehicle (0.1 mol/L sodium citrate buffer, pH 4.0); (2) diabetic rats, sham-embedded with empty pump after 3 weeks; and (3) D+Ang(1–7) rats, diabetic rats injected with Ang(1–7) at a dose of 25 µg·kg–1·h–1 through the jugular vein by embedding the mini-osmotic pump at the end of 3 weeks[14]; 12 weeks after STZ injection, [or 9 weeks after Ang(1–7) vein injection for D+Ang(1–7) group], the rats were killed by decollation, and blood was collected for glucose, BUN, creatinine, and Ang II concentration measurements.
Isolation of total RNA and synthesis of cDNA The whole kidney was sliced up and frozen by liquid nitrogen promptly avoiding RNA degradation[13]. To avoid the cortex and medulla proportion difference, the kidney was crosscut and marked. About 50 mg of an equivalent proportion slice tissue was removed and homogenized using concussive muller in TRIZOL, and total RNA was isolated. cDNA was synthesized with a reverse transcriptase reaction carried out with standard techniques by using the Superscript first strand synthesis system. The reaction mixtures were: 1 μg total RNA extracted from the control and diabetic rat kidneys, 0.5 μg random hexamers, 10 mmol/L dNTP 4 μL, 15 U AMV reverse transcriptase, 25 U RNase inhibitor in a total volume of 20 μL. Aliquot of the resulting single-strand cDNA (1 μL) was used in the real-time PCR experiments as described later. To assess genomic DNA contamination, controls without reverse transcriptase were included.
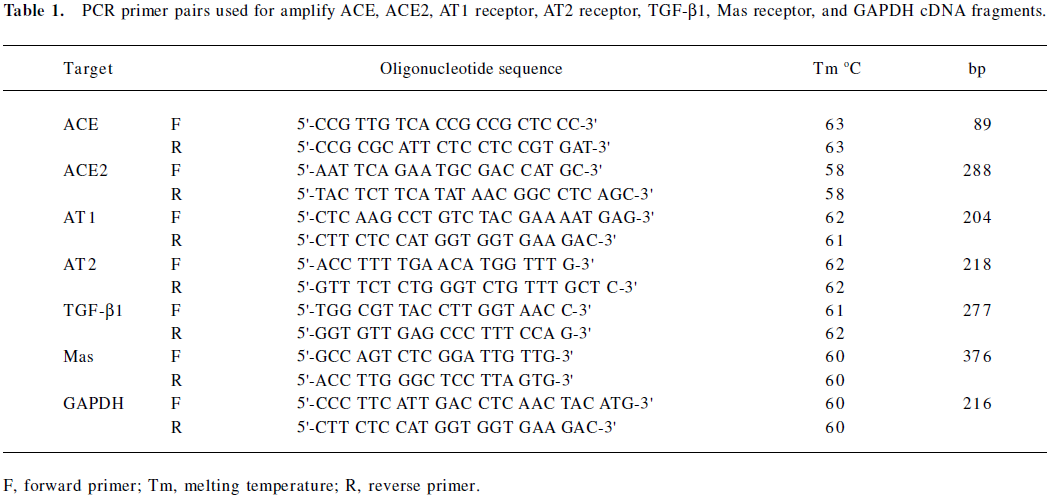
Real-time PCR Quantification ACE, ACE2, AT1, AT2, TGF-β1, and Mas receptor PCR primers were designed with Primer express (PE Applied Biosystems, Shanghai, China)[15]. The primer sequences are listed in Table 1.
Full table
SYBR Green real-time PCR was used to quantify the relative abundance of target mRNAs in the samples. PCR procedures were performed according to the manufacturer’s protocols, and the accumulated fluorescence was detected by iCycler iQ real-time PCR detection system (Bio-Rad, Hercules, CA, USA). The PCR procedure was performed with the following time courses: 95 ℃ for 10 min, 40 cycles at 95 ℃ for 30 s, 63 ℃ (for ACE), 58 ℃ (for ACE2), 62 ℃ (for both AT1 and AT2 receptors and TGF-β1) and 60 ℃ (for Mas receptor and GAPDH) for 45 s, and 72 ℃ for 1 min for amplification. The amplified products were subjected to a stepwise increase in temperature from 55 ℃ to 95 ℃ and dissociation curves were constructed.
Target mRNA was quantified by measuring the threshold cycle (when fluorescence is statistically significant above the background) and read against a calibration curve. The relative amount of each mRNA was normalized to the housekeeping gene, GAPDH mRNA. Each sample was run and analyzed in triplicate. The samples from the control kidney were then used as the calibrator with a given value of 1, and the diabetic groups were compared with this calibrator[16].
Western blotting Kidneys from the control, diabetic, and D+Ang (1–7) animals were quickly removed and minced with a scalpel blade, resuspended in 4-fold volume of 10% m/v SDS buffer with 1:25 proteinase inhibitor, homogenized at 12 000×g with the concussive muller, and centrifuged at 1000×g (4 ℃) for 10 min. The supernatants were removed and kept at –80 ℃ until used for further analysis.
Protein concentrations in the supernatant were measured by the BCA protein assay kit. A solubilized tissue sample (30 µg of total protein) and prestained standards as molecular weight markers were loaded and separated in a 12% polyacrylamide sodium dodecyl sulfate gel, and proteins were transblotted onto the PVDF-membrane through the use of a transfer tank at 270 mA for 110 min. At the end of the transfer, the filters were blocked with 10% skim milk powder in Tris-buffered saline (TBS) and 0.1% Tween (TBS/Tween) for 1 h at room temperature with gentle rocking. For the ACE2 immunodetection, the membranes were incubated with a polyclonal rabbit antihuman ACE2 antibody, diluted at 1:600 with 10% skim milk powder in TBS/Tween and incubated overnight at 4 ℃. For the TGF-β immunodetection, the membranes were incubated with a monoclonal mouse antihuman TGF-β antibody diluted at 1:5000 with 10% skim milk powder in TBS/Tween. The following day, the membrane was washed thoroughly 3 times (15 min washes) in TBS/Tween. Positive bands were developed with the use of the Western blotting analysis system, in which a horseradish peroxidase-labeled secondary antimouse antibody was diluted at 1:1000 for TGF-β, a secondary antirabbit antibody for ACE2, and incubated for 1 h at room temperature. They were then washed 3 times for 15 min with TBS (pH 7.2), treated with the enhanced chemiluminescent (ECL) method following the instructions of the ECL detection kit, and exposed to Kodak X-ray film (Kodak, Rochester, NY, USA) for 0.5–20 min as necessary to detect the signals.
To ensure equal protein loading, all membranes were stripped and probed with a monoclonal anti-β-actin antibody that recognizes the β-actin protein at ~43 kDa. The relative intensity of immunoreactive band exposed on the films was quantified and corrected for the β-actin signal by using a computer-assisted densitometry program (Smart View, Life Science Research Products and System Engineering, Shanghai, China).
Measurement of Ang II by radioimmunoassay Plasma and kidney Ang II levels were measured by a radioimmunoassay as previous reported[17]. For these measurements, kidney and plasma samples were collected when the rats were killed. For the assessment of plasma Ang II levels, blood was collected into chilled tubes containing anticoagulant. Blood samples were centrifuged at 4 ℃ for 10 min at 1 000×g, and the supernatant was collected and stored at –20 ℃ for further assay. One kidney was removed quickly, weighed, immersed in 5-fold volume of cold acetic acid (1 mol/L), and immediately homogenized with concussive muller.
For the analysis of renal Ang II levels, kidney supernatants were dried overnight in a vacuum centrifuge. The dried residue was reconstituted in 4 mL of 50 mmol/L sodium phosphate buffer, pH 7.4, containing 1 mmol/L EDTA. Plasma and kidney extracts samples were incubated with Ang II antiserum and [125I]-labeled Ang II for 15 min at 4 ℃, and then e centrifuged for 15 min at 3500×g. The supernatant was discarded, and the radioactivity counts per minute (cpm) were recorded and then calculated by a computer. The results for kidney Ang II levels are reported as picogram per gram of kidney weight. The sensitivity of the Ang II assay was <10 pg/g.
Statistical analysis The results are expressed as mean±SEM. Data were analyzed by one-way ANOVA followed by Bonferroni correction for all pairwise comparisons. Significance was assigned at P<0.05.
Results
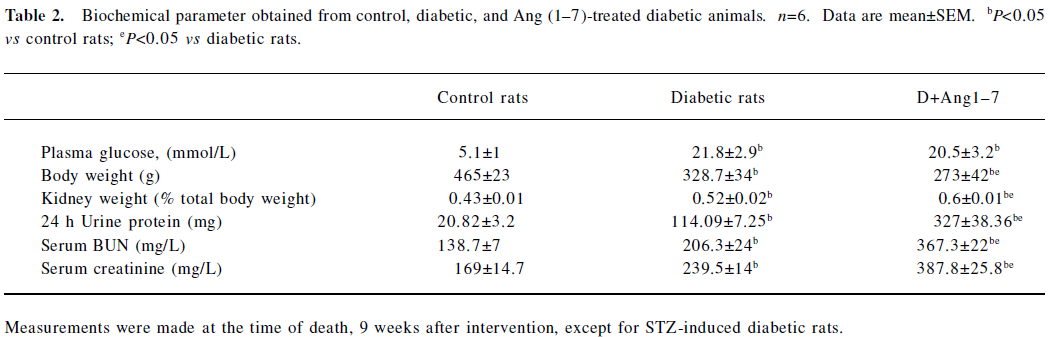
Biochemical parameter obtained from control, diabetic, and Ang (1–7)-treated animals STZ-induced diabetic rats had significant hyperglycemia (plasma glucose: STZ, 21.8±1.9 mmol/L vs control, 5.1±1 mmol/L, P<0.05) at the time of death. In D+Ang(1–7) rats, the plasma glucose levels indicated significant hyperglycemia, but did not differ from the diabetic rats (P<0.05). There were significant decreases in body weight, and increases in kidney weight, both in the diabetic control group and Ang(1–7)-injected diabetic rats, but the [D+Ang(1–7)]group had a further decrease in body weight and a further increase in kidney weight, which was significantly different from the diabetic group. 24 h Urine protein excretion increased significantly in both the diabetic group and Ang (1–7)-treated diabetic rats, but Ang (1–7)-treated diabetic rats had significantly higher 24 h urine protein excretion than diabetic rats (P<0.05). The serum BUN and creatinine levels increased significantly in the diabetic group and Ang (1–7) -treated diabetic groups, and the D+Ang(1–7) rats had a greater increase than the non-treated diabetic rats (P<0.05; Table 2).
Full table
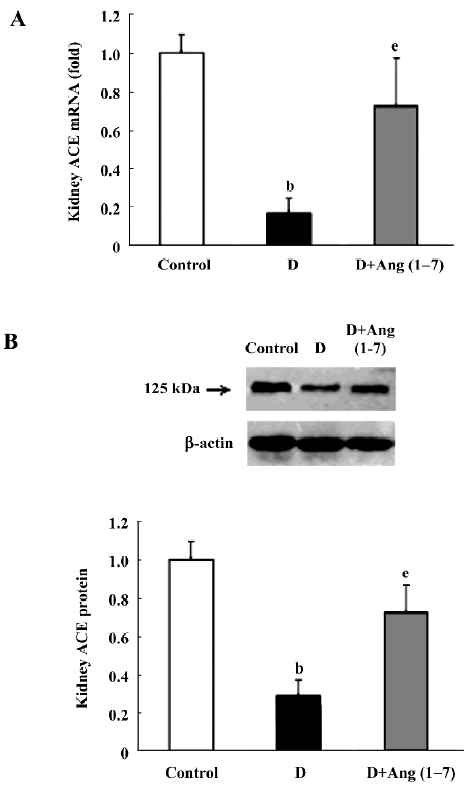
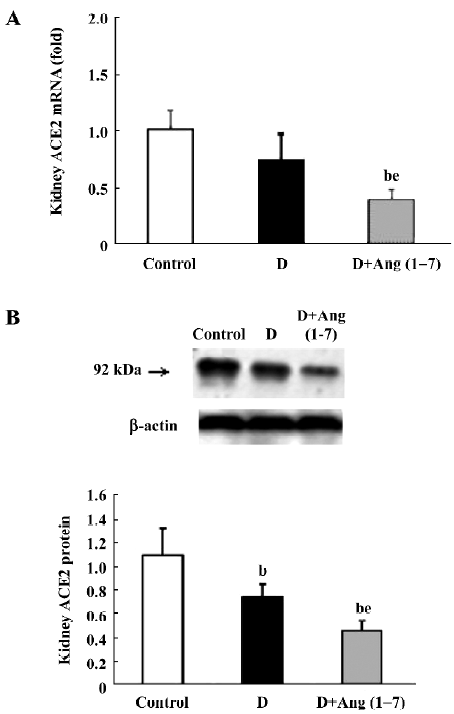
Changes in ACE, ACE2, and AT1, AT2, and Mas receptors in control, diabetic, and Ang (1–7)-treated diabetic rats As shown in Figure 1A and B, there were significant decreases in both ACE mRNA and protein levels in the diabetic rats compared with the control rats. Both ACE mRNA and protein levels recovered in Ang (1–7)-treated diabetic rats and showed significant differences from that of diabetic rats (P<0.05), and no difference from the control rats. With regard to ACE2 mRNA levels, diabetic rats also showed a decrease compared with the control rats, although it did not reach statistical significance. The Ang (1–7)-treated group showed a greater decrease in ACE2 mRNA levels than the diabetic group (P<0.05). The ACE2 protein levels showed consistency with the mRNA changes (Figure 2A, 2B).
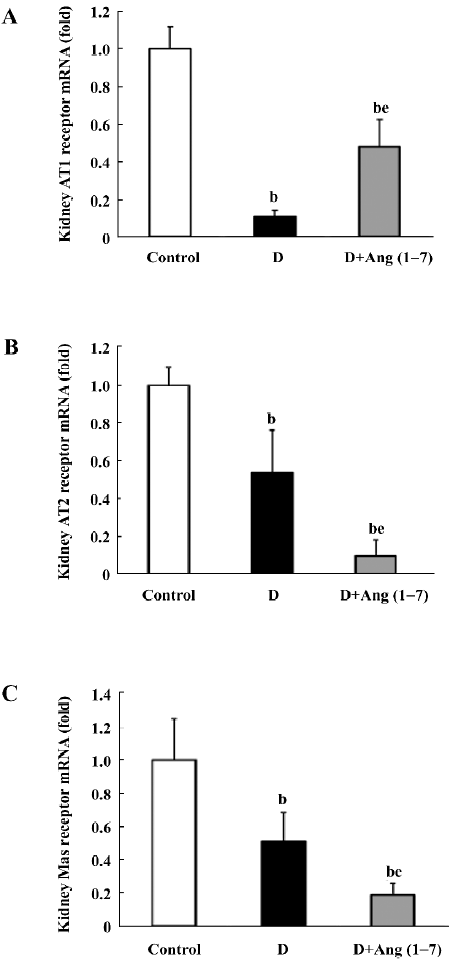
In the diabetic rats, AT1 receptor mRNA showed a sharp decrease compared with the control rats (P<0.05). The Ang (1–7)-treated group had an increased AT1 receptor mRNA level compared with the diabetic rats (P<0.05), although it still showed a significant decrease relative to the control rats (Figure 3A). As for the AT2 receptor mRNA level, diabetic rats showed a significant decrease relative to the control rats. The Ang (1–7)-injected (iv) group showed a more significant decrease in AT2 receptor mRNA than diabetic rats (P<0.05; Figure 3B) With regard to the Mas receptor mRNA level, there was a significant decrease in diabetic rats compared with the control rats, and the [D+Ang (1–7) rats had a more significant decrease than the diabetic rats (P<0.05; Figure 3C).
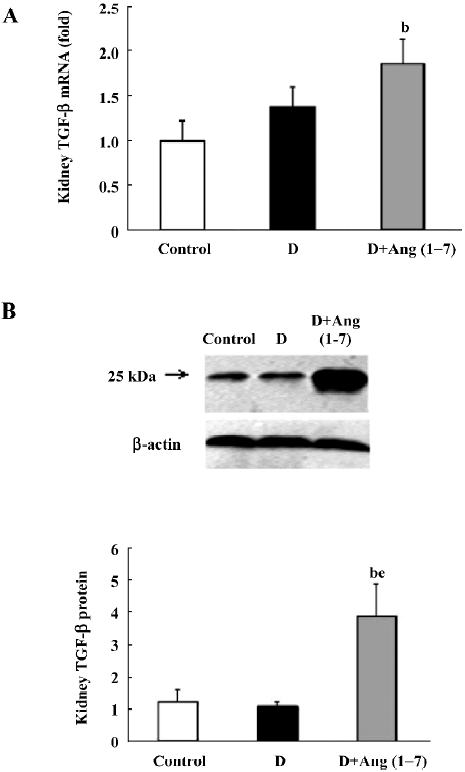
TGF-β1 mRNA and protein expression As shown in Figure 4A, there was an increase in TGF-β1 mRNA levels in the diabetic rats compared with the control rats, although this did not reach statistical significance. The D+Ang (1–7) group showed a greater increase in TGF-β1 mRNA levels compared with the diabetic rats. With regard to the TGF-β1 protein expression, a similar pattern was shown in the TGF-β1 protein expression changes between the diabetic and control rats, as shown in Figure 4B, but the D+Ang (1–7) rats showed a significant increase in the TGF-β1 protein expression compared with the control and diabetic rats.
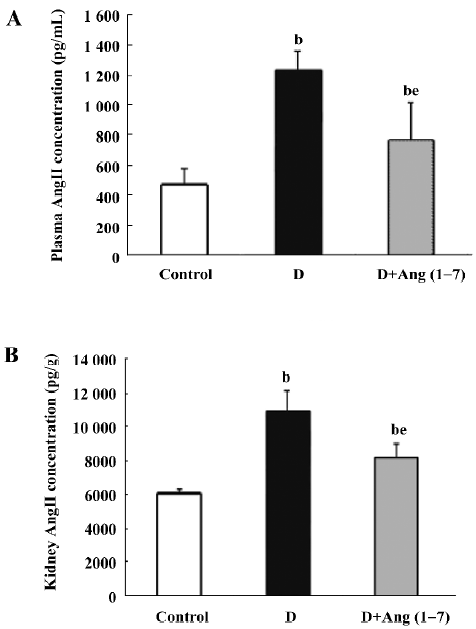
Plasma and kidney Ang II levels In the STZ diabetic rats, plasma Ang II levels increased compared with the control rats, and showed significant difference (control: 467±108 vs diabetic: 1229.9±134.6 pg/mL). After Ang (1–7) injection, the Ang II levels decreased compared with the diabetic rats (D+Ang1–7: 747.7±254 vs diabetic: 1229.9±134.6 pg/mL, P<0.05), but it was still higher than the control rats (P<0.05). Similarly, whole kidney Ang II levels in the diabetic rats were higher than the kidney levels in the control rats (control: 6126.7±183.9 vs diabetic: 10892±1220.1 pg/g). The kidney Ang II levels in the Ang (1–7)-treated group decreased relative to the diabetic rats (Figure 5).
Discussion
It has been widely reported that RAS is implicated in hemodynamic maladaptations of the diabetic kidney[21,22,28], and the changes of ACE, ACE2, as well as Ang II, have been investigated in STZ-induced diabetic rats[23–25]. Previous investigations have shown that Ang (1–7) serves a protective role by counteracting the effects of locally-generated Ang II in cardiovascular research[26]. In some cardiovascular diseases, the increased Ang (1–7) levels may serve some role in treatments with ACE inhibitors or AT1 receptor antagonists[19,20]. However, no studies have focused on the effects of Ang (1–7) treatment on diabetes.
In the present study, we used the STZ-induced diabetic model to investigate the effect of sustaining a vein injection of exogenous Ang (1–7) on renal function. All diabetic rats showed an increase in plasma glucose, a decrease in body weight, and an increase in kidney body weight proportion. With regard to the renal function guidelines, the 24 h urine protein, serum BUN, and serum creatinine all showed a significant increase after 12 weeks. In diabetic rats injected with Ang (1–7) for 9 weeks, parallel to each other, the extent of the body weight decreases and increases of kidney body weight ratios were significantly different from those of the diabetic rats. The 24 h urine protein, serum BUN, and serum creatinine levels increased much more than that of diabetic rats. These data suggest that the Ang (1–7) vein injection caused a further deterioration of the renal function in diabetic rats rather than amelioration.
Elevated TGF-β1 was considered an indicator of renal damage in multiple pathological conditions. Previous reports have proven that overactivity of the TGF-β1 system in the kidney is a crucial mediator of diabetic renal hypertrophy and mesangial matrix expansion[18], and treatment of diabetic mice with neutralizing anti-TGF-β1 antibodies prevents the development of renal hypertrophy, mesangial matrix expansion, and a decline in renal function[27]. In our experiments, the change in TGF-β1 levels was consistent with that in renal function. In Ang (1–7)-treated diabetic rats, TGF-β1 showed dramatic increases both in mRNA and protein levels when compared with non-treated rats.
In the present study, we also observed the ACE mRNA level. The ACE mRNA level significantly decreased in diabetic rats compared with the control rats. This result was consistent with previous observations, which suggested that the ACE level might be downregulated by a compensatory mechanism of negative feedback. In the Ang (1–7) group, however, the decrease in ACE was significantly attenuated; the ACE2 mRNA expression significantly decreased compared with the diabetic rats. Taking into account the metabolic pathways of RAS, ACE determines both the production of Ang II and the degradation of Ang (1–7), whereas ACE2, by facilitating the conversion of Ang II into Ang (1–7), plays a key role in the production of Ang (1–7). Although ACE can also induce Ang (1–7) formation by acting on Ang I as a substrate, this pathway is relatively minor as compared with the ACE2-inducing Ang (1–7) formation pathway[7,8]. According to our data, it seems possible that with the exogenous Ang (1–7) vein injection, the increased plasma Ang (1–7) concentration may inhibit the local ACE2 expression in the kidney, and the increased plasma Ang (1–7) concentration may accelerate the ACE effect via increasing its expression.
Most of the effects of Ang II in the renal and cardiovascular systems are dominated by AT1 receptors[29-32]. In the kidney, AT1 receptors are abundant in vascular smooth muscle cells, endothelium, glomerular mesangial cells, podocytes, tubular cells, and medullary interstitial cells[33–36]. In contrast, the AT2 receptor was only highly expressed in the fetal kidney and dramatically decreased after birth[34]. A series of studies have shown that AT2 receptors are linked to the stimulation of intrarenal nitric oxide formation[37]. The decreased renal expression of AT2 receptors may result in an amplification of AT1-mediated effects, including promoting enhanced tubular sodium reabsorption, cell proliferation, and hypertrophy[38,39]. All these changes will contribute to increased nephric injury. In our study, the mRNA levels of AT1 and AT2 receptors showed a decrease in STZ diabetic rats, which is in agreement with other reports[40,41]. In the D+Ang (1–7) rats, however, AT1 receptors recovered, as compared with the diabetic control rats, while AT2 receptors exhibited a further decrease. As AT2 receptor stimulation might account for part of the renal protection by balancing the effect of AT1[39,41], the dramatically reduced AT2 receptor, in combination with the partially recovered AT1 receptor, might explain the accelerating effect by the Ang (1–7) injection on renal function deterioration in the experiment.
Mas is the specific receptor of Ang (1–7). Ang (1–7) counteracts many of the cardiovascular and renal effects of Ang II through acting on Mas receptors. Previous reports have indicated that Mas, a G-protein-coupled receptor, may act as a physiological antagonist of the AT1 receptor. Mas may cause heterooligomerization between AT1 and Mas receptors. The formation of the AT1–Mas receptor complex resulted in the inhibition of Ang II actions[42]. In the experiment, it was found that Mas receptors decreased significantly in diabetic rats when compared to controls, and a further decrease occurred in the Ang (1–7)-injected group. The downregulation of the Mas receptor may severely limit the biological actions of Ang (1–7).
Generally, in the present study, Ang (1–7) did not play a role in postponing the kidney damage as expected; it showed further kidney damage. Many important components in RAS were resettled following Ang (1–7) administration, including changes in local tissue after the exogenous chronic administration of Ang (1–7), and the local RAS shift and resulting acceleration in renal function retrogression, both of which still need further exploration.
References
- Unger T, Culman J, Gohlke P. Angiotensin II receptor blockade and end-organ protection: pharmacological rationale and evidence. J Hypertens 1998;16 Suppl 7:S3-9.
- Zimpelmann J, Kumar D, Levine DZ, Wehbi G, Imig JD, Navar LG, et al. Early diabetes mellitus stimulates proximal tubule renin mRNA expression in the rat. Kidney Int 2000;58:2320-30.
- Wehbi GJ, Zimpelmann J, Carey RM, Levine DZ, Burns KD. Early streptozotocin–diabetes mellitus downregulates rat kidney AT(2) receptors. Am J Physiol Renal Fluid Electrolyte Physiol 2001;280:F254-65.
- Gilbert RE, Cox A, Wu LL, Allen TJ, Hulthen L, Jerums G, et al. Expression of transforming growth factor-β1 and type IV collagen in the renal tubulointerstitium in experimental diabetes: effects of angiotensin converting enzyme inhibition. Diabetes 1998;47:414-22.
- Brenner BM, Cooper ME, de Zeeuw D, Keane WF, Mitch WE, Parving HH, et al. Effects of losartan on renal and cardiovascular outcomes in patients with type 2 diabetes and nephropathy. N Engl J Med 2001;345:861-9.
- Lewis EJ, Hunsicker LG, Clarke WR, Berl T, Pohl MA, Lewis JB, et al. Renoprotective effect of the angiotensin receptor antagonist irbesartan in patients with nephropathy due to type 2 diabetes. N Engl J Med 2001;345:851-60.
- Donoghue M, Hsieh F, Baronas E, Godbout K, Gosselin M, Stagliano N, et al. A novel angiotensin-converting enzyme-related carboxypeptidase (ACE2) converts angiotensin I to angiotensin 1–9. Circ Res 2000;87:E1-9.
- Tipnis SR, Hooper NM, Hyde R, Karran E, Christie G, Turner AJ. A human homolog of angiotensin-converting enzyme: cloning and functional expression as a captopril-insensitive carboxypeptidase. J Biol Chem 2000;275:33238-43.
- Vickers C, Hales P, Kaushik V, Dick L, Gavin J, Tang J, . Hydrolysis of biological peptides by human angiotensin-converting enzyme-related carboxypeptidase. J Biol Chem 2002; 277: 14 838–43.
- Harmer D, Gilbert M, Borman R, Clark KL. Quantitative mRNA expression profiling of ACE2, a novel homologue of angiotensin converting enzyme. FEBS Lett 2002;532:107-10.
- Tikellis C, Johnston CI, Forbes JM, Burns WC, Burrell LM, Risvanis J, et al. Characterization of renal angiotensin-converting enzyme 2 in diabetic nephropathy. Hypertension 2003;41:392-7.
- Lely AT, Hamming I, van Goor H, Navis GJ. Renal ACE2 expression in human kidney disease. J Pathol 2004;204:587-93.
- Soulis-Liparota T, Cooper M, Papazoglou D, Clarke B, Jerums G. Retardation by aminoguanidine of development of albuminuria, mesangial expansion, and tissue fluorescence in streptozocin-induced diabetic rat. Diabetes 1991;40:1328-34.
- Strawn WB, Ferrario CM, Tallant EA. Angiotensin2(127) reduces smooth muscle growth after vascular injury. Hypertension 1999;33:207-11.
- García-Villalba P, Denkers ND, Wittwer CT, Hoff C, Nelson RD, Mauch TJ. Real-time PCR quantification of AT1 and AT2 angiotensin receptor mRNA expression in the developing rat kidney. Nephron Exp Nephrol 2003;94:E154-9.
- Bonnet F, Cooper ME, Kawachi H, Allen TJ, Boner G, Cao Z. Irbesartan normalises the deficiency in glomerular nephrin expression in a model of diabetes and hypertension. Diabetologia 2001;44:874-7.
- Fox J, Guan S, Hymel AA, Navar LG. Dietary Na and ACE inhibition effects on renal tissue angiotensin I and II and ACE activity in rats. Am J Physiol 1992;262:F902-9.
- Ziyadeh FN, Hoffman BB, Han DC, Iglesias-De La Cruz MC, Hong SW, Isono M, et al. Long-term prevention of renal insufficiency, excess matrix gene expression, and glomerular mesangial matrix expansion by treatment with monoclonal antitransforming growth factor-β antibody in db/db diabetic mice. Proc Natl Acad Sci USA 2000;97:8015-20.
- Santos JC, Jerez S, Peral De Bruno M, Coviello A. Angiotensin-(1–7) increases osmotic water permeability in isolated toad skin. Braz J Med Res 2000;33:1099-104.
- Stegbauer J, Vonend O, Oberhauser V, Rump LC. Effects of angiotensin (1–7) and other bioactive components of the renin - angiotensin system on vascular resistance and noradrenaline release in rat kidney. J Hypertens 2003;21:1391-9.
- Kennefick TM, Oyama TT, Thompson MM, Vora JP, Anderson S. Enhanced renal sensitivity to angiotensin actions in diabetes mellitus in the rat. Am J Physiol 1996;271:595-602.
- Muller C, Endlich K, Helwig JJ. Role of eicosanoids in renal angiotensin II vasoconstriction during nitric oxide blockade. Kidney Int 1998;54 Suppl 67:S234-7.
- Suzuki Y, Matsumura Y, Egi Y, Morimoto S. Effects of losartan, a non peptide angiotensin II receptor antagonist, on norepinephrine overflow and antidiuresis induced by stimulation of renal nerves in anesthetized dogs. J Pharmacol Exp Ther 1992;263:956-63.
- Pieper GM. Enhanced, unaltered and impaired nitric oxide-mediated endothelium-dependent relaxation in experimental diabetes mellitus: importance of disease duration. Diabetologia 1999;42:204-13.
- Hopfner RL, McNeill RJ, Gopalakrishnan V. Plasma endothelin level and vascular responses at different temporal stages of streptozotocin diabetes. Eur J Pharmacol 1999;374:221-7.
- Roks AJ, van Geel PP, Pinto YM, Buikema H, Henning RH, de Zeeuw D, et al. Angiotensin-(1-7) is a modulator of the human renin angiotensin system. Hypertension 1999;34:296-301.
- Russo LM, del Re E, Brown D, Lin HY. Evidence for a role of transforming growth factor (TGF)-beta1 in the induction of postglomerular albuminuria in diabetic nephropathy: amelioration by soluble TGF-beta type II receptor. Diabetes 2007;56:380-8.
- Anderson S, Jung FF, Ingelfinger JR. Renal renin-angiotensin system in diabetes: functional, immunohistochemical, and molecular biological correlations. Am J Physiol 1993;265:F477-86.
- de Gasparo M, Levens NR. Pharmacology of angiotensin II receptors in the kidney. Kidney Int 1994;46:1486-91.
- Douglas JG, Hopfer U. Novel aspect of angiotensin receptors and signal transduction in the kidney. Annu Rev Physiol 1995;56:649-69.
- Edwards RM, Aiyar N. Angiotensin II receptor subtypes in the kidney. J Am Soc Nephrol 1993;3:1643-52.
- Timmermans PB, Benfield P, Chiu AT, Herblin WF, Wong PC, Smith RD. Angiotensin II receptors and functional correlates. Am J Hypertens 1992;5:406-10.
- Harrison-Bernard LM, Navar LG, Ho MM, Vinson GP, el-Dahr SS. Immunohistochemical localization of ANG II AT1 receptor in adult rat kidney using a monoclonal antibody. Am J Physiol Renal Physiol 1997;273:F170-7.
- Shanmugam S, Llorens-Cortes C, Clauser E, Corvol P, Gasc JM. Expression of angiotensin II AT2 receptor mRNA during development of rat kidney and adrenal gland. Am J Physiol Renal Fluid Electrolyte Physiol 1995;268:F922-30.
- Sharma M, Sharma R, Greene AS, McCarthy ET, Savin VJ. Documentation of angiotensin II receptors in glomerular epithelial cells. Am J Physiol Renal Physiol 1998;274:F623-37.
- XZhuo J. Maric C, Harris PJ, Alcorn D, Mendelsohn FA. Localization and functional properties of angiotensin II AT1 receptors in the kidney: focus on renomedullary interstitial cells. Hypertens Res 1997;20:233-50.
- Siragy HM, Carey RM. The subtype-2 (AT2) angiotensin receptor regulates renal cyclic guanosine 39, 59-monophosphate and AT1 receptor-mediated prostaglandin E2 production in conscious rats. J Clin Invest 1996;97:1978-82.
- Maric C, Aldred GP, Harris PJ, Alcorn D. Angiotensin II inhibits growth of cultured embryonic renomedullary interstitial cells through the AT2 receptor. Kidney Int 1998;53:92-9.
- Nakajima M, Hutchinson HG, Fujinaga M, Hayashida W, Morishita R, Zhang L, et al. The angiotensin II type 2 (AT2) receptor antagonizes the growth effects of the AT1 receptor: gain-of-function study using gene transfer. Proc Natl Acad Sci USA 1995;92:10663-7.
- Rice GI, Thomas DA, Grant PJ, Turner AJ, Hooper NM. Evaluation of angiotensin-converting enzyme (ACE), its homologue ACE2 and neprilysin in angiotensin peptide metabolism. Biochem J 2004;383:45-51.
- Wehbi GJ, Zimpelmann J, Carey RM, Levine DZ, Burns KD. Early streptozotocin-diabetes mellitus downregulates rat kidney AT2 receptors. Am J Physiol Renal Physiol 2001;280:F254-65.
- Kostenis E, Milligan G, Christopoulos A, Sanchez-Ferrer CF, Heringer-Walther S, Sexton PM, et al. G-protein-coupled receptor Mas is a physiological antagonist of the angiotensin II type 1 receptor. Circulation 2005;111:1806-13.
- Yamada K, Iyer SN, Chappell MC, Ganten D, Ferrario CM. Converting enzyme determines plasma clearance of angiotensin-(1–7). Hypertension 1998;32:496-502.
- Luque M, Martin P, Martell N, Fernandez C, Brosnihan KB, Ferrario CM. Effects of captopril related to increased levels of prostacyclin and angiotensin-(1–7) in essential hypertension. J Hypertens 1996;14:799-805.
- Chappell MC, Pirro NT, Sykes A, Ferrario CM. Metabolism of angiotensin-(1–7) by angiotensin-converting enzyme. Hypertension 1998;31:362-7.
- Brosnihan KB, Li P, Ferrario CM. Angiotensin-(1–7) dilates canine coronary arteries through kinins and nitric oxide. Hypertension 1996;27:523-8.
- Benter IF, Ferrario CM, Morris M, Diz I. Antihypertensive actions of angiotensin-(1–7) in spontaneously hypertensive rats. Am J Physiol 1995;269:H313-9.
- Freeman EJ, Chisolm G, Ferrario CM, Tallant EA. Angiotensin-(1–7) inhibits vascular smooth muscle cell growth. Hypertension 1996;28:104-8.