
Identification of chronic myocardial infarction with extracellular or intravascular contrast agents in magnetic resonance imaging
Introduction
The reliable assessment of the extent and location of chronic myocardial infarction is of considerable clinical importance in proper therapeutic planning and the evaluation of prognosis. The transmural extent of chronic myocardial infarction explained by magnetic resonance imaging (MRI) was closely related to the likelihood of improvement in contractile function after revascularization[1,2]. Although chronic myocardial infarction can be detected using non-contrast-enhanced T2-weighted imaging [3], the advent of contrast agents facilitates the detection of myocardial infarction for enhanced signal intensity and improved tissue contrast. After the administration of contrast agents, 2 distinct phase of contrast enhancement are apparent. The first-pass phase, occurring within the first 60–90 s, serves as a marker of myocardial perfusion in tissue levels. The subsequent delayed enhancement phase depends principally on the enlarged contrast distribution volume to enhance the infracted myocardium.
The first-pass kinetics of contrast agents depend principally on regional blood flow and intravascular volume. Temporal or permanent interruption of blood supply is the main cause of myocardial infarction formation. Vasculature in risk regions might be damaged or obstructed owing to ischemic insult or arterial reperfusion injury. Decreased blood flow and impaired vasculature greatly affect first-pass kinetics of agents through damaged myocardium, resulting in the differential magnitude of first-pass enhancement between normal and infarcted myocardium. Previous studies suggested that a decrease in the T2* signal intensity was less pronounced in ischemic myocardium than in normal myocardium of the acute reperfused infarction model[4,5]. This was because acute ischemic reperfusion produced widespread microvasular damage characterized by microvascular obstruction due to erythrocytes stasis, neutrophils accumulation, and endothelial cell swelling[6,7]. Furthermore, first-pass perfusion has been demonstrated to depict 5 d-old occlusive infarction as a perfusion defect[8]. However, pathological changes associated with chronic scarred myocardium differ from these in acute reperfusion myocardial infarction, and at early stage of occlusive infarction, collateral circulation formation and vascular reconstruction occur in chronic scarred myocardium. To our knowledge, little work was carried out to characterize the first-pass perfusion patterns in chronic scarred myocardium.
The delayed enhancement pattern depends on the properties of contrast agents, vascular permeability, and the accessibility of intracellular compartments. Extracellular agents distribute rapidly into interstitial space due to low molecular weight. The loss of cell membrane integrity allows extracellular agents to enter the intracellular space, which results in an increased distribution volume of contrast agents in the infarcted region[9,10]. In contrast, intravascular agents are retained in the vasculature of normal myocardium; however, microvascular damage within infarcted regions permits the leakage of high molecular weight contrast agents into interstitial spaces[11,12]. An increased distribution of intravascular agents had been confirmed in microvascular hyperpermeable regions corresponding to the territory of acute reperfused infarction[13]. The loss of cell membrane integrity and hyperpermeability of remaining vessels might coexist with scarred myocardium. As a result, both extracellular and intravascular agents might have the potential to detect chronic scars. To our knowledge, the use of both types of contrast agents to characterize the delayed enhancement of scarred myocardium has not been attempted.
Gadolinium diethylenetriamine pentaacetic acid (Gd-DTPA) is currently the only extracellular contrast agent approved for clinical practice. P792 belongs to new macromolecular gadolinium-based macromolecules. In comparison with other gadolinium-based macromolecules, P792 binds only to a single gadolinium chelate in each molecule. However, P792 has the highest relaxivity relative to the concentration of gadolinium[14]. Moreover, P792 allows for the improvement of coronary magnetic resonance (MR) angiography[15]. If P792 could additionally depict scarred infarction, this would make them suitable for a comprehensive cardiac MR examination. Therefore, P792 was selected as a representative of intravascular contrast agents in this study.
Materials and methods
The animals used in this study received humane care in compliance with the Guide to the Care and Use of Experimental Animals formulated by the Canadian Council on Animal Care. The Animal Care Committee of the Institute of Biodiagnostics (National Research Council, Winnipeg, Manitoba, Canada) approved the experimental protocols of this study.
Pig model of chronic scarred myocardium Eighteen domestic pigs weighing 22.3±3.4 kg were sedated with an intramuscular injection of diazepam (0.4 mg/kg body weight) and ketamine (20 mg/kg body weight). After the induction of anesthesia, the pigs were intubated and ventilated. Using a sterile technique, a lateral thoracotomy was performed at the fourth left intercostals space to expose the heart, and the pericardium was opened. The first and second diagonal branch of the left anterior descending coronary artery was permanently ligated at their origin. The chests were closed and the animals were allowed to recover for 4 weeks for the development of chronic scarred myocardium.
Isolated pig heart preparation At the end of the 4 week recovery period, the animal chests were reopened under a general anesthesia. The pericardium was opened longitudinally along the midline. The aorta and pulmonary artery, and inferior and superior vena cava were dissected and clamped. Cold (-4 °C) cardioplegia was infused into the aortic root to arrest the heart. The heart was quickly excised and immersed in cold saline solution for instrumentation. The brachiocephalic artery and subclavian artery were cannulated for the achievement of antegrade perfusion and the measurement of antegrade pressure. A mixture of autogenous blood and modified Krebs-Henseleit solution in a 1:1 ratio was used to perfuse the hearts. The hematocrit of the mixture was 11%–13%. The concentrations of potassium and magnesium in the perfusion medium were each adjusted in 16 mmol/L to keep the hearts quiescent throughout the imaging period. The pH value and temperature of the perfusate were maintained at pH 7.4±0.5 and 37±0.5 °C, respectively.
Experimental protocol After removal from the animals, the pig hearts were suspended vertically in Helmholtz coil that was positioned in the center of a 7T magnet. To prevent air-tissue interface artifact on the T2*-weighted images, the pig hearts were immersed in the perfusion medium during the images study. The heart was perfused at a perfusion pressure of 60 mmHg.
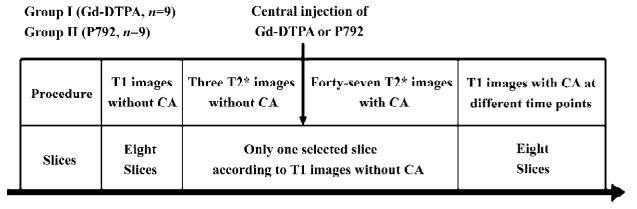
Several sets of 9 T1-weighted images were first performed without contrast agents with an inversion recovery-prepared TurboFLASH sequence (Bruker, Karlsruhe, Germany), which included 9 inversion times. After this sequence was started and the 9 inversion times were utilized, 9 T1-weighted images were automatically and sequentially acquired as a group during the period of 1 acquisition approximating 53 s, and each T1 image corresponded to 1 inversion time. The first 4 sets of T1 images were discarded to allow the equilibrium of saturation effects. Eight slices were selected to cover the longitudinal axis of the heart. A set of 9 T1-weighted images was once obtained only at a specific slice using this sequence, which included 9 inversion times. Therefore, 8 sets of T1 images were initially acquired at 8 different slices. This slice, with significant thinning of the ventricular wall, was believed to be the proper orientation following T2* first-pass images. Afterward, the first 3 T2* images were acquired using a FLASH gradient echo sequence. The contrast agent was administered as a central arterial bolus after the third image. The pig hearts in groups I (n=9) and II (n=9) were subjected to the injection of Gd-DTPA (0.05 mmol/kg body weight; Magnevist, Berlex, Canada) and P792 (15 mmol/kg body weight) (Vistarem, Guerbet, France), respectively. A set of a total 50 T2* images were acquired to monitor the first pass of contrast agents. Then, contrast agent-enhanced T1-weighted images were acquired at 5, 15, 25, 35, 45, and 55 min after administration of contrast agents. The experimental protocols are illustrated in Figure 1.
The hearts were removed and sectioned for tripheny-ltetrazolium chloride (TTC) staining. The hearts were sectioned according to T1 scout image (long cardiac axis) to ensure a correlation to the MR images. The TTC-stained slices were photographed and compared directly with the MR images obtained at the same level for selecting the regions of interest (ROI). The ROI were obtained from the non-ischemic posterior ventricular wall (which is not within the territory of the ligated coronary artery) and chronic scarred anterolateral ventricular wall with significant thinning, respectively. The coordinates of the ROI were placed in the midmyocardial layer to avoid partial volume effects with the adjacent regions. The observers analyzing the signal intensity were blinded to the treatment of the animals.
MRI The MRI studies were performed on a 7T 40 cm horizontal bore magnet equipped with a Bruker Avance console system (Bruker, Karlsruhe, Germany). The MR images were acquired with a Helmholtz coil.
Monitoring T2* signal intensity was performed using a FLASH sequence during the first pass of contrast agents. The sequence parameters were as follows: matrix, 128×128; field of view, 120×120 mm; slice thickness, 3 mm; flip angle, 8°, echo time, 15 ms; acquisition time, 1815.16 ms; repetition time, 26 ms. All MR images were acquired from the arrested hearts to eliminate motion artifact.
Regular T1-weighted images were acquired with an inversion recovery prepared TurboFLASH sequence. This sequence was specifically designed to minimize T2* effect by use of a short echo time (3.6 ms). A set of 9 T1-weighted images were obtained with 9 different inversion times (10, 100, 200, 400, 700, 1200, 2000, 5000, and 10 000 ms). All T1 images were acquired from a 5 mm thick slice with a 120×120 mm field of view and imager matrix size of 128×128. It took 53 s to acquire a set of 9 T1 images.
MRI data analysis Image data were processed using the Marevisi software package (NRC Institute for Biodiagnostics, Winnipeg, Canada). Round, hand-drawn ROI were created by correlating the MR images to the TTC-stained references.
T2* time intensity curves were obtained from 50 consecutive perfusion images using the Marevisi software. For 1 slice, 2 curves for normal and scar myocardium were generated to represent the characteristic passage of contrast agents. The T1 image acquired with inversion time (1200 ms) was utilized to analyze signal intensity before and after contrast administration, since an inversion time of 1200 ms was thought to be able to null the signal intensity from normal myocardium before contrast administration[16]. In this specific T1 image, T1 signal intensity was measured in scarred and normal myocardium before the contrast agents and different time points afterward.
Statistical analyses All numerical results were presented as mean±SD. Statistical analysis was performed using Statistica (Statsoft, Tulsa, OK, USA). The initial T1 or T2* signal intensity of normal myocardium was considered as 100% baseline value. Alterations in T1 or T2* signal intensity were expressed as a percentage of 100% baseline value. One-way ANOVA was used to compare T2* and T1 signal intensity among different time points within normal or scarred myocardium. Student’s t-test was used to compare T2* and T1 signal intensity between normal and scarred myocardium at each time point. A value of P<0.05 was considered to indicate significance.
Results
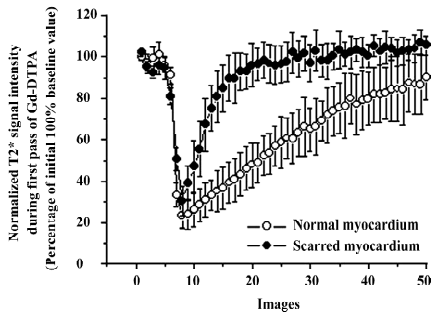
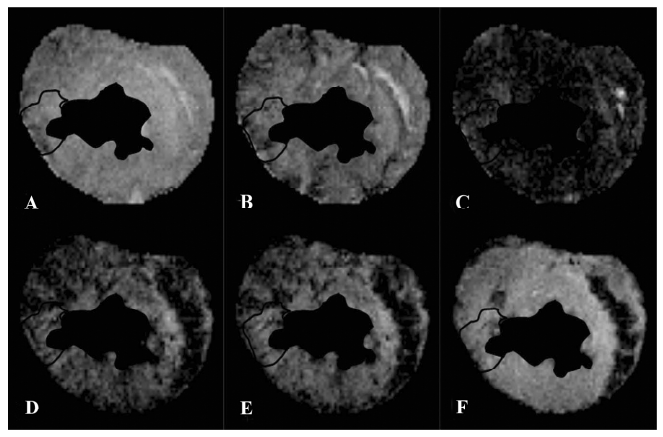
T2* images and time intensity curves during the first pass of extracellular contrast agents T2* signal decrease in scarred myocardium was almost equivalent to that in normal myocardium during the wash-in of this agent (Figure 2). T2* signal intensity of scarred and normal myocardium decreased from 94.5%±5.4% to 30.6% ±7.1%, and from 96.1%±3.6% to 23.5%±6.0% relative to the initial control value, respectively. The wash-in of contrast agents resulted in a similar peak effect on T1 signal intensity of normal myocardium (30.6%±7.1%) and the scarred infarction (23.5%±6.0%; P=0.064; Figure 2). Wash-out of extracellular agents resulted in a rapid and complete T2* signal recovery, whereas a slow and sluggish T2* signal recovery was observed in normal myocardium (Figure 2). Therefore, scarred myocardium was indistinguishable from normal myocardium at the peak T2* imaging. The rapid and complete wash-out of extracellular agents produced a hyperenhancement in scarred myocardium compared with normal myocardium (Figure 3).
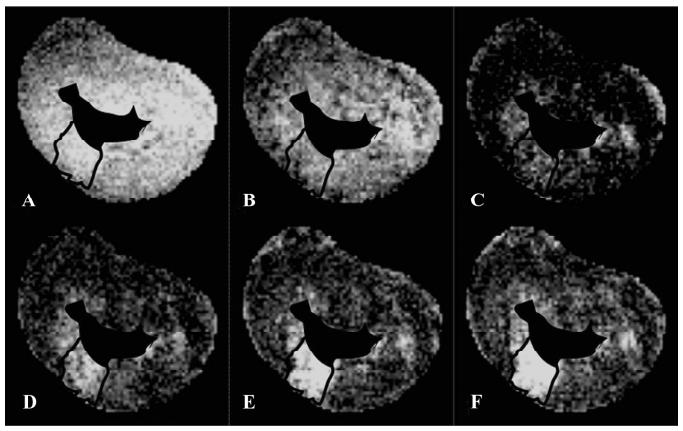
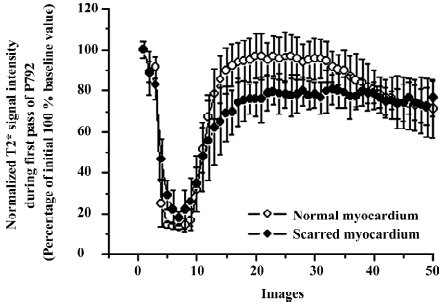
T2* images and time intensity curves during the first pass of intravascular contrast agents Wash-in of intravascular agents resulted in a rapid and uniform decrease in T2* signal intensity in both scarred and normal myocardium (Figure 4). T2* signal intensity of scarred and normal myocardium decreased from 88.5%±10.5% to 18.1%±3.1%, and from 89.1%±5.2% to 14.5%±3.4% relative to the initial control value, respectively. The magnitude of T2* signal decrease in scarred infarction (18.1%±3.1%) was comparable to that in the normal myocardium (14.5%±3.4%; P=0.093; Figure 4). Wash-out of intravascular agents from scarred and normal myocardium, as reflected by a recovery in T2* signal intensity, occurred simultaneously (Figure 4), although some degree of difference in T2* signal intensity between scarred and normal myocardium was also observed immediately after T2* signal intensity recovered to plateau (Figure 4). However, the discrepancy appeared to be insufficient to produce a visible hyperenhancement in T2* images acquired during first pass of intravascular agents (Figure 5).
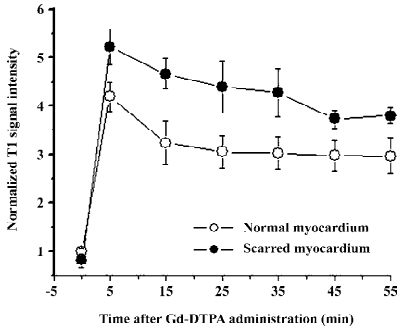
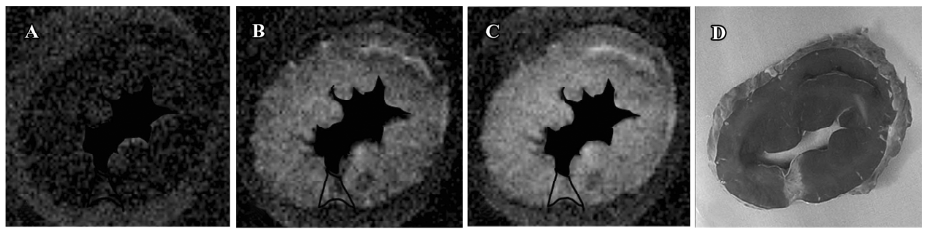
T1-weighted images at the equilibrium of extracellular contrast agents No significant difference in T1 signal intensity existed between normal and scarred myocardium prior to the injection of extracellular agents (100%±5% vs 91%±15%; P=0.34). The administration of agents resulted in a differential extent of delayed enhancement in both regions. T1 signal intensity of scarred myocardium ranged from 520%±60% to 380%±10% of the initial control value for different time points post-injection and was significantly higher than that observed in normal myocardium, ranging from 410%±50% to 210%±30% of the initial control value (P=0.0028; Figure 6). Therefore, scarred myocardium with thinning of the ventricular wall exhibited delayed hyperen-hancement in extracellular agent-enhanced T1 images (Figure 7).
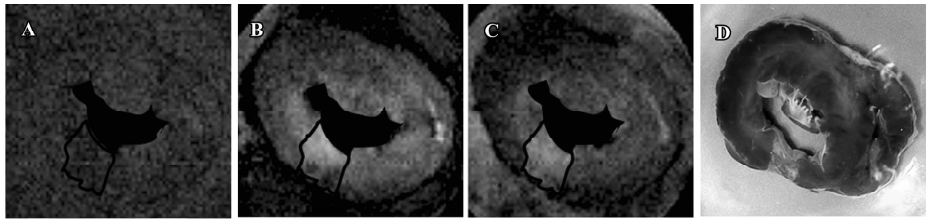
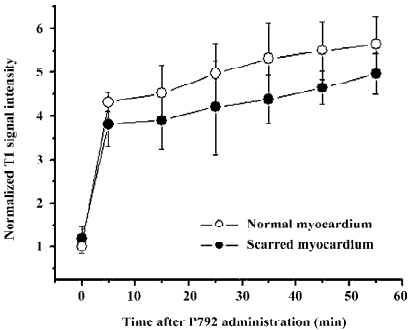
T1-weighted images at the equilibrium of intravascular contrast agents The precontrast T1 signal intensity of normal and scarred myocardium did not differ significantly (100%±10% vs 108%±20%; P=0.76). The steady state of intravascular agents resulted in a similar extent of delayed enhancement in scarred and normal myocardium. T1 signal intensity of scarred myocardium ranged from 380%±50% to 490%±40% of the initial control value for different time points post-injection and was not statistically different from that observed in normal myocardium, ranging from 430%±10% to 560%±60% of the initial control value (P=0.094; Figure 8). Therefore, intravascular agent-enhanced T1 images exhibited the homogeneous enhancement patterns between normal and scarred myocardium (Figure 9).
Discussion
The pathological changes of myocardial infarction greatly affect the first-pass and delayed enhancement patterns. Previously, more attempts had been made to depict the first-pass and delayed enhancement pattern of acute reperfused myocardial infarction. However, differential MRI patterns might occur in scarred myocardium, since pathological changes in scarred myocardium differ from that in acute reperfused myocardial infarction. Moreover, the properties of contrast agents are closely related to their passage through jeopardized myocardium and late delayed distribution. Therefore, the first-pass and delayed enhancement patterns of scarred myocardium were investigated using 2 major types of intravascular and extracellular contrast agents.
The entry of contrast agents into myocardium creates a heterogeneous gradient across the capillary wall, resulting in the loss of T2* signal intensity. The influx of contrast agents displays a reverse relationship with T2* signal intensity during first pass. The T2* signal drop within or across a myocardial region is caused by spin dephasing during the rapid passage of contrast agents through the regional vascular bed. The signal decrease can be used to compute the relative perfusion to that region. An analysis of time intensity curves and first-pass images could reflect regional variations in myocardial blood flow[17,18]. Two T2* time intensity curves and corresponding first-pass images were observed in 1 month-old scarred myocardium using intravascular or extracellular agents. After the rapid bolus of both kinds of agents, a rapid and dramatic decline in T2* signal intensity was observed in both normal and scarred myocardium due to wash-in of each agent. The fact that T2* signal decrease in scarred myocardium was almost equivalent to that in normal myocardium during the wash-in of both agents was of considerable importance, because it strongly indicated that occurrence and development of intramyocardial collateral circulation resulted in a significant restoration of regional blood flow in scarred myocardium which should be responsible for the delivery of most contrast agents into scarred myocardium.
Contrary to first-pass images and time intensity curves obtained during wash-in of extracellular agents, differential patterns between scarred and normal myocardium occurred in first-pass images and time intensity curves acquired during wash-out of extracellular agents. T2* signal intensity of scarred myocardium rapidly returned to baseline value due to fast and complete wash-out of extracellular agents, whereas normal myocardium displayed a slow and sluggish T2* signal recovery. As a result, scarred myocardium displayed a hyperenhancement in wash-out T2* images compared to normal myocardium. However, the wash-out patterns of intravascular agents were different from that of extracellular agents. T2* signal intensity rapidly recovered to plateau in both scarred and normal myocardium due to rapid wash-out of intravascular agents. Although some degree of T2* signal difference existed in this phase of plateau, corresponding wash-out images appeared not to reflect this T2* signal difference measured in the plateau phase. Wash-out kinetics of agents was relevant to many factors, including coronary blood flow, capillary permeability, and functional capillary density[19]. As mentioned above, the interpretation of wash-in kinetics of both agents was indicative of the significant restoration of regional blood flow achieved by the formation of collateral circulation. A marked collateral network had been observed to cause regional flow to increase 14-fold at 3–4 week post-occlusion relative to initial occlusion[20] and approached normal levels within 3–7 weeks’ post-occlusion[21]. However, the vast majority of capillaries disappeared within 3 weeks after infarction, whereas many dilated vessels containing at least 1 layer of smooth muscle cells persisted in scarred myocardium[22]. The average area occupied by vessels did not change between scarred and normal myocardium[23]. It is well known that extravasations of extracellular agents into the interstitium mainly occur in capillaries rather than vessels with a smooth muscle cell layer. Therefore, decreased density of capillaries in scarred myocardium did not permit the majority of extracellular agents to leak into the interstitium. It usually takes 30–60 s for contrast agents to escape the scarred myocardium during the first pass. Therefore, the wash-out of contrast agents was so short that the interaction between contrast agents and decreased capillaries was limited. Moreover, significant recovery in regional blood flow rapidly propelled the majority of extracellular contrast agents out of scarred myocardium. In contrast, extracellular agents distribute into the interstitial space of normal myocardium during wash-out, producing a heterogeneous gradient across the cell membrane leading to a slow and incomplete T2* signal recovery.
Aside from first-pass perfusion images, contrast enhancement patterns in chronic scarred myocardium were assessed using an inversion recovery-prepared TurboFLASH sequence at the equilibrium of extracellular and intravascular agents. Two distinct contrast enhancement patterns were observed with intravascular and extracellular contrast agents. Scarred myocardium exhibited a hyperenhancement in extracellular agent-enhanced T1 images. This was consistent with previous research which demonstrated that chronic myocardial infarction appeared to be hyperenhanced in conjunction with extracellular agents[24,25]. The increased T1 signal intensity of scarred myocardium reflects an enlarged distribution volume of extracellular agents resulting from the accessibility of a relatively larger extracellular compartment. In addition, there was evidence to suggest that the concentration of extracellular agents (Gd-DTAP) was elevated in chronic scarred myocardium showing delayed hyperenhancement[26]. Following a 4 week occlusion of the coronary artery, jeopardized myocardium were completely replaced by scarred myocardium, which was associated with the marked loss of cellularity[27] and the formation of discrete collagen meshwork[28]. A massive decrease in cellularity allows original intracellular space accessible to extracellular agents, since the intact cell membrane excludes these agents from the intracellular compartment. Moreover, the discrete collagen fiber meshwork preserves the integrity of scarred myocardium and provides extensive interstitial space available to extracellular agents. These pathological changes accompanying scarred myocardium might lay the structural foundation for increased distribution volume and the concentration of extracellular agents, eventually resulting in delayed enhancement of scarred myocardium. Unlike extracellular agents, intravascular agents exhibited homogeneous enhancement patterns in the entire regions, including scarred and normal myocardium. This reflected that scarred myocardium was not associated with the elevated permeability of microvasculature. This kind of agent is still confined in intravascular compartment of the scarred myocardium. Although a relatively enlarged interstitial space existed in scarred myocardium due to cardiomyocytes loss and discrete matrix deposition, the high molecular weight and intact microvascular integrity in scarred myocardium could not allow intravascular agents to enter the enlarged interstitial space and produce an increased distribution volume. As a result, homogeneous enhancement patterns between normal and scarred myocardium were obtained with intravascular agents.
In summary, scarred myocardium displayed a sharp and dramatic decrease in T2* signal intensity similar to the normal myocardium during wash-in of 2 kinds of contrast agents. However, the magnitude and velocity of T2* signal recovery were more pronounced in scarred myocardium than in normal myocardium during wash-out of extracellular agents. The retention of the T2* signal of normal myocardium caused scarred myocardium to have a relative hyperenhancement. At the following equilibrium, scarred myocardium was observed as hyperenhancement. In contrast, rapid and uniform wash-out of intravascular agent resulted in a hyperen-hancement of scarred myocardium similar to normal myocardium. Subsequently, homogeneous delayed enhancement between normal and scarred myocardium occurred at the steady state of intravascular agents.
References
- Kim RJ, Wu E, Rafael A, Chen EL, Parker MA, Simonetti O, et al. The use of contrast-enhanced magnetic resonance imaging to identify reversible myocardial dysfunction. N Engl J Med 2000;343:1445-53.
- Choi KM, Kim RJ, Gubernikoff G, Vargas JD, Parker M, Judd RM. Transmural extent of acute myocardial infarction predicts long-term improvement in contractile function. Circulation 2001;104:1101-7.
- McNamara MT, Higgins CB. Magnetic resonance imaging of chronic myocardial infarcts in man. AJR Am J Roentgenol 1986;146:315-20.
- Arteaga C, Revel D, Zhao S, Hadour G, Forrat R, Oksendal A, et al. Myocardial “low reflow” assessed by Dy-DTPA-BMA-enhanced first-pass MR imaging in a dog model. J Magn Reson Imaging 1999;9:679-84.
- Choi SI, Jiang CZ, Lim KH, Kim ST, Lim CH, Gong GY, et al. Application of breath-hold T2-weighted, first-pass perfusion and gadolinium-enhanced T1-weighted MR imaging for assessment of myocardial viability in a pig model. J Magn Reson Imaging 2000;11:476-80.
- Ambrosio G, Weisman HF, Mannisi JA, Becker LC. Progressive impairment of regional myocardial perfusion after initial restoration of postischemic blood flow. Circulation 1989;80:1846-61.
- Kloner RA, Ganote CE, Jennings RB. The “no-reflow” phenomenon after temporary coronary occlusion in the dog. J Clin Invest 1974;54:1496-508.
- Kroft LJ, Doornbos J, van der Geest RJ, de Roos A. Blood pool contrast agent CMD-A2-Gd-DOTA-enhanced MR imaging of infarcted myocardium in pigs. J Magn Reson Imaging 1999;10:170-7.
- Arheden H, Saeed M, Higgins CB, Gao DW, Bremerich J, Wyttenbach R, et al. Measurement of the distribution volume of gadopentetate dimeglumine at echo-planar MR imaging to quantify myocardial infarction: comparison with 99mTc-DTPA autoradiography in rats. Radiology 1999;211:698-708.
- Tong CY, Prato FS, Wisenberg G, Lee TY, Carroll E, Sandler D, et al. Measurement of the extraction efficiency and distribution volume for Gd-DTPA in normal and diseased canine myocardium. Magn Reson Med 1993;30:337-46.
- Schwitter J, Saeed M, Wendland MF, Derugin N, Canet E, Brasch RC, et al. Influence of severity of myocardial injury on distribution of macromolecules: extravascular versus intravascular gadolinium-based magnetic resonance contrast agents. J Am Coll Cardiol 1997;30:1086-94.
- Bremerich J, Wendland MF, Arheden H, Wyttenbach R, Gao DW, Huberty JP, et al. Microvascular injury in reperfused infarcted myocardium: noninvasive assessment with contrast-enhanced echoplanar magnetic resonance imaging. J Am Coll Cardiol 1998;32:787-93.
- Saeed M, van Dijke CF, Mann JS, Wendland MF, Rosenau W, Higgins CB, et al. Histologic confirmation of microvascular hyperpermeability to macromolecular MR contrast medium in reperfused myocardial infarction. J Magn Reson Imaging 1998;8:561-7.
- Port M, Corot C, Rousseaux O, Raynal I, Devoldere L, Idee JM, et al. P792: a rapid clearance blood pool agent for magnetic resonance imaging: preliminary results. MAGMA 2001;12:121-7.
- Taupitz M, Schnorr J, Wagner S, Kivelitz D, Rogalla P, Claassen G, et al. Coronary magnetic resonance angiography: experimental evaluation of the new rapid clearance blood pool contrast medium P792. Magn Reson Med 2001;46:932-8.
- Simonetti OP, Kim RJ, Fieno DS, Hillenbrand HB, Wu E, Bundy JM, et al. An improved MR imaging technique for the visualization of myocardial infarction. Radiology 2001;218:215-23.
- Wilke N, Simm C, Zhang J, Ellermann J, Ya X, Merkle H, et al. Contrast-enhanced first pass myocardial perfusion imaging: correlation between myocardial blood flow in dogs at rest and during hyperemia. Magn Reson Med 1993;29:485-97.
- Saeed M, Wendland MF, Szolar D, Sakuma H, Geschwind JF, Globits S, et al. Quantification of the extent of area at risk with fast contrast-enhanced magnetic resonance imaging in experimental coronary artery stenosis. Am Heart J 1996;132:921-32.
- Kim RJ, Chen EL, Lima JA, Judd RM. Myocardial Gd-DTPA kinetics determine MRI contrast enhancement and reflect the extent and severity of myocardial injury after acute reperfused infarction. Circulation 1996;94:3318-26.
- White FC, Carroll SM, Magnet A, Bloor CM. Coronary collateral development in swine after coronary artery occlusion. Circ Res 1992;71:1490-500.
- Roth DM, Maruoka Y, Rogers J, White FC, Longhurst JC, Bloor CM. Development of coronary collateral circulation in left circumflex Ameroid-occluded swine myocardium. Am J Physiol 1987;253:H1279-88.
- Kramer MF, Kinscherf R, Aidonidis I, Metz J, Kramer MF, Kinscherf R, et al. Occurrence of a terminal vascularisation after experimental myocardial infarction. Cell Tissue Res 1998;291:97-105.
- Virag JI, Murry CE. Myofibroblast and endothelial cell proliferation during murine myocardial infarct repair. Am J Pathol 2003;163:2433-40.
- Bulow H, Klein C, Kuehn I, Hollweck R, Nekolla SG, Schreiber K, et al. Cardiac magnetic resonance imaging: long term reproducibility of the late enhancement signal in patients with chronic coronary artery disease. Heart 2005;91:1158-63.
- Ramani K, Judd RM, Holly TA, Parrish TB, Rigolin VH, Parker MA, et al. Contrast magnetic resonance imaging in the assessment of myocardial viability in patients with stable coronary artery disease and left ventricular dysfunction. Circulation 1998;98:2687-94.
- Rehwald WG, Fieno DS, Chen EL, Kim RJ, Judd RM. Myocardial magnetic resonance imaging contrast agent concentrations after reversible and irreversible ischemic injury. Circulation 2002;105:224-9.
- Morales C, Gonzalez GE, Rodriguez M, Bertolasi CA, Gelpi RJ. Histopathologic time course of myocardial infarct in rabbit hearts. Cardiovasc Pathol 2002;11:339-45.
- Dobaczewski M, Bujak M, Zymek P, Ren G, Entman ML, Frangogiannis NG. Extracellular matrix remodeling in canine and mouse myocardial infarcts. Cell Tissue Res 2006;22:475-88.