
Analysis of volatile oil in Rhizoma Ligustici Chuanxiong-Radix Paeoniae Rubra by gas chromatography-mass spectrometry and chemometric resolution1
Introduction
Herbal pairs (HP), as used in traditional Chinese medicine (TCM), consists of 2 selected single herbs, and is a basic unit in TCMs. HP are an intermediate point between single herbs and recipes[1,2]. When 2 selected single herbs are applied together, ensuring that the advantages of both are harnessed, and that the disadvantages are minimized, the results will be superior to those obtained using a single herb alone. Two single herbs with similar actions, if used simultaneously, can strengthen the therapeutic effect against serious diseases. Two single herbs with different actions used in combination can broaden the therapeutic scope of the treatment for complex conditions. Alternatively, a toxic or potent herb can be applied with another herb capable of reducing or removing its side effect or toxicity to minimize the toxic reaction or damage to the body’s resistance.
Although the composition of an HP, compared with TCM recipes, is simple, HP adhere to the basic features and principles of TCM compatibility, and are also easier to study due to their simpler chemical composition. Consequently, clarifying the chemical compositions of HP, in particular the active compounds and the changes in the chemical compounds that take place during the process of decocting the 2 single herbs, is an essential element of TCM prescription chemistry. Therefore, studies of HP chemistry will reveal the chemical basis of TCM compatibility and provide new information for the study of prescription chemistry in TCM.
The Rhizoma Ligustici Chuanxiong (RLC)-Radix Paeoniae Rubra (RPR) HP[1–4] is commonly used in TCM for promoting blood circulation to remove stasis. These 2 herbs are used together to mutually strengthen their effects for the treatment of numb extremities or traumatic injuries and headache due to blood stasis. To date, no chemical information on this HP has been reported.
In the present paper, essential oils from RLC, RPR, and RLC-RPR were extracted, and the components were identified by gas chromatography-mass spectrometry (GC-MS). Furthermore, the 2-dimensional data were resolved and processed using the chemometric resolution method (CRM)[5–12] to obtain pure chromatographic curves and MS profiles for both the 2 single herbs and the HP.
Materials and methods
Materials RLC and RPR were purchased from the Chongqing Medical Materials Corporation (Chongqing, China) and the Inner Mongolia Chifeng Chinese Medicinal Corporation (Chifeng, China), respectively, and identified by a researcher from the Institute of Materia Medica, Hu-nan Academy of Traditional Chinese Medicine and Materia Medica, Changsha, China.
Extraction of volatile oil One hundred grams of each of RLC and RPR crude herbs were mixed together with 1000 mL of distilled water in a standard volatile oil extractor, allowed to soak for 30 min at room temperature and then heated to 100 °C in a closed system. Then, the essential oil was prepared by using the standard steam distillation method, according to the Chinese Pharmacopeia[13]. The essential oils for the single herbs (100 g of each) were extracted in the same way.
Detection of volatile oil In the gas chromatographic system (6890-5973N gas chromatograph-mass spectrometer; Agilent Technologies, USA), an HP-5MS capillary column (30 m×0.25 mm ID) was used. The column temperature was held initially at 60 °C, then heated to 250 °C at a rate of first 4 °C/min to 120 °C, then 10 °C/min to 250 °C and maintained for 5 min. The inlet temperature was kept at 250 °C and the interface temperature at 280 °C. The carrier gas (helium) was kept at a constant flow rate of 1.0 mL/min. In the mass spectrometer, electron impact (EI+) mass spectra were recorded at 70 eV. Ionization energy in the full scan model was in the 20–400 amu range with 3.8 scans/s velocity. The ionization source temperature was set at 230 °C.
Data analyses Data analyses were performed on a personal computer. Programs relating to the chemometric resolution methods were coded in MATLAB 6.1 for Windows. The library search and spectral matching of the resolved pure components were conducted using the National Institute of Standards and Technologies (NIST) MS database (supplied with the mass spectrometer), which contains approximately 107 000 compounds.
CRM-heuristic evolving latent projections Generally, there are 2 main problems associated with the classical qualitative analytical method, whereby direct searches for GC-MS profiles are carried out in the NIST MS database. One is that the chromatograms are often influenced by the background and by the overlapping peaks, and this makes spectra similarity-matching with mass spectral databases very difficult to carry out. The other is that the typical chromatographic drift that occurs from one sample to the next causes the same component to show a different retention time even under the same chromatographic conditions. In order to resolve these problems, full chemical and mathematical information in the 2-dimensional data provided by the GC-MS instruments should be taken into account, and the CRM should be employed. In the present study, one CRM, the heuristic evolving latent projections (HELP) method, was used. HELP is an efficient curve resolution method for the 2-dimensional data in chromatograms and mass spectra obtained by using GC-MS techniques. The unique resolution of 2-dimensional data from chromatograms and spectra of the pure chemical components is conducted with local full rank analysis in HELP. HELP has been successfully used to analyze and determine the volatile components for the herbs Rhizoma aractylodis and Cortex magnoliae officinalis, and the peptic powder in TCM[8–11,14,15]. A detailed description of the theory of the method can be found elsewhere[5–7]. In short, the following procedure was completed for every peak cluster in the total ionic chromatogram (TIC):
(1) Confirmation of the background and correction of drifting baselines.
(2) Determination of the number of components, the selective latent projective graph and rank map on the basis of the eigenstructure tracking analysis.
(3) Unique resolution of 2-dimensional data into pure chromatographic profiles and mass spectra with local full rank analysis by means of the selective information and zero-component region.
(4) Verifying the reliability of the resolved results.
Results
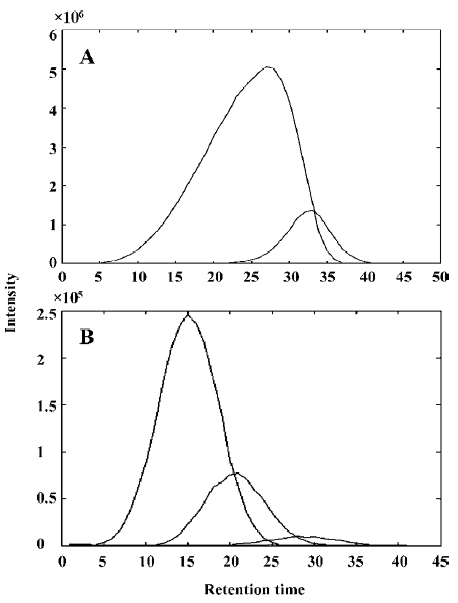
Qualitative analysis Figure 1 shows the TIC profiles of the volatile oils in RLC, RPR and RLC-RPR. As shown in these TIC profiles, many chromatographic peaks overlap with one another, so the 3 systems of volatile oils are very complicated. The peak clusters A (within 10.25–10.45 min) and B (within 7.80–7.97 min) in Figure 1 are taken as examples to illustrate the data analysis process with CRM.
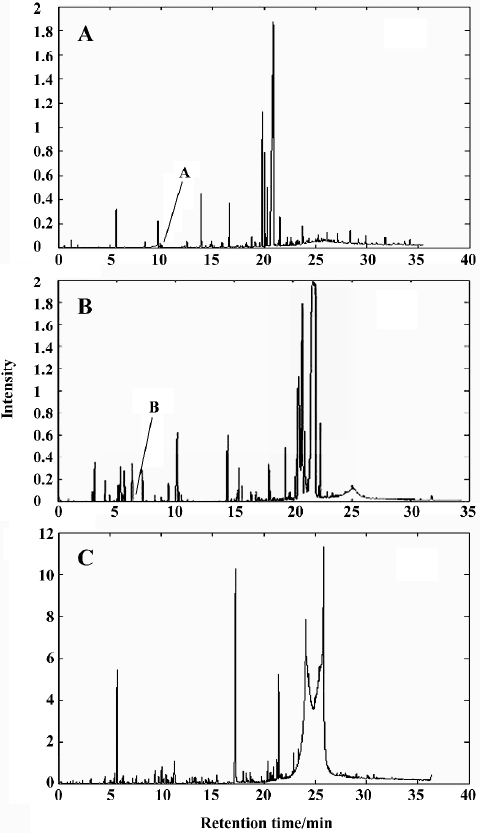
Figure 2A shows the TIC curve of peak cluster A, which looks like a pure chromatographic peak with only one component. However, in different parts of peak cluster A, different compounds can be found in the NIST MS library. Clearly, such a search will lead to lower reliability and lower accuracy for qualitative identification, and it is also difficult to carry out quantitative analysis because of overlap peaks.
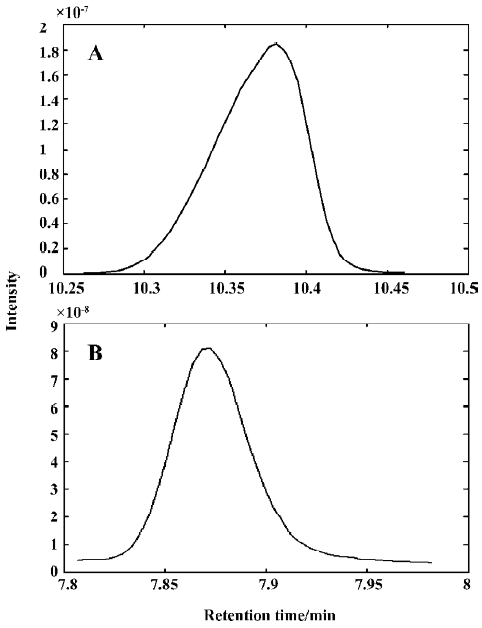
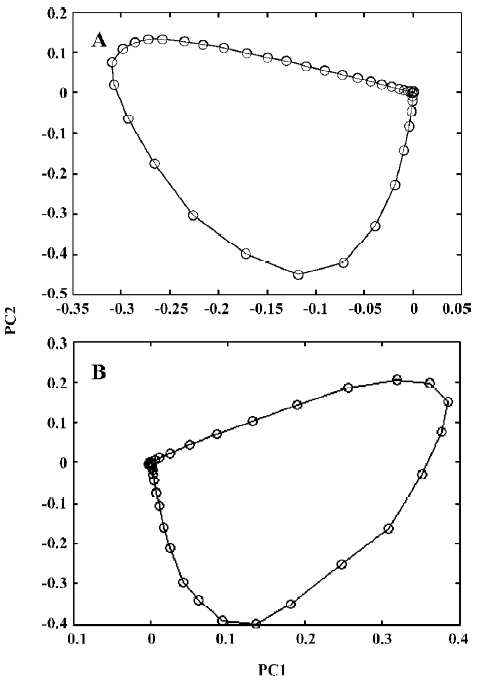
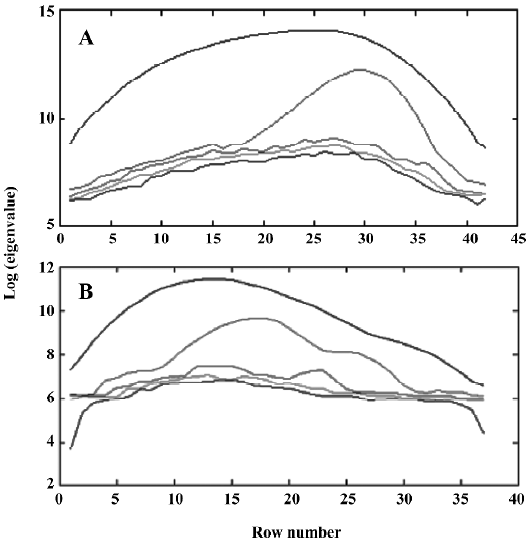
Figure 3 shows the evolving latent projection graph (ELPG) for peak clusters A and B using CRM. From this plot, it can be seen that there are 2 components in peak cluster A. This is consistent with the results obtained from the fixed size window method (FSWM) evolving factor analysis[5,6] plot after subtracting the heteroscedastic noise. Figure 4 shows the FSWM plot of peak clusters A and B, which provides local ranks in different time; that is, according to the number of components. If the local rank is one, the number of components will be one. If the local rank is 2, the number of components will be 2. As shown in Figure 4A, peak cluster A is a system of 2 components.
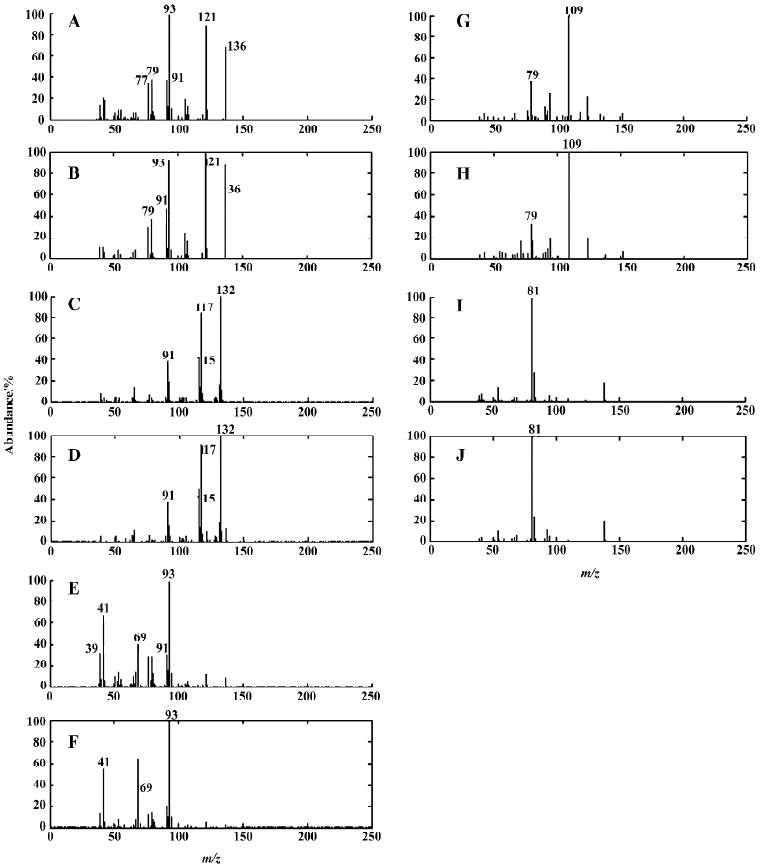
On the basis of the number of components in the system, the selective regions and zero-concentration regions of all the constituents determined above, the 2-dimensional data matrix can be uniquely resolved into pure chromatographic profiles and mass spectra of all components. Qualitative determination of the chemical composition of peak cluster A can be performed by means of direct similarity searches in the NIST library, because the pure chromatographic curve and mass spectrum of each component have been resolved. The search result shows that these 2 compounds in peak cluster A are (+)4-carene and isopropenyltoluene, with similarity indices of 98.28% and 98.70%, respectively. Their corresponding chromatographic profiles are shown in Figure 5A, and the resolved mass spectra together with the standard spectrum of each compound from the NIST MS library are also given in Figure 6A–D. The reliability and accuracy of qualitative analysis were greatly enhanced because the results were obtained from the pure mass spectrum of each compound. Likewise, Figures 3B, 4B, 5B, and 6E–J were obtained with HELP for peak cluster B, and represent the ELPG plot, rank map, pure chromatographic profile, mass spectra and their corresponding standard spectra for peak cluster B. There are 3 compounds in peak cluster B: cyclo-propyl-4-picoylketone, 2,3-dihydro-1,8-cineole, and furan-2-pentyl, with similarity indices of 94.52%, 95.53% and 99.00%, respectively.
Other peaks in the chromatographic profile of RLC-RPR and all peaks in the chromatographic profiles of RLC and RPR were also determined qualitatively in the same way as described earlier (Table 1). Fifty-two components in RLC, 38 components in RPR, and 61 components in RLC-RPR were identified, accounting for 95.14%, 95.19%, and 89.68% of the total contents of the essential oils of RLC, RPR, and RLC-RPR, respectively.
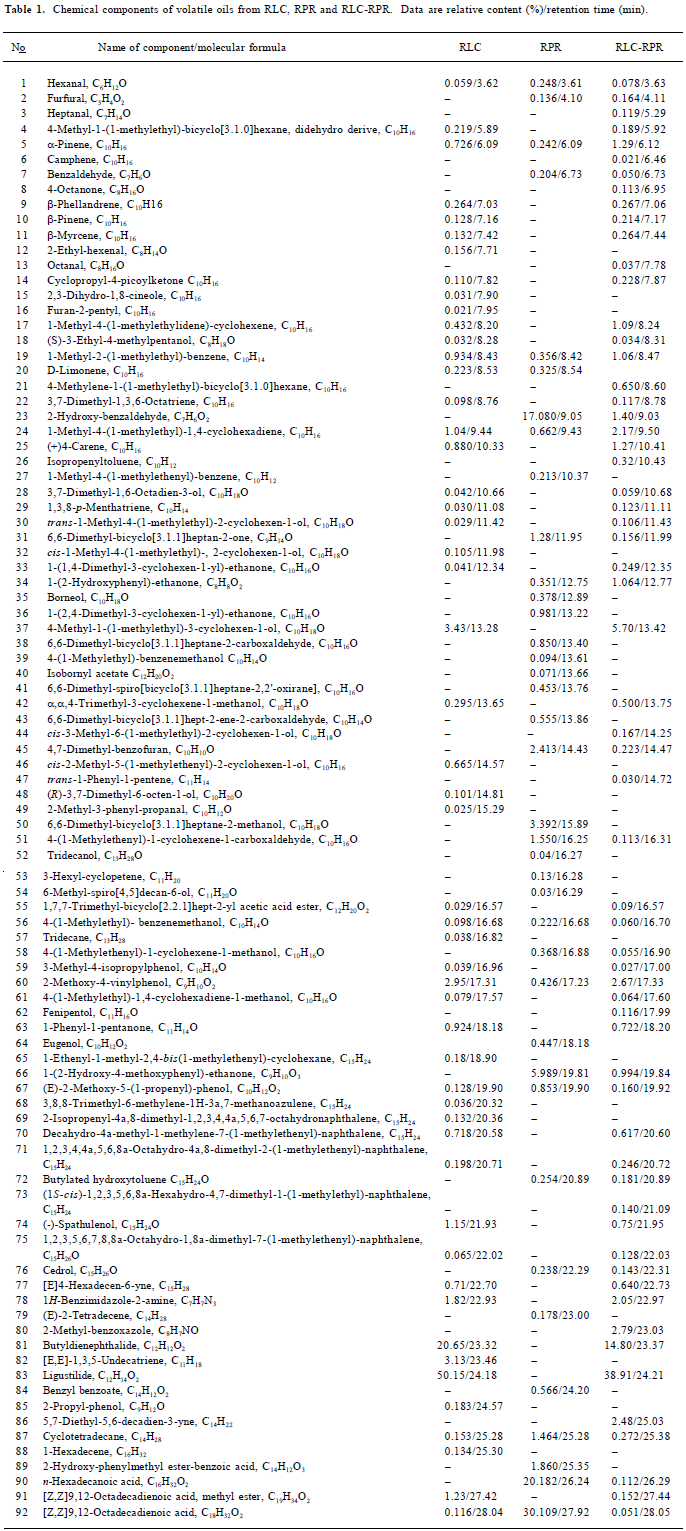
Full table
Quantitative analysis By using an overall volume integration method, quantitative results for each component in pure chromatographic profiles of HP RLC-RPR, RLC, and RPR were obtained (Table 1).
Comparison of volatile components From Table 1 it can be seen that most of the volatile chemical components in RLC-RPR are those present in the single herbs RLC and RPR, but that the relative amounts of them are altered. The volatile chemical components of RLC-RPR have 3 main characteristics. First, the main chemical components of RLC-RPR, ligustilide (38.9%), butyldienephthalide (14.8%), 4-methyl-1-(methylethyl)-3-cyclohexen-1-ol (5.7%), 2-hydroxybenzaldehyde (2.4%), 2-methoxy-4-vinylphenol (2.17%) and 1-methyl-4-(1-methylethyl)- 1,4-cyclohexa-diene (2.17%), are almost the same as those of RLC, and are thus clearly from that source. Second, the relative amounts of the main volatile chemical components of the single herb RPR, including [Z,Z]9,12-octadecadienoic acid (30.11%), n-hexadecanoic acid (20.18%), 2-hydroxy-benzaldehyde (17.08%), 1-(2-hydroxy-4-methoxyphenyl)-ethanone (5.99%), and 4,7-dimethyl-benzofuran (2.41%), are very low in RLC-RPR. Finally, there are some volatile chemical components of RLC-RPR that are different from those of RLC or RPR alone, and are produced in the process of decocting the 2 single herbs. However, the chemical components of the volatile oil of RLC-RPR are contributed mainly by RLC.
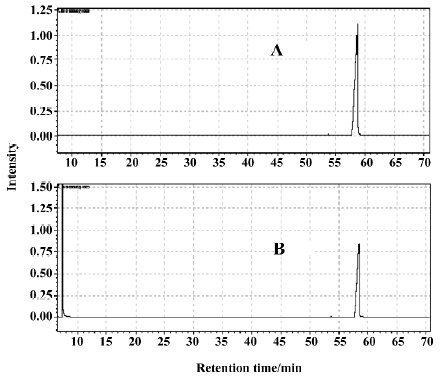
Acid-base reaction during decoction We think that there is an acid-base reaction during the process of decocting the 2 single herbs, RLC and RPR. In order to verify that an acid-base reaction during the process of decocting the 2 single herbs, RLC and RPR, was taking place, a further experiment was designed and finished. In the experiment, pyrimidine was used as an alkaloid and n-hexadecanoic acid as an acid, and GC was used to detect the quantity of n-hexadecanoic acid before and after decoction with pyrimidine. Figure 7 shows the GC curves for n-hexadecanoic acid that was mixed, decocted and distilled with water steam in the presence (GC curve B) and absence (GC curve A) of pyrimidine. From the peak areas (3.51×10⁷ in GC curve A and 1.97×10⁷ in GC curve B) in Figure 7, we can draw the conclusion that some of the n-hexadecanoic acid reacted with pyrimidine to form a salt, which could not be volatilized with water steam.
Discussion
Most of the volatile chemical components of RLC-RPR are derived from the constituent herbs, RLC and RPR, but the relative amounts of them are altered. The main volatile chemical components of RLC-RPR are very similar to those of RLC. Thus, the pharmacological activities of RLC-RPR almost totally depend on the volatile chemical components of RLC. Because many chemical reactions take place during the process of decocting the 2 single herbs, the relative contents of the main volatile chemical components of the single herb RPR are altered in RLC-RPR. In RLC-RPR, the relative content of the main volatile chemical components of RPR is very low because of chemical reactions that take place during the process of decocting the 2 herbs in water at 100 °C. Thus, the relative amounts of the pharmacologically active compounds might be different in the HP from in the constituent herbs alone. The pharmacological activities of the volatile components in RLC-RPR and further investigation of the process by which the proportions of the main volatile chemical components change during the decoction of RLC-RPR will be studied in our future research.
We believe that the reason for the drastically reduced proportions of n-hexadecanoic acid and 2-hydroxy-benzaldehyde in RLC-RPR relative to RLC is an acid-base reaction that takes place during the process of decocting the 2 single herbs. In order to show that this was the case, a further experiment was carried out in which pyrimidine was used as an alkaloid and n-hexadecanoic acid as an acid. Alkaloids in RLC, such as chuanxiongzine, adenine and adenoside, can react with aliphatic and aromatic acids, such as n-hexadecanoic acid, 9,12-octadecadienoic acid and 2-hydroxy-benzaldehyde, to form organic salts. These organic salts dissolve in water and lose their volatility, so the n-hexadecanoic acid content in the volatile chemical components of RLC-RPR decreases.
The volatile chemical components from single herbs or HP in TCM are very complicated, and some overlapping peak clusters might exist in the TIC from GC-MS analysis. By using the HELP technique on the 2-dimensional data, together with the large mass spectral database, complex systems (such as in the present study) can be analyzed qualitatively and quantitatively. This method could be a powerful way for the fast and accurate analysis of unknown complex systems such as HP and even TCM prescriptions.
References
- Xu QH, Liu LY, Zhao RH. Collection of herbal pairs in traditional Chinese medicine. Beijing: Publishing House of Traditional Chinese Medicine; 1996.
- Xu GL, Chen WH, Zhang MH, Cai YL. Herbal pairs and clinic. Hefei: Anhui Publishing House of Science and Technology; 2003.
- Tan TL, Liu QL. Common-used herbal pairs and contraindictions of traditional Chinese medicine. Taiyuan: Shanxi Publishing House of Science and Technology; 2004.
- Tian DH. Practical dictionary of traditional Chinese herbs. Beijing: People’s Medical Publishing House; 2000.
- Kvalheim OM, Liang YZ. Heuristic evolving latent projections: resolving two-way multicomponent data. Part 1. Selectivity, latent projective graph, datascope, local rank and unique resolution. Anal Chem 1992;64:936-46.
- Liang YZ, Kvalheim OM, Keller HR, Massart DL, Kiechle P, Erni F. Heuristic evolving latent projections: resolving two-way multicomponent data. Part 2: Detection and resolution of minor constituents. Anal Chem 1992;64:946-53.
- Liang YZ, Kvalheim OM, Rahmani A. Resolution of strongly overlapping two-way multicomponent data by means of heuristic evolving latent projections. J Chemom 1993;7:15-43.
- Gong F, Liang YZ, Song YQ. Determination of volatile components of ping-wei powder: analysis of the volatile oil in cortes magnoliae officinalis with GC-MS. Chem J Chin Univ 2001;22:1481-5.
- Gong F, Song YQ, Peng YG. Analysis of the volatile oil of rhizoma atractylodis in ping-wei powder with GC-MS. Acta Pharm Sin 2000;35:394-7.
- Gong F, Liang YZ, Song YQ. Determination of the volatile oil of pericarpium citri reticulatae with gas chromatography/mass spectrometry. Chin J Anal Chem 2000;28:860-4.
- Gong F, Liang YZ, Xu QS, Chau FT. Determination of volatile components in peptic powder by gas chromatography-mass spectrometry and chemometric resolution. J Chromatogr A 2001;909:237-47.
- Liang YZ. White, grey and black multicomponent system and their chemometics algorithms. Changsha: Hunan Publishing House of Science and Technology; 1996.
- Chinese Pharmacopoeia Committee. Chinese Pharmacopoeia. Beijing: People’s Medical Publishing House; 2000.
- Gong F, Song YQ, Peng YG, Cui H, Liang YZ, Leung KM, et al. Analysis of the volatile oil of rhizoma atractylodis in ping-wei powder with GC-MS. Acta Pharm Sin 1999;34:214-7.
- Gong F, Song YQ, Peng YG, Cui H, Liang YZ, Leung KM, et al. HELP applied to traditional Chinese medicine analysis. Chem J Chin Univ 1999;20:199-203.