
Upregulation of TNF-α and IL-6 mRNA in mouse liver induced by bacille Calmette-Guerin plus lipopolysaccharide
Introduction
Many liver injury models have been established to study the mechanisms by which injury occurs and to assist in the development of new drugs. It has been reported that severe hepatitis can be induced by injecting small doses of bacterial lipopolysaccharide (LPS) into mice pretreated with bacillus Calmette-Guerin (BCG) or Corynebacterium parvum[1,2]. BCG priming and LPS challenge in mice causes massive liver injury, which comprises priming and eliciting phases. BCG priming induces mononuclear cell infiltration into the liver lobules and granuloma formation[3]. The subsequent LPS injection elicits acute and massive hepatic injury, with a concomitant release of various cytokines[4].
Inflammatory cytokines are produced after systemic or local inflammation by a wide variety of cells, including monocytes, macrophages, Kupffer cells and endothelial cells. Recent studies have shown that pro-inflammatory mediators, such as tumor necrosis factor (TNF)-α and interleukin (IL)-1β, are markedly elevated in serum and liver homogenates in immunological liver injury induced by BCG plus LPS[5,6]. Furthermore, elimination of Kupffer cells by gadolinium chloride[7] and TNF-α antibodies[8] are effective in reducing hepatic damage in vivo, suggesting that TNF-α secreted by Kupffer cells may play a major role in liver injury. In addition, IL-6 acts as one of the pivotal cytokines in host defense responses to infection and inflammation by activating lymphocytes and inducing hepatic acute phase proteins[9]. It has also been shown to play an important role in liver injury[10].
Endotoxin exerts its effects in liver injury via interaction with lipopolysaccharide binding protein (LBP) and CD14[11]. LBP in serum can recognize and bind LPS to form LPS-LBP complexes and activate cells through the CD14 receptor on the membranes of these cells, then initiate a process leading to the release of cytokines, prostanoids, and other soluble mediators[12,13].
However, the mechanism of immunological liver injury induced by BCG plus LPS has so far remained elusive. Therefore, the purpose of the present study is to investigate whether TNF-α and IL-6 are involved in immunological liver injury, and, if so, by which processes.
Materials and methods
Reagents Lipopolysaccharide (Escherichia coli LPS; serotype 055:B5) was purchased from Sigma (USA). Mycobacterium tuberculosis bacille Calmette-Guerin (BCG) vaccine was purchased from the Institute of Shanghai Biological Products (China). The kit for determining serum alanine aminotransferase (ALT) was purchased from Shanghai Rong-Sheng Biotechnology (China).
Animals and treatments Male 8- to 10-week-old BALB/c mice, weighing 20–24 g, were provided by Anhui Anke Biotechnology Co. All animals were housed under standard laboratory conditions. All experiments were approved by the Ethics Review Committee for Animal Experimentation of the Institute of Clinical Pharmacology, Anhui Medical University. The animals were allowed free access to food and water at all time and were maintained on a 12-h light/dark cycle in a controlled temperature (20–25 °C) and humidity (50%±5%) environment for 1 week before use.
Establishment of immunological liver injury model For experiment 1, mice were randomly divided into 6 equal groups: (1) normal control group (N): mice were injected via the tail vein with saline at the same time as the BL groups (see below); (2) BCG group (B): mice were injected with saline 12 d after injection via the tail vein with BCG (125 mg/kg); (3) LPS group (L1): mice were injected with LPS (125 µg/kg) 12 d after injection via the tail vein with saline; (4) BCG/LPS groups (BL1, BL2, BL3): mice were injected with LPS (125, 250, or 375 µg/kg, respectively) 12 d after injection via the tail vein with 125 mg/kg doses of BCG (approximately 5×10⁷ viable units per mouse) in saline. The mice were killed 12 h after LPS. Blood and liver samples were collected for biochemical and pathological examinations, respectively.
For experiment 2, mice were randomly divided into 6 equal groups: normal control group (N), BCG group (B), LPS group (L1), and the groups treated with BCG plus three different doses of LPS (BL1, BL2, BL3). Mice from the N, L1, BL1, BL2, and BL3 groups were treated in the same way as those in experiment 1. Mice in these groups were decapitated at 0.5, 1, 3, 6, or 12 h after LPS treatment. Mice in the B group were injected via the tail vein with a 125 mg/kg dose of BCG (approximately 5×10⁷ viable units per mouse) and decapitated at either d 11, 13, or 15 after BCG treatment (3 mice per time point). Liver samples were collected for isolation of total RNA and protein, respectively.
Measurement of serum ALT Serum ALT activity was measured with a commercially available kit.
Histopathological analysis Liver samples from the same liver lobes were fixed in 10% formalin immediately and then embedded in paraffin. Sections were stained with hematoxylin and eosin (HE) and were examined for inflammatory cell accumulation and liver damage by light microscopy.
Isolation of total RNA and semiquantitative RT-PCR for measurement of mRNA Fifty milligrams of liver tissue was collected from each mouse. Total RNA was extracted using TRIzol reagent (Shanghai Sangon Biological Engineering Technology & Services, Shanghai, China), according to the manufacturer’s instructions. The integrity and concentration of RNA were determined by measuring absorbance at 260 nm, after which the RNA was electrophoretically separated on agarose gels. Total RNA was stored at -80 °C. For the reverse transcription-polymerase chain reaction (RT-PCR) [One-step RNA PCR kit (AMV); TaKaRa, Japan], 1 µg of total RNA from each sample was resuspended in a 25 µL final volume of reaction buffer, which contained 10× one-step RNA PCR buffer, 25 mmol/L MgCl2, 10 mmol/L dNTP mixture, 20 U RNase inhibitor, 2.5 U AMV RTase XL, 2.5 U AMV-Optimized Taq, 20 µmol/L forward primer, 20 µmol/L reverse primer, and RNase-free dH2O. PCR for glyceraldehyde 3-phosphate dehydrogenase (GAPDH) was performed in each individual sample as an internal control. The following primers were synthesized by Shanghai Sangon Biological Engineering Technology & Services (Shanghai, China), according to sequences previously described by others[14,15]: GAPDH forward primer 5'-GAG GGG CCA TCC ACA GTC TTC-3' and reverse primer 5'-CAT CAC CAT CTT CCA GGA GCG-3'; TNF-α forward primer 5'-GGC AGG TCT ACT TTG GAG TCA TTG C-3' and reverse primer 5'-ACA TTC GAG GCT CCA GTG AAT TCG G-3'; IL-6 forward primer 5'-CTG GTG ACA ACC ACG GCC TTC CCT A-3' and reverse primer 5'-ATG CTT AGG CAT AAC GCA CTA GGT T-3'; LBP forward primer 5'-GGC TCT GCA GAG AGA GCT GTA CAA-3' and reverse primer 5'-TAG TTA AGG AAT GCC TGG AAC AGG-3'; CD14, forward primer 5'-ACA TCT TGA ACC TCC GCA AC-3' and reverse primer 5'-AGG GTT CCT ATC CAG CCT GT-3'. The sizes of the amplified PCR products were 340 bp for GAPDH, 307 bp for TNF-α, 600 bp for IL-6, 1147 bp for LBP and 500 bp for CD14, respectively. The number of cycles and annealing temperature were optimized for each primer pair. For GAPDH, amplification was initiated by 2 min of denaturation at 94 °C for 1 cycle, followed by 30 cycles at 94 °C for 30 s, 56 °C for 30 s, and 72 °C for 1 min. For TNF-α and IL-6, amplification was initiated by 2 min of denaturation at 94 °C for 1 cycle, followed by 28 and 35 cycles at 94 °C for 45 s, 60 °C for 45 s, and 72 °C for 1 min. After the last cycle of amplifica-tion, samples were incubated for 5 min at 72 °C. For LBP and CD14, amplification was initiated by 2 min of denaturation at 94 °C for 1 cycle, followed by 27 cycles at 94 °C for 30 s, 60 °C for 30 s, and 72 °C for 1.5 min. After the last cycle of amplification, samples were incubated for 5 min at 72 °C. The amplified RT-PCR products were subjected to electrophoresis at 75 V through 1.5% agarose gels (Sigma, USA) for 45 min. A 100 bp DNA ladder marker was used as a molecular marker. Agarose gels were stained with 0.5 mg/mL ethidium bromide (Sigma, USA) TAE buffer. The gel bands were examined by using a Tanon gel image system (China).
Immunohistochemical analysis Liver tissue fixed in 10% formaldehyde was prepared by paraffin embedding and cut into 4 μm sections. Immunohistochemical staining was performed using a DAB kit (Beijing Zhongshan Golden Bridge Biotechnology, China). Briefly, tissue sections were deparaffinized in xylene and rehydrated through a graded alcohol series to water. Endogenous peroxidase activity was quenched with 3% H2O2 in methanol for 5 min. Slides were incubated with a 1:300 dilution of anti-NF-κBp65 antibodies(Santa Cruz, USA) overnight at 4 °C. Antibody binding was localized by incubation with goat anti-rabbit IgG antibody-HRP (Power Rision Two-step Histostaining Reagent) for 25 min. Staining was developed with DAB. Slides were counterstained with hematoxylin, and tissue sections were mounted .
Western blot analysis Western blotting was carried out using the protocol for molecular cloning. Briefly, frozen tissues were lysed in lysis buffer. The lysates were centrifuged at 4000×g, and supernatants were immediately stored at -70 °C until use. Protein concentration was determined using Lowery method, and 50 µg of protein was separated by 12% sodium dodecyl sulfate-polyacrylamide gel electrophoresis (SDS-PAGE) and transferred to nitrocellulose. Nonspecific binding was blocked by preincubation of the nitrocellulose in Tris-buffered saline containing 5% non-fat milk for 1 h. The nitrocellulose was incubated overnight at 4 °C with polyclonal anti-IκB-α antibodies (Santa Cruz Biotech, USA). Bound primary antibody was detected using a peroxidase-conjugated secondary antibody (Boshide, China) and enhanced chemiluminescence reagents (Pierce, USA).
Statistical analysis The TNF-α, IL-6, LBP, and CD14 mRNA levels were normalized against the GAPDH mRNA level in the same sample. Quantified data from analysis of serum ALT and the RT-PCR assay are expressed as mean±SEM at each point. ANOVA and the Student-Neumann-Keuls post hoc test were used to determine the statistical significance of differences between the treated animals and the controls.
Results
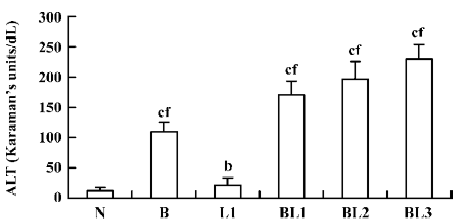
Effect of BCG and/or LPS on the activity of serum ALT in mice When mice were injected with BCG, LPS, or BCG plus LPS, serum ALT activity, indicating hepatic cell damage, was significantly increased compared with normal controls. BCG markedly elevated serum ALT compared with LPS. The degree of elevation of serum ALT activity was positively correlated with the dose of LPS after BCG priming (Figure 1).
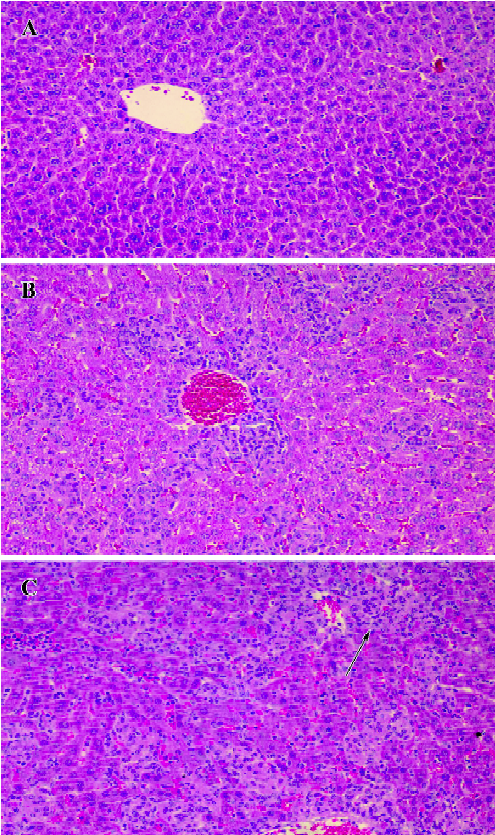
Effect of BCG and/or LPS on histological changes in mouse liver In the normal control group, there was no pathological abnormality. Morphology of the liver parenchyma was normal and hepatocytes were arranged around the central vein. No congestion and inflammation were observed in the sinusoids (Figure 2A). In the BCG group, however, there was obvious pathological abnormality. Infiltration of the liver lobules by inflammatory cells in the form of smaller granulomas was observed in the liver sections (Figure 2B). In the BCG plus LPS group, there was still more severe pathological abnormality. Spotty necrosis, piecemeal necrosis, even bridging necrosis could be seen, and inflammatory cells were arranged around the necrotic tissue. Congestion in the liver sinusoids was significant, with scattered infiltration of inflammatory cells (Figure 2C).
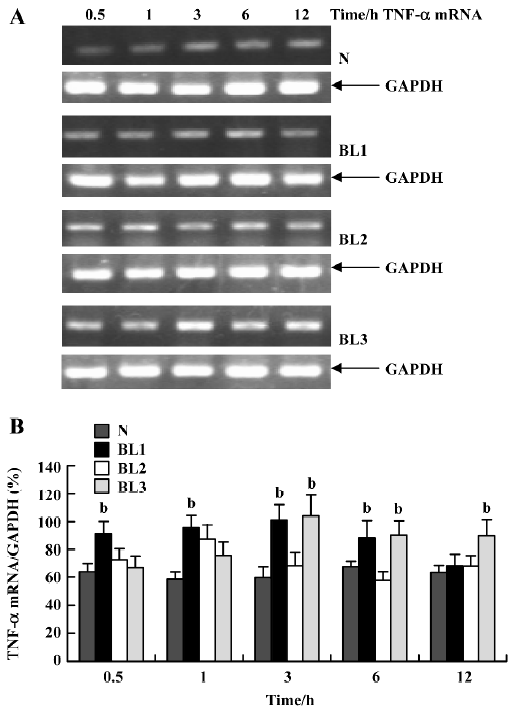
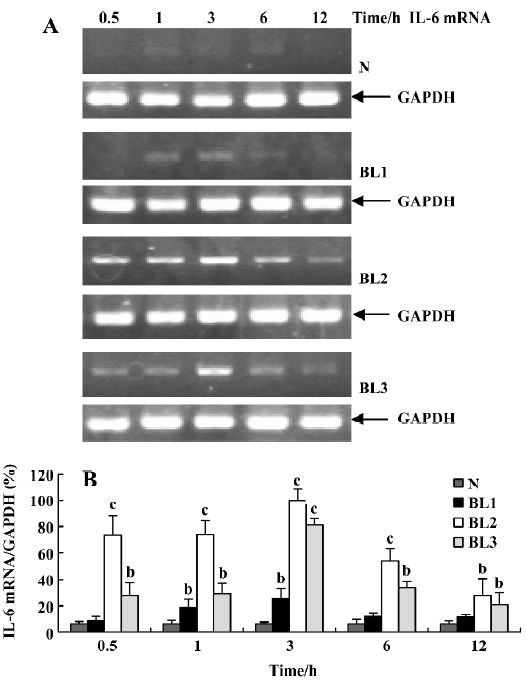
Effect of BCG and/or LPS on TNF-α and IL-6 mRNA in mouse liver To explore the mechanism of immunological liver injury induced by BCG and LPS, we examined the expression of TNF-α and IL-6 mRNA in mouse liver at different time points after BCG or LPS treatment. There was no significant difference in the levels of TNF-α or IL-6 mRNA in the BCG group and the normal control group (data not shown). However, treatment with both BCG and LPS led to significant increases in TNF-α and IL-6 mRNA levels, as compared with the normal control and BCG groups. For TNF-α mRNA, lower doses of LPS significantly increased its expression at 0.5 h (P<0.05), which then peaked at 3 h, and decreased at 12 h after LPS administration. The medium dose of LPS significantly upregulated TNF-α mRNA levels at 1 h after LPS administration, whereas a higher dose of LPS significantly increased levels at 3 h (P<0.05), which were maintained until 12 h after LPS administration (Figure 3). For IL-6 mRNA, lower doses of LPS increased its expression at 1 h, which peaked at 3 h after LPS administration, whereas in the higher and medium groups, its expression was markedly elevated at 0.5 h, also peaked at 3 h, then gradually decreased (Figure 4).
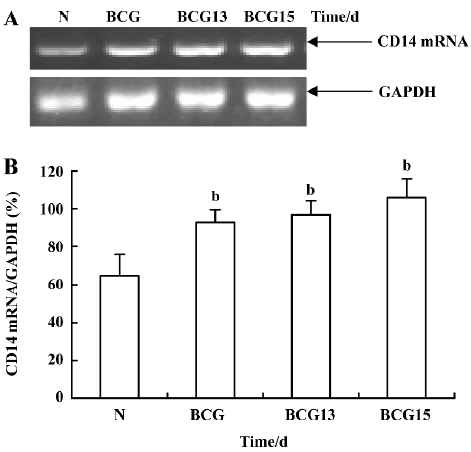
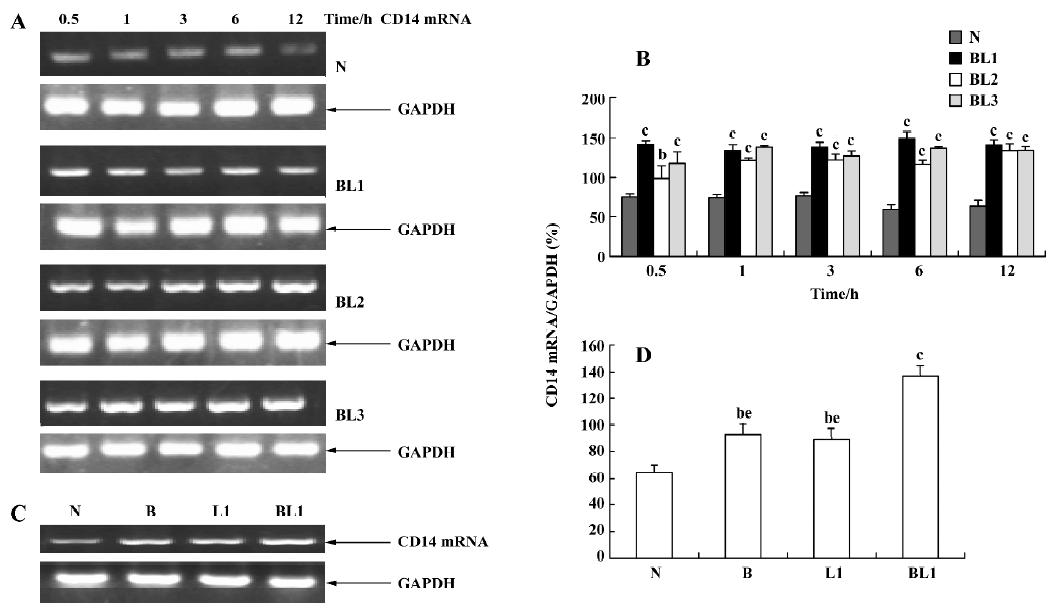
Effect of BCG and/or LPS on LBP and CD14 mRNA in mouse liver To determine the mechanism of elevation of TNF-α and IL-6 mRNA expression in mouse liver induced by BCG and/or LPS, we examined the expression of LBP and CD14 mRNA in mouse liver after BCG and/or LPS treatment. There was no significant difference in the levels of LBP mRNA between the BCG group and the normal control group (data not shown). However, the level of CD14 mRNA was significantly increased in the BCG group compared with the normal control group (Figure 5). Furthermore, treatment with both BCG and LPS led to a marked increase in LBP mRNA levels, as compared with the normal control group (P<0.01). Lower and medium doses of LPS significantly increased LBP mRNA levels at 1 h (P<0.01), which then peaked at 12 h after administration of LPS. A higher dose of LPS markedly increased LBP mRNA levels at 0.5 h (P<0.01), which peaked at 6 h (Figure 6) after administration of LPS. The expression of CD14 mRNA in mouse liver treated with BCG plus LPS in all dose groups was significantly upregulated compared with the normal control group (Figure 7A, 7B). Administration of BCG and LPS also led to significant elevation of CD14 mRNA, compared with BCG alone or LPS alone (Figure 7C, 7D).
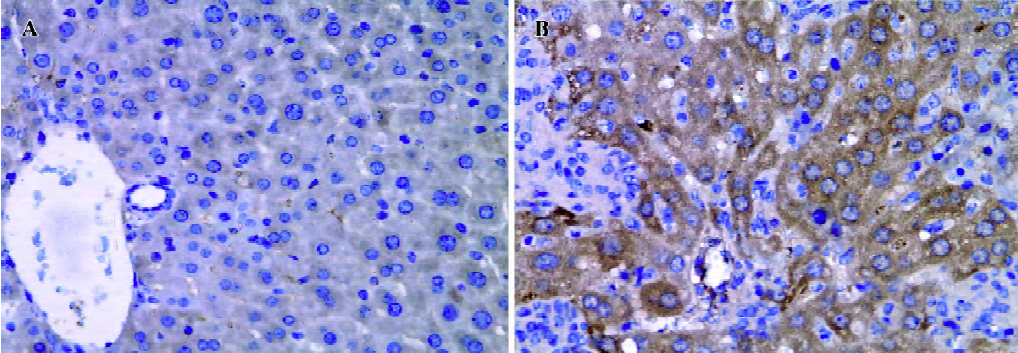
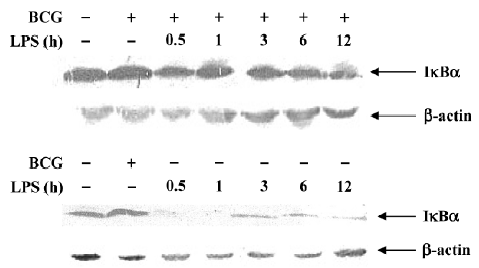
Effect of BCG and/or LPS on NF-κB p65 and IκB-α in mouse liver The expression and localization of NF-κB p65 in livers of mice were studied to study further its mechanism. Immunohistochemical studies demonstrated that hepatocyte nuclei in normal control mice were weakly immunoreactive for the p65 subunit of NF-κB, and that what immunoreactivity was present was localized mainly to the cytoplasm (Figure 8A). In contrast, immunoreactivity for NF-κB p65 was predominantly detected in hepatocyte nuclei for mice treated with BCG plus LPS (Figure 8B). It has been well documented that activation of NF-κB correlates with rapid proteolytic degradation of IκB-α, so we assessed (Figure 9).
Discussion
A major goal of the present study was to explore the mechanism of immunological liver injury induced by treatment with BCG plus LPS. Our results showed that serum ALT levels in mice treated with BCG and LPS were significantly increased and that severe pathological changes were seen in the liver when compared with the normal control group. Having determined that the liver injury model was successful, we next examined the effect of BCG and LPS on the expression of cytokines.
Many previous studies have indicated that TNF-α is a critical factor in immune-mediated hepatitis[16]. Endotoxemia causes liver injury in which TNF-α plays a significant role by inducing hepatic apoptosis[17,18]. In our present study, TNF-α expression in mouse liver was increased. However, the increase in TNF-α expression was negatively related to the dose of LPS at 0.5 h and 1 h after administration. In the medium dose group, there was no elevation of TNF-α expression between 3 h and 12 h after administration of LPS.
IL-6 is a multifunctional cytokine produced by many different cell types, including monocytes/macrophages, fibroblasts and vascular endothelial cells[19]. Experimental studies have demonstrated that it has a protective role against fulminating hepatic failure through inhibiting hepatocyte apoptosis[20]. Other studies have indicated that IL-6 inhibits TNF-α production both in vivo and in vitro[21,22]. In the present study, IL-6 mRNA expression in mouse liver after BCG plus LPS treatment was markedly upregulated, especially in the medium dose group, which may have been related to a lower level of TNF-α being present.
In vitro studies have shown that TNF-α produced by Kupffer cells in response to low concentrations of LPS is mediated via LBP and CD14[23]. LBP is an acute-phase protein produced predominantly by hepatocytes[24]. It has been found that LBP plays a major role in activating monocytes and Kupffer cells[25] and modulating liver injury[26]. Previous studies have shown that injection of LPS leads to higher LBP mRNA levels in hepatocytes[27], as regulated by IL-1β, TNF-α, and IL-6[28]. In our present study, similar to the results of previous studies[29], baseline levels of LBP mRNA were detectable in the normal control group. LBP mRNA levels in mouse liver after BCG plus LPS treatment were significantly increased. There were 2 peaks in both of the groups with the medium and higher doses of LPS. The first peak was at 1 h and the second at 12 h and 6 h after administration for the medium and higher dose groups, respectively.
Recent studies have shown that Kupffer cells from CD14 knockout mice produce significantly less TNF-α in response to the same amount of LPS, supporting a critical role for CD14 in Kupffer cell responses to LPS[23]. In vivo studies show that high expression levels of the CD14 gene can be induced posthepatectomy[30]. In vitro, upregulation of CD14 expression in Kupffer cells can be induced by LPS[31]. Consistent with the results of previous studies, our results show that administration of BCG and LPS leads to upregulation of CD14 mRNA in mouse liver. In the medium dose group, the increase in CD14 mRNA was lower than that observed in the other groups. Interestingly, the mRNA levels 3 h after BCG plus LPS administration in the medium dose group were notable as follows: (1) TNF-α, LBP, and CD14 mRNA levels were lower; (2) IL-6 mRNA levels were the highest of all groups. Production of TNF-α is known to be mediated via LBP and CD14. IL-6 can inhibit TNF-α. Therefore, the lower level of TNF-α mRNA in mouse liver may be related to the lower expression of LBP and CD14 mRNA and the higher level of IL-6 mRNA. More importantly, we found that there was significant upregulation of CD14 mRNA expression in mice treated with BCG alone compared with normal controls. This suggests that BCG alone may induce an increase in CD14 mRNA in mouse liver 10 d later, a value chosen according to the findings of previous studies[1,4,5]. Accordingly, we presume that the BCG infection set up granulomatous hepatitis, with the LPS dosing leading to activation of in situ macrophages, and subsequent inflammation with disruption of the granulomas.
In summary, our results indicate that BCG and LPS administration leads to a significant increase in IL-6 mRNA levels in mouse liver. These may be related to an increase in LBP and CD14 mRNA expression and activation of NF-κB . In addition, BCG may induce mononuclear cell infiltration into the liver, and those cells may express CD14 mRNA, resulting in upregulation of CD14 mRNA in mouse liver.
Acknowledgements
We thank Prof De-xiang XU (Institute of Clinical Pharmacology, Anhui Medical University) for providing GAPDH, CD14, TNF and IL-6 primers, and Prof Qing-lin FAN (Anhui Biology Institute) and Qiang WU (Anhui Medical University) for providing technical assistance.
References
- Wang GS, Liu GT. Role of nitric oxide in immunological liver damage in mice. Biochem Pharmacol 1995;49:1277-81.
- Smith SR, Calzetta A, Bankowski J, Kenworthy-Bott L, Terminelli C. Lipopolysaccharide-induced cytokine production and mortality in mice treated with Corynebacterium parvun. J Leukoc Biol 1993;54:23-9.
- Tsuji H, Harada A, Mukaida N, Nakanuma Y, Bluethmann H, Kaneko S, et al. Tumor necrosis factor receptor p55 is essential for intrahepatic granuloma formation and hepatocellular apoptosis in a murine model of bacterium-induced fulminant hepatitis. Infect Immun 1997;65:1892-8.
- Tsuji H, Mukaida N, Harada A, Kaneko S, Matsushita E, Nakanuma Y, et al. Alleviation of lipopolysaccharide-induced acute liver injury in propionibacterium acnes-primed IFN-γ-deficient mice by a concomitant reduction of TNF-α, IL-12, and IL-18 production. J Immunol 1999;162:1049-55.
- Wang H, Wei W, Shen YX, Dong C, Zhang LL, Wang NP, et al. Protective effect of melatonin against liver injury in mice induced by bacillus calmette-guerin plus lipopolysaccharide. World J Gastroenterol 2004;10:2690-6.
- Gui SY, Wei W, Wang H, Wu L, Sun WY, Wu CY. Protective effect of fufanghuangqiduogan against acute liver injury in mice. World J Gastroenterol 2005;11:2984-9.
- Kukan M, Vajdova K, Horecky J, Nagyova A, Mehendale HM, Trnovec T. Effects of blockade of Kupffer cells by gadolinium chloride on hepatobiliary function in cold ischemia-reperfusion injury of rat liver. Hepatology 1997;26:1250-7.
- Van Zee KJ, Kohno T, Fisher E, Rock CS, Moldawer LL, Lowry SF. Tumor necrosis factor soluble receptors circulate during experimental and clinical inflammation and can protect against excessive tumor necrosis factor alpha in vitro and in vivo. Proc Natl Acad Sci USA 1992;89:4845-9.
- Heinvich PC, Castell JV, Andus T. Interleukin-6 and the acute phase response. Biochem J 1990;265:621-36.
- Kovalovich K, Li W, Deangelis R, Greenbaum LE, Ciliberto G, Taub R. Interleukin-6 protects against Fas-mediated death by establishing a critical level of anti-apoptotic hepatic proteins FLIP, Bcl-2, and Bcl-xL. J Biol Chem 2001;276:26605-13.
- Soler-Rodriguez AM, Zhang H, Lichenstein H, Qureshi N. Neutrophil activation by bacterial lipoprotein versus lipopolysaccharide: differential requirements for serum CD14. J Immunol 2000;164:2674-83.
- Jarvelainen HA, Fang C, Ingelman-Sundberg M, Lindros KO. Effect of chronic coadministration of endotoxin and ethanol on rat liver pathology and proinflammatory and anti-inflammatory cytokines. Hepatology 1999;29:1503-10.
- Berger VV, Docke WD, Pluth M, Liebenthal C, Kupferling S, Lochs H, et al. Mechanisms of endotoxin tolerance in patients with alcoholic liver cirrhosis: role of interleukin 10, interleukin 1 receptor antagonist, and soluble tumor necrosis factor receptors as well as effector cell desensitization. Gut 2000;47:281-7.
- Wurfel MM, Monks BG, Ingalls RR, Dedrick RL, Delude R, Zhou D, et al. Targeted deletion of the lipopolysaccharide-binding protein gene leads to profound suppression of LPS responses ex vivo, whereas in vivo responses remain intact. J Exp Med 1997;186:2051-6.
- Xu DX, Wei W, Sun MF, Wu CY, Wang JP, Wei LZ, et al. Kupffer cells and reactive oxygen species partially mediate lipopolysaccharide-induced downregulation of nuclear receptor pregnane x receptor and its target gene CYP3a in mouse liver. Free Radic Biol Med 2004;37:10-22.
- Schumann J, Tiegs G. Pathophysiological mechanisms of TNF-α during intoxication with natural or man-made toxins. Toxicology 1999;138:103-26.
- Yang F, de Villiers WJ, McClain CJ, Varilek GW. Green tea polyphenols block endotoxin-induced tumor necrosis factor-production and lethality in a murine model. J Nutr 1998;128:2334-40.
- Shimizu S, Yamada Y, Okuno M, Ohnishi H, Osawa Y, Seishima M, et al. Liver injury induced by lipopolysaccharide is mediated by TNFR-1 but not by TNFR-2 or Fas in mice. Hepatol Res 2005;31:136-42.
- Akira S, Tage T, Kishimoto T. Interleukin-6 in biology and medicine. Adv Immunol 1993;54:1-78.
- Kruael ML, Harari Y, Mailman D, Actor JK, Zimecki M. Differential effects of prophylactic, concurrent and therapeutic lactoferrin treatment on LPS-induced inflammatory responses in mice. Clin Exp Immunol 2002;130:25-31.
- Aderka D, Le J, Vilcek J. Interleukin-6 inhibits LPS-induced tumor necrosis factor production in cultured human monocytes,U937 cells and in mice. J Immunol 1989;143:3517-23.
- Fattori E, Cappellett M, Costa P, Sellitto C, Cantoni L, Carelli M, et al. Defective inflammatory response in IL-6 deficient mice. J Exp Med 1994;180:1243-50.
- Su GL, Goyert SM, Fan MH, Aminlari A, Gong KQ, Klein RD, et al. Activation of human and mouse Kupffer cells by lipopolysaccharide is mediated by CD14. Am J Physiol Gastrointest Liver Physiol 2002;283:G640-45.
- Su GJ, Freeswick PD, Gefler DA, Wang Q, Shapire RA, Wan YH. Molecular cloning, characterization, and tissue distribution of rat lipopolysaccharide binding protein: evidence for extrahepatic expression. J Immunol 1994;153:743-52.
- Ulevitch RJ, Tobias PS. Recognition of gram-negative bacteria and endotoxin by the innate immune system. Curr Opin Immunol 1999;11:19-22.
- Su GL, Gong KQ, Fan MH, Kelly WM, Hsieh J, Sun JM, et al. Lipopolysaccharide-binding protein modulates acetaminophen-induced liver injury in mice. Hepatology 2005;41:187-95.
- Geller DA, Kispert PH, Su GL, Wang SC, Di Silvio M, Tweardy DJ, et al. Induction of hepatocyte lipopolysaccharide binding protein in models of sepsis and the acute-phase response. Arch Surg 1993;128:22-7.
- Wang YH, Freeswick PD, Khemlani LS, Kispert P, Wang SC, Su GL, et al. Role of lipopolysaccharide (LPS), interleukin-1, interleukin-6, tumor necrosis factor, and dexamethasone in regulation of LPS-binding protein expression in normal hepatocytes and hepatocytes from LPS-treated rats. Infect Immun 1995;63:2435-42.
- Wang SC, Klein RD, Wahl WL, Alarcon WH, Garg RJ, Remick DG, et al. Tissue coexpression of LBP and CD14 mRNA in a mouse model of sepsis. J Surg Res 1998;76:67-73.
- Takeda Y, Arii S, Mori A, Imamura M. High expression of the CD14 gene and interleukin-1 gene in the liver and lungs of cirrhotic rats after partial hepatectomy. J Surg Res 2003;115:9-17.
- Matsuura K, Ishida T, Setoguchi M, Higuchi Y, Akizuki S, Yamamoto S. Upregulation of mouse CD14 expression in Kupffer cells by lipopolysaccharide. J Exp Med 1994;179:1671-6.