
Guanosine 5'-triphosphate induces differentiation-dependent apoptosis in human leukemia U937 and KG1 cells1
Introduction
Despite the depth of knowledge concerning the pathogenesis of acute myeloblastic leukemia (AML), long-term survival remains unresolved[1,2]. While the current approach for AML therapy has been based on cytotoxic agents, increasing evidences point to the potential of differentiation-based therapies[2–4]. This approach is particularly striking in acute promyelocytic leukemia (APL), where the treatment of patients with all-trans-retinoic acid (ATRA) has resulted in the induction of myeloid differentiation of the leukemic blasts and improved long-term survival[4,5]. Other types of AML, which include approximately 90% of AML cases, have similar defects in differentiation. Therefore, suitable inducers with capabilities to trigger differentiation are yet to be discovered[6].
Numerous leukemia cell lines have been studied to understand the mechanisms and efficiency of different agents on tumor cell differentiation and proliferation. Among these cells, the human leukemia U937 cell line has been accepted as an excellent experimental model for studying monocyte/macrophage differentiation[7,8]. According to a widely accepted French-American-British classification, U937 cells are considered as an AML-M5 subtype, which mainly represents promonocytic cells[9]. Various agents such as vitamin D3 derivatives and 12-O-tertadecanoyl-phorbol-13-acetate (TPA) can induce differentiation of these cells, but clinical administration of these agents have not been too promising[8,9]. The KG1 cell line, with minimal extent of differentiation and a main population of myeloblasts and promyelocytes represent another group of AML that is classified as AML-M1 subtype[9,10]. Indeed, this cell line does not respond to most differentiating agents [11]. For example, KG1 cells do not undergo terminal differentiation by ATRA, however, they do differentiate into macrophages in response to TPA treatments[12].
Following the search for suitable candidates, it has been established that purine nucleotides and nucleosides are capable of differentiating different tumor cell lines[13–15]. Indeed, ATP is known as a cytotoxic agent with the ability to trigger apoptosis in most leukemia cell lines, such as U937 cells[13,16,17]. In addition, the differentiating potential of GTP has been reported using different human cells, such as PC12 neuronal[18], B16 melanoma[19] and K562 erythroleukemia cells[20,21]. Following the GTP treatment of K562 cells, a sharp increase in differentiation along with enhanced γ-globin expression has been documented[20,21]. Despite this potent capability of GTP in induction of terminal differentiation of K562 cells, its efficiency on other cancerous cell lines (including AML cells) remains to be disclosed.
This study was designed to evaluate the probable role of GTP in the differentiation of two human AML cell lines (U937 and KG1). Our results revealed that GTP not only acts as a potent growth inhibitory and differentiating agent in both cell types, but also is capable of leading the cells to apoptosis after their S-phase arrest.
Materials and methods
Materials The cell culture medium (RPMI-1640), fetal bovine serum (FBS) and penicillin-streptomycin were purchased from Gibco BRL Life Technologies (Paisley, Scotland). The culture plates were obtained from Nunc (Roskilde, Denmark). Propidium iodide (PI), 12-O-tetradecanoyl-phorbol-13-acetate (TPA), nitroblue tetrazolium (NBT) and Wright-Giemsa stains were purchased from Sigma Chemical (St Louis, MO, USA). Ethidium bromide and RNase were obtained from Pharmacia LKB Biotechnology (Uppsala, Sweden). Guanosine 5'-triphosphate (GTP) was purchased from Aldrich Chemical Co Ltd. (Gillingham Dorset-England). GTP was dissolved in aqueous solution and was stored at concentrations of 20 mmol/L at -20 °C.
Cell culture The human U937 and KG1 cell lines, obtained from Pasteur Institute of Iran (Tehran, Iran), were cultured in RPMI-1640 medium supplemented with FBS (10%, v/v), streptomycin (100 µg/mL) and penicillin (100 U/mL) in CO2 humidified atmosphere at 37 ºC. The number of viable cells was estimated by trypan blue exclusion test. Cell number was assessed using a hemocytometer and the percent of growth inhibition was calculated relative to untreated control cells.
Cell-cycle analyses For cell-cycle analyses, the PI method as described by Nicoletti et al was used[22]. Exponentially growing U937 and KG1 cells (1×10⁵ cells/well) were treated with 100 µmol/L GTP for different time intervals. After harvesting, the cells were permeabilized with cold ethanol, stained with 500 µL PI (50 µg/mL in 0.1% Triton X-100/0.1% sodium citrate) and subjected to analyses by flow cytometry (Partec PAS, Münster, Germany). Based on PI staining, the cells with sub-G1 pattern were considered as apoptotic cells. Parallel to nuclear PI fluorescence, the cells size and complexity were also evaluated. According to the light scattering analyses, apoptotic nuclei showed lower forward scatter values along with higher sideward scatter values. Cell debris and small particles were excluded from the analysis by forward/sideward scatter criteria as described by Nicoletti et al[22]. The population of G0/G1, S, and G2/M were determined using Multicycle Cell Cycle Software (Partec PAS, Münster, Germany). The results are expressed as the percentage of the cells in each phase.
Annexin-V-FITC/PI double staining assays of the apoptotic cells Annexin-V binding was performed using an Annexin-V-FITC kit (Biosource, Camarillo, CA, USA) as described by the manufacturer. The cells (1×10⁵ cells/well) were treated with 100 µmol/L GTP for different time intervals. After harvesting, the cells were washed with PBS and suspended in 100 µL Annexin-V binding buffer (containing 10 mmol/L HEPES/NaOH, pH 7.4, 140 mmol/L NaCl, 2.5 mmol/L CaCl2). The cells were then double stained with 5 µL FITC-labeled Annexin-V and 10 µL PI buffer (containing 50 µg/mL in PBS), incubated for 20 min at room temperature and analyzed by flow cytometry (Partec PAS). Annexin-V does not bind to viable cells but binds to cells at the early stage of apoptosis.
DNA fragmentation assay DNA fragmentation in U937 cells was evaluated by Quick Apoptotic DNA Ladder Detection Kit from Biosource. U937 cells (1×10⁵ cells/well) were treated with 100 µmol/L GTP for 96 h. The cells were collected and the soluble DNA fragments were extracted from the cells. DNA fragments were loaded onto a 1.5% agarose gel containing 0.5 µg/mL ethidium bromide in both the gel and the running buffer (1×Tris-borate-EDTA). The gel was run at 5 V/cm for 2 h and then photographed under UV transillumination.
Morphological evaluation of the differentiated cells The morphology of untreated and GTP-treated cells were studied up to 96 h of treatments using a phase-contrast microscope (Jena, Zeiss, Germany). Monocytic differentiation of the treated cells was evaluated using a light microscope after staining with Wright-Giemsa solution.
NBT reduction assay The U937 and KG1 cells (1×10⁵ cells/well) were cultured in 24-well plates and treated with different concentrations of GTP for various time intervals (24–96 h). After harvesting, the NBT reducing activity was determined[23]. The cells were harvested by centrifugation and suspended in 100 µL of NBT solution (4 mg/mL). After the addition of 100 µL of TPA solution (2 µg/mL), the cell suspension was incubated at 37 oC for 30 min. The differentiated cells were identified by their intracellular blue formazan deposits. A minimum of 400 cells of each sample were counted under a light microscope to determine the percent of differentiated cells.
Flow cytometric assessment of monocytic differentiation The expression of the differentiation markers (CD14 and CD11b) were evaluated by flow cytometry (Partec Pas). The cells were harvested at indicated times, washed twice with PBS, then incubated for 30 min at room temperature with 10 µL mouse anti-human PE-conjugated CD14 mAb (IQproduct, Groningen, The Netherlands) and mouse anti-human FITC-conjugated CD11b mAb (IQproduct). Two parameter analyses were performed using flow cytometry. Mouse isotypes matching Immunoglobulin G (IgG) were used to set threshold parameters for flow cytometry.
Simultaneous detection of CD14 and Annexin-V binding The cells (1×10⁵ cells/well) were treated with 100 µmol/L GTP for different time periods. After harvesting, the cells were suspended in Annexin-V binding buffer (containing 10 mmol/L HEPES/NaOH, pH 7.4, 140 mmol/L NaCl, 2.5 mmol/L CaCl2), double-stained with 5 µL FITC-labeled Annexin-V and 10 µL PE-conjugated anti-CD14 antibody (IQproduct, Groningen, The Netherlands), then incubated for 30 min at room temperature. PE-and FITC-conjugated mouse IgG monoclonal antibodies with unrelated specificities were always used as control. After staining, the cells were washed with cold PBS and analyzed by flow cytometry[24]. PE- and FITC-conjugated mouse IgG mAb with unrelated specificities were used as control for instrumental set ups.
Results
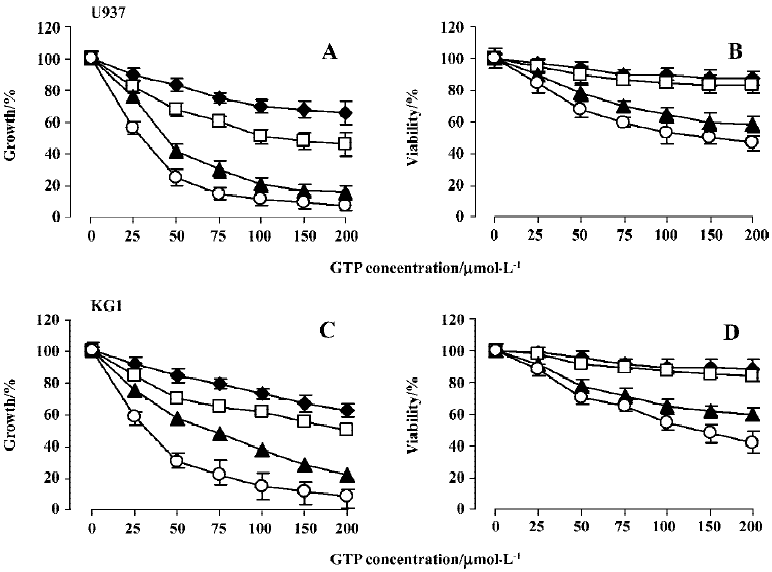
GTP inhibits growth and viability of U937 and KG1 cells The effects of different concentrations of GTP on growth and viability of U937 and KG1 cells were studied for various time intervals. Figure 1A and 1C illustrate growth inhibition of leukemic cells after a single dose treatment with variable concentrations (25–200 µmol/L) of GTP for different exposure times. As shown, the growth inhibitory effects of GTP in U937 and KG1 cells was evident after 24 h of exposure and continued to increase in a time-dependent manner, reaching a maximum value at 72–96 h of treatment. Indeed, after 24, 48, 72, and 96 h of treatment with 100 µmol/L GTP the growth of the cells was inhibited by 30%, 45%, 65%, and 88% for U937 and by 28%, 50%, 79%, and 84% for KG1 cells, respectively. These effects were also dose-dependent. For example, after 96 h of treatment with concentrations of 50, 100, and 200 µmol/L GTP, the growth of the cells was inhibited by 80%, 88%, and 95% for U937 cells and by 81%, 84%, and 90% for KG1 cells, respectively. These results indicate that these leukemia cells have nearly similar sensitivity to the GTP. The viability of the cells was evaluated using trypan blue exclusion test. As shown in Figure 1B and 1D, no detectible cytotoxic effect was observed up to 48 h of exposure to 100 µmol/L GTP, whereas cell growth was significantly inhibited during the same time. Interestingly, viability decreased after 48 h and a significant cell death was observed between 72–96 h of treatment. These results suggest that inhibition of proliferation is the most prominent effect of GTP up to 48 h of treatment and the cell death occurs at longer treatment times. Apparently, the activity of GTP is very noticeable in CD34-positive KG1 cells, which are believed to be resistant to many anti-leukemic drugs[25]. In addition, because U937 and KG1 cells lack a functional p53 protein, the GTP effects seem to be p53-independent[11]. Based on the results presented in Figure 1, our subsequent analyses were achieved on cells treated with 100 µmol/L GTP.
GTP induces cell-cycle arrest and apoptosis Because the GTP exerted profound effects on growth and viability of the cells (Figure 1), we were interested in studying the pattern of cell-cycle distribution of GTP-treated cells. Cell-cycle analyses by flow cytometry (Figure 2A) revealed an accumulation of cells in the S-phase of the cell cycle. Based on Figure 2A, the control U937 cells were distributed among G0/G1-, S-, and G2/M-phases by almost 51%, 30% and 19%, respectively. After treatment of U937 cells with 100 µmol/L GTP for 24 and 48 h, an increase in the percent of S-phase cells was observed (24 h, 41% and 48 h, 56% compared to approximately 2%–4% variation in control cells). Interestingly, this S-phase arrest was followed by the appearance of a sub-G1 peak after 72 and 96 h. Similar results were obtained after treatment of KG1 cells with 100 µmol/L GTP, so that the percent of S-phase cells were 38% and 62% after 24 and 48 h of treatment, respectively, compared to 23% in control cells (Figure 2A). Indeed, the appearance of a sharp sub-G1 peak after 72 h suggest that apoptosis has occurred (after the observed S-phase arrest).
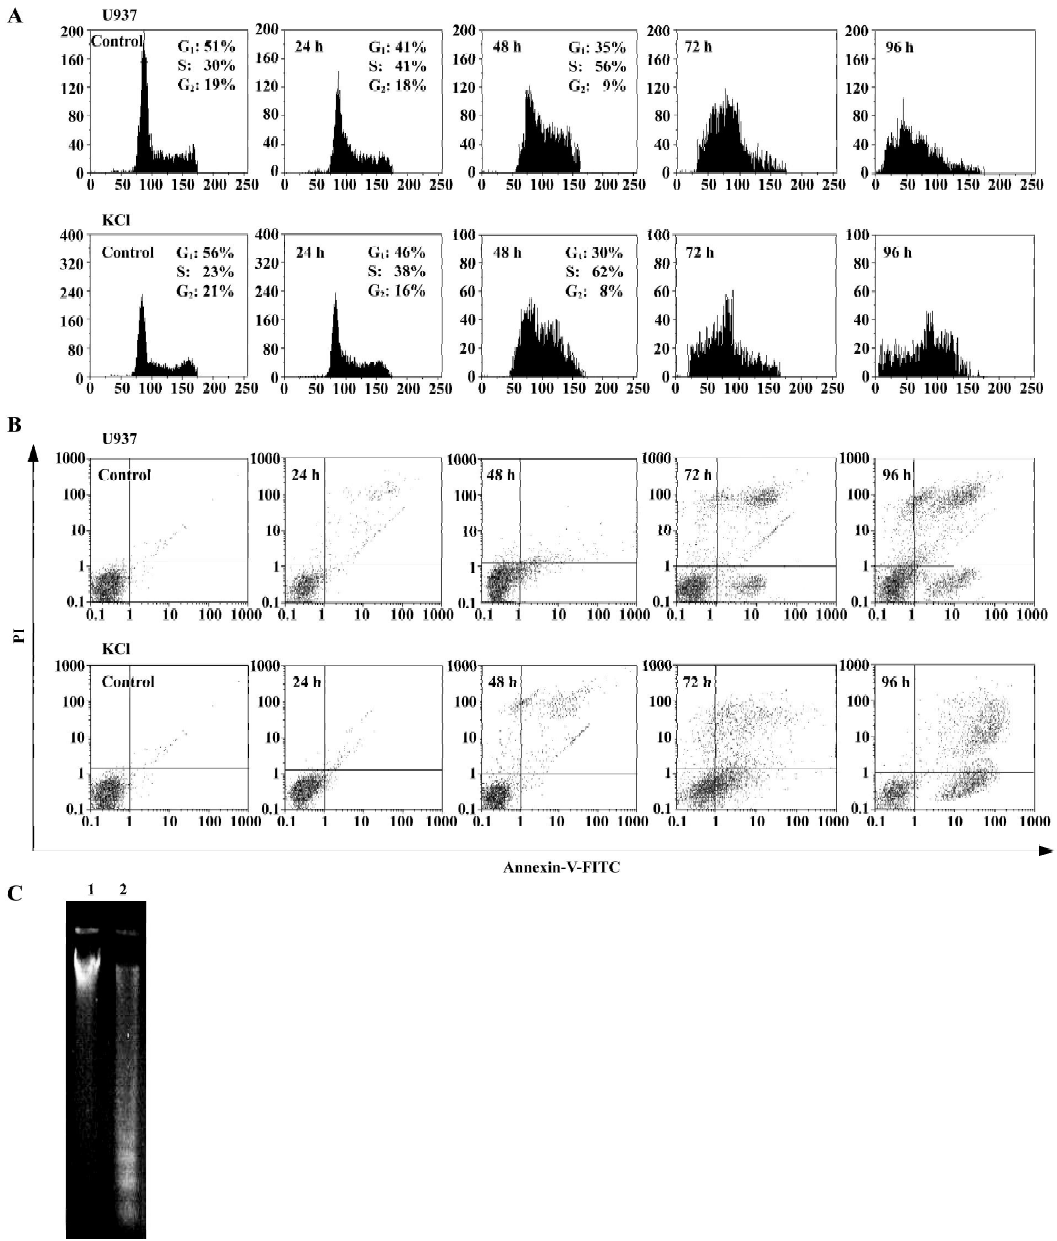
The occurrence of apoptosis was further confirmed using Annexin-V/PI double staining. The detection of the exposed phosphatidylserine by Annexin-V has been shown to be a general and early marker of apoptosis in hematopoietic and blood cells as a result of redistribution of the plasma membrane of the cells following the occurrence of apoptosis. Consistent with previous results (Figure 1B and 1D), apoptosis was mostly observed after 72 h of exposure to GTP (Figure 4A). Shifts from early (bottom-right quadrant in Figure 4B) to late apoptosis or necrosis (top-right quadrants) were clearly evident in dot plots of Figure 2B. The occurrence of apoptosis was further documented by observing a laddering pattern in the gel electrophoresis of DNA obtained from the GTP-treated U937 cells (Figure 2C).
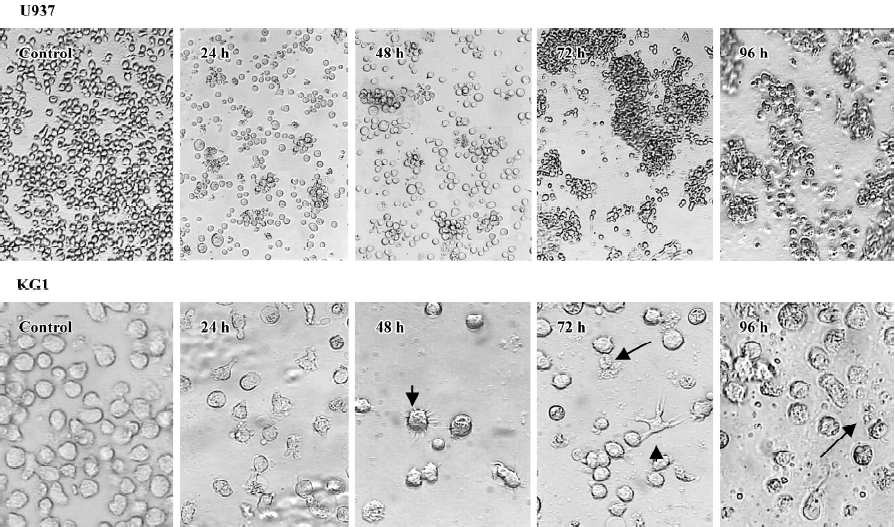
GTP induces monocyte/macrophage differentiation The effects of 100 µmol/L GTP on morphology of both U937 and KG1 cells in a time course of 96 h were also studied (Figure 3). Adherence of the cells to the culture plates followed by aggregation of the cells into colonies were observed between 24 to 72 h of GTP exposure. Adhesions to the culture plates were more evident in KG1 than U937 cells. Indeed, 9%–12% (n=4, P<0.05) of KG1 cells versus 5%–7% (n=4, P<0.05) in U937 cells were adhered to the culture plates. By 48 h of treatment, some of the adherent cells formed tiny projections on their surface, which by 72 h were converted to long pseudopodia (Figure 3, short arrows, 48 and 72 h). In addition, cell-cell adhesion (aggregation) was also observed among a high proportion of the cells between 24 to 72 h. At 96 h, the aggregated cells were rarely observed and apparently the cells were subjected to death (long arrows in Figure 3). These morphological changes are very similar to monocyte/macrophage differentiation of leukemia cells[26].
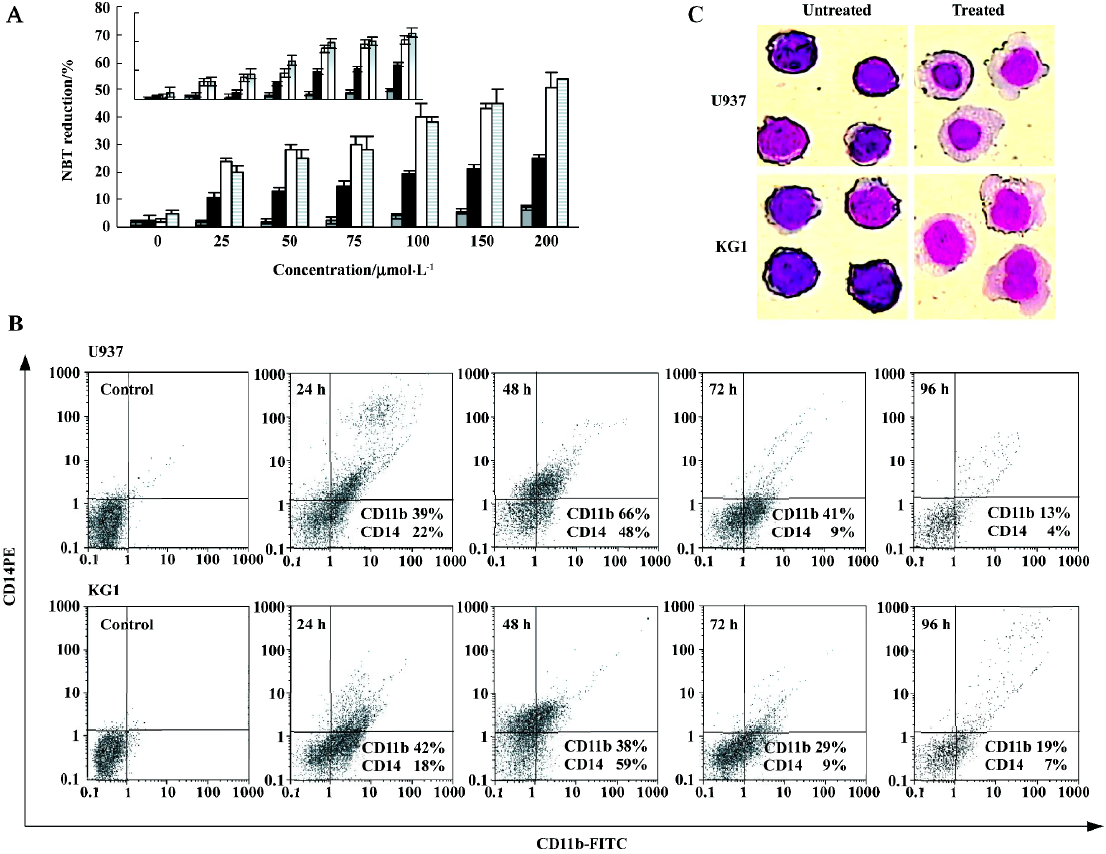
We next performed NBT reduction assay to assess functional evidence of myeloid maturation. One feature of myeloid maturation is the production of superoxide anion, which can be measured by the reduction of NBT. After 24–96 h of treatment with 100 µmol/L GTP, more than 50% of the cells were NBT-positive. As indicated in Figure 4A, GTP treatment of U937 cells with 100 µmol/L GTP for 48 and 72 h increased NBT reduction from 1%–3% (control cells) to 22% and 40%, respectively. Indeed, NBT reducing activity was slightly (5%–9%) evident after 24 h of treatment with 100 µmol/L GTP or even at higher doses (200 µmol/L) while after 72 h, 52% and 46% of U937 and KG1 cells were NBT positive, respectively. The results clearly indicate that similar to growth inhibition and viability reduction, the NBT reduction capability increases in a dose- and time-dependent manner.
To confirm monocyte/macrophage differentiation of U937 and KG1 cells, expression of cell-surface markers (CD14 and CD11b) were studied. It should be mentioned that CD14 represents an excellent marker of monocytic maturation because it is undetectable on the surface of monocyte precursors and increases dramatically during their differentiation to monocytes. The cell surface CD11b is another classical marker of myeloid differentiation that is believed to be involved in cell adhesion besides acting as a complement receptor[26,27]. The induction of CD11b expression by 100 µmol/L GTP increased time-dependently up to 48 h followed by a decrease after 72–96 h (Figure 4B). The expression of CD14 was also observed after 24 h, reached a maximum level at 48 h, decreased at 72 h and nearly disappeared at 96 h. Quantitatively speaking, after 24, 48, 72, and 96 h exposure of U937 cells to 100 µmol/L GTP almost 39%, 66%, 41%, and 13% of the cells were CD11b-positive, respectively. Under the same experimental conditions, the percent of CD14-positive cells were 21%, 48%, 9%, and 4% after 24, 48, 72, and 96 h, respectively. By dual-staining analyses with anti CD14 and anti-CD11b mAb, it was also possible to demonstrate that the two antigens were coexpressed in the same cell populations, further suggesting that GTP is capable of inducing the maturation along the monocytic lineage in a subpopulation of leukemia cells at least (Figure 4B).
We next investigated whether these phenotypic changes were accompanied by the appearance of the cells with macrophage features. Using Wright-Giemsa staining method (Figure 4C), morphologic features of the macrophage lineage, such as condensation of nucleus and protrusion of cytoplasm, were hardly detectable in untreated U937 and KG1 cells. However, by 48 h of GTP treatment, a large population of the treated cells showed macrophage features (Figure 4C).
Low level of CD14 expression is associated with higher level of apoptosis Attaining to our previous results, the occurrence of apoptosis was accompanied with a decrease in differentiation markers (especially CD14) at 72 and 96 h (Figures 2 and 5B). These observations indicate that the differentiation of a large portion of the cells, as a consequence of GTP treatment, ended in apoptosis. To confirm this, simultaneous analyses of CD14 and Annexin-V were performed using flow cytometry. According to the results presented in Figure 5 (A,B), 48 h after GTP treatment, a decrease in the population of CD14-positive cells was simultaneously compensated with an increase in the population of Annexin-V-positive cells. For example, after 96 h of treatment, nearly 40% of cells were CD14-negative and Annexin-V-positive (Figure 5A, 96 h).
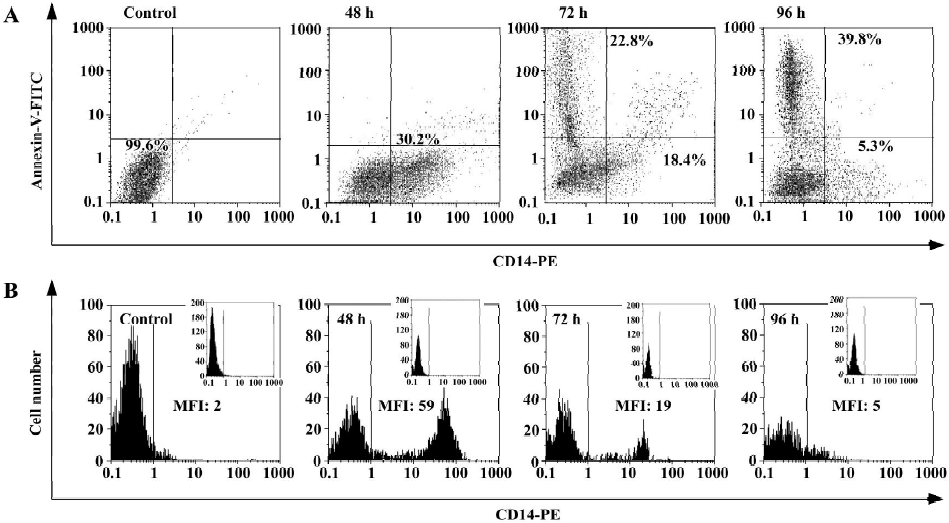
As depicted in Figure 5B, the mean fluorescence intensities of CD14 expression were also decreased from 59% (at 48 h) to 19% (at 72 h) and finally to 5% (at 96 h) following GTP treatment. Based on these figures, it can be concluded that both downregulation of CD14, at the cellular level, and also decrease in the population of CD14-positive cells occurred after 72 and 96 h of GTP treatment (Figure 5B).
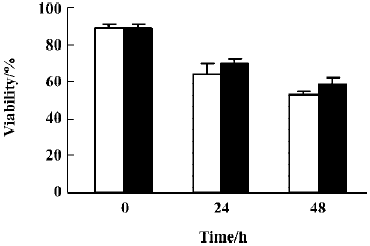
To further confirm the occurrence of apoptosis among the differentiated cells, we treated U937 cells with 100 µmol/L GTP for 48 h (the time required to let the cells to reach differentiation but not apoptosis). Then, the control and the treated cells were harvested and recultured in fresh medium with or without 100 µmol/L GTP for additional 24 and 48 h. The results indicated that similar patterns of viabilities for U937 cells were obtained regardless of the presence or absence of GTP in the reculturing medium. These results certainly indicate this view that the net effect of differentiation-induction by GTP is apoptosis among the treated cells (Figure 6).
Discussion
In this investigation, the differentiating efficiency of GTP in two human AML cell lines, KG1 and U937, was evaluated. According to the results, GTP at concentrations between 25 to 200 µmol/L had time-dependent growth inhibitory effects in both cell types. The flow cytometry investigation (Figure 2) revealed that the decrease in proliferation was associated with S-phase arrest. Indeed, the increase in the percent of S-phase cells was accompanied with a decrease in G0/G1 and/or G2/M cells up to 48 h. According to the published literature, cell-cycle arrest may be a prerequisite step in initiating terminal differentiation. In that respect, the G1 arrest has been the center of attention, although, there are some concerns regarding the involvement of G2- and/or S-phase arrests in differentiation[28,29]. Our results indicate that GTP induced S-phase arrests in both U937 and KG1 cells that were followed, at longer exposure times, by apoptosis. These observations correspond with a recent report about the cell-cycle effects of purine nucleotide and nucleosides using CHO and BHK mammalian cells[17,30]. The fact that we did not observe a G1-phase arrest may reflect the p53 status of the cells used in this study, which both lack a functional p53 protein.
Parallel to these observations, some differentiation responses were registered for U937 and KG1 cells after GTP treatments. The untreated U937 and KG1 cells have slightly irregular shapes with short microvilli, scarce cytoplasms and large bean-shaped nuclei. However, in the differentiated states, these cells showed typical monocytic criteria such as aggregation, condensation of nuclei and in some cases adhesion to the culture plates (Figure 3 and 4C). NBT reducing activity and increase in the expression of cell surface receptors (CD11b and CD14) confirmed that both cells were differentiated toward monocyte/macrophage lineage (Figure 4). Indeed, it has been established that monocyte/macrophage differentiation of myeloid leukemia cells is accompanied with integrin expression and cell adhesion. Especially, CD11b-mediated adhesion of leukemia cells in the course of monocytic differentiation is crucial for cell attachment and development of monocytic differentiation[26,27]. Parallel to these reports, we observed a good correlation between cell-cell adhesion (aggregation) and expression of CD11b. Indeed, the expression of CD11b increased up to 48 h followed by a decrease at 72–96 h (Figure 4B). A similar pattern was also obtained for CD14 meaning that the expression of this marker significantly decreased by the time that the cells underwent apoptosis (72 and 96 h). Therefore, the time-course studies of differentiation and apoptosis induction suggest that in fact GTP treatments of U937 and KG1 cells brings about differentiation-dependent apoptosis. To confirm this matter, CD14 versus Annexin-V flow-cytometry analyses were performed. The results presented in Figure 5A confirmed that a decrease in CD14-positive cells was compensated with an increase in apoptotic cell population. Despite these observations, there are some reports suggesting that the expression of CD14 antigen rescue monocytes from apoptosis[31–34]. In another approach (Figure 5B) it was shown that a decrease in the mean fluorescence intensity of treated cells was accompanied with a decrease in the percent of CD14 positive cells, suggesting downregulation of CD14 expression after 72–96 h of treatment. Therefore, it appears that a gradual decrease in CD14 content is required to induce apoptosis in GTP-differentiated cells. Our findings are in full agreement with the majority of published literature stating that a decrease in CD14 expression is required for the induction of apoptosis in monocytes[31–34]. Collectively, these results show that after GTP-mediated monocytic differentiation of U937 cells, a massive apoptosis, associated with the downregulation of CD14, occurs.
The ability of GTP to promote monocytic differentiation of the U937 and KG1 leukemic cell lines, besides inducing apoptosis, points to an additional role of GTP as an anti-neoplastic agent, at least for certain types of AML. As an alterative, apoptotic induction by terminal differentiation represents a new approach to cytodestruction of cancer cells by conventional anti-neoplastic agents with important biological implications[35]. In that respect, GTP possesses a high differentiating activity even in cells with multi-drug resistance gene product, P glycoprotein.
In conclusion, differentiating-induced apoptotic effects of GTP may provide promising solutions for the dilemma of therapy in patients with AML and with refractory or relapsed AML.
Acknowledgements
The authors thank Tahereh SHAHRESTANI and Hosein ASGARIYAN for their assistance in flow-cytometry analysis.
References
- Coco FL, Nervi C, Avvisati G, Mandelli F. Acute promyelocytic leukemia: a curable disease. Leukemia 1998;12:1866-80.
- Stegmaier K, Corsello SM, Ross KN, Wong JS, DeAngelo DJ, Golu TR. Gefitinib induces myeloid differentiation of acute myeloid leukemia. Blood 2005;106:2841-8.
- Wang ZY. Ham-Wasserman lecture: treatment of acute leukemia by inducing differentiation therapy and apoptosis. Hematology 2003.1-13. (Am Soc Hematol Edu Program).
- Spira AL, Carducci MA. Differentiation therapy. Curr Opin Pharmacol 2003;3:338-436.
- Bruserud O, Gjertsen BT. New strategies for the treatment of acute myelogenous leukemia: differentiation induction – present use and future possibilities. Stem Cells 2000;18:157-65.
- Sachs L. The control of hematopoiesis and leukemia: from basic biology to the clinic. Proc Natl Acad Sci USA 1996;93:4742-9.
- Sundstron C, Nillsson K. Establishment and characterization of a human histiocytic lymphoma cell line (U-937). Int J Cancer 1976;17:565-72.
- Koeffler HP, Golde DW. Human myeloid leukemia cell lines: a review. Blood 1980;56:344-50.
- Rizzo MG, Zepparoni A, Cristofanelli B, Scardigli R, Crescenzi M, Blandio G, et al. Wt-p53 action in human leukemia cell lines corresponding to different stages of differentiation. Br J Cancer 1998;77:1429-38.
- Koeffler HP, Billing R, Sparkes RS, Golde DW. An undifferentiated variant derived from the human acute myelogenous leukemia cell line (KG-1). Blood 1980;56:265-73.
- Ahmed N, Laverick L, Sammons J, Baumforth KRN, Hassan HT. Effect of all-trans retinoic acid on chemotherapy induced apoptosis and down-regulation of Bc1-2 in human myeloid leukaemia CD34 positive cells. Leukemia Res 1999;23:741-9.
- Wang H, Zheng X, Behm FG, Ratnam M. Differentiation-independent retinoid induction of folate receptor type beta, a potential tumor target in myeloid leukemia. Blood 2000;96:3529-36.
- Chow SC, Kass GE, Orrenius S. Purines and their role in apoptosis. Neuropharmacology 1997;36:1149-56.
- Lemoli RM, Ferrari D, Fogli M, Rossi L, Pizzirani C, Forchap S, et al. Extracellular nucleotides are potent stimulators of human hematopoietic stem cells in vitro and in vivo. Blood 2004;104:1662-70.
- Rathbone MP, Middlemiss PJ, Gysbers JW, Andrew C, Herman MA, Reed JK, et al. Trophic effects of purines in neurons and glial cells. Prog Neurobiol 1999;59:663-90.
- Schneider C, Wiendl H, Ogilvie A. Biphasic cytotoxic metabolism of extracellular ATP on U-937 human histiocytic leukemia cells: involvement of adenosine generation. Biochim Biophys Acta 2001;1538:190-205.
- Rapaport E. Treatment of human tumor cells with ADP or ATP yields arrest of growth in the S phase of the cell cycle. J Cell Physiol 1983;114:279-83.
- Di Iorio P, Ballerini P, Teraversa U, Nicoletti F, Alimonti I, Kleywegt S, et al. The antiapoptotic effect of guanosine is mediated by activation of the PI3-kinase/AKT/PBK pathway in culture rat astrocytes. Neuroscience 2004;46:356-68.
- Giotta GJ, Smith JR, Nicolson GL. Guanosine 5'-triphosphate inhibits growth and stimulates differentiated functions in B16 melanoma cells. Exp Cell Res 1978;15:385-93.
- Osti F, Corradini FG, Hanau S, Matteuzzi M, Gambari R. Human leukemia K562 cells: induction of erythriod differentiation by guanine, guanosine and guanine nucleotides. Haematologica 1997;82:395-401.
- Morceau F, Dupont C, Palissot V. GTP-mediated differentiation of the human K562 cell line: transient overexpression of GATA-1 and stabilization of the α-globin. Leukemia 2000;14:1589-97.
- Nicoletti I, Migliorati G, Pagliacci MC, Grignani F, Riccardi C. A rapid and simple method for measuring thymocyte apoptosis by propidium iodide staining and flow cytometry. J Immunol Methods 1991;139:271-9.
- Yazdanparast R, Moosavi MA, Mahdavi M, Sanati MH. 3-Hydrogenkwadaphnin from dendrostellera lessertii induces differentiation and apoptosis in HL-60 cells. Planta Med 2005;71:1112-7.
- Gockel HR, Lugering A, Heidemann J, Schmidt M, Domschke W, Kucharzik T, et al. Thalidomide induces apoptosis in human monocytes by using a cytochrome c-dependent pathway. J Immunol 2004;172:5103-9.
- Hassan HT. Ajoene (natural garlic compound): a new anti-leukaemia agent for AML therapy. Leukemia Res 2004;28:667-71.
- Hass R, Bartels H, Topley N, Hadam M, Köhler L, Goppelt-Strube M, et al. TPA-induced differentiation and adhesion of U937 cells: changes in ultrastructure, cytoskeletal organization and expression of cell surface antigens. Eur J Cell Biol 1989;48:282-93.
- Prudovsky I, Popov K, Akimov S, Servo S, Zelenin A, Meinhardt G, et al. Antisense CD11b integrin inhibits the development of a differentiated monocyte/macrophage phenotype in human leukemia cells. Eur J Cell Biol 2002;81:36-42.
- Bernhard D, Tinhofer I, Toko M, Hubi H, Ausserlechner MJ, Gril R, et al. Resveratrol causes arrest in the S-phase prior to Fas-independent apoptosis in CEM-C7H2 acute leukemia cells. Cell Death Differ 2000;7:834-42.
- Mlejnek P, Kozubek S. Adenine-induced arrest of mammalian cells in early S-phase is related to the prevention of DNA synthesis inhibition caused by gamma-irradiation. Int J Radiol Biol 1997;71:505-13.
- Carvalhal AV, Santos SS, Calado J, Haury M, Carrondo MJ. Cell growth arrest by nucleotides, nucleosides and bases as a tool for improved production of recombinant proteins. Biothechnol Prog 2003;19:69-83.
- Heidenreich S, Schmidt M, August C, Cullen P, Rademaekers AH, Pauels G. Regulation of human monocyte apoptosis by the CD14 molecule. J Immunol 1997;159:3178-88.
- Zhang DE, Hetherington CJ, Gonzalez DA, Chen HM, Tenen DG. Regulation of CD14 expression during monocytic differentiation induced with 1α, 25-dihydroxyvitamin D3. J Immunol 1994;153:3276-84.
- Kanatani Y, Kasukabe T, Okabe-Kado J, Yamamoto-Yamaguchi Y, Nagata N, Motoyoshi K, et al. Role of CD14 expression in the differentiation-apoptosis switch in human monocytic leukemia cells treated with 1α, 25-dihydroxyvitamin D3 or dexamethasone in the presence of transforming growth factor β. Cell Growth Differ 1999;10:705-12.
- Brackman D, Lund-Johansen F, Aarskog D. Expression of leukocyte differentiation antigens during the differentiation of HL-60 cells induced by 1α, 25-dihydroxyvitamin D3: comparison with the maturation of normal monocytic and granulocytic bone marrow cells. J Leukoc Biol 1995;58:547-55.
- Guzman ML, Jordan CT. Considerations for targeting malignant stem cells in leukemia. Cancer Control 2004;11:97-104.