
Determination of the inhibitory potential of 6 fluoroquinolones on CYP1A2 and CYP2C9 in human liver microsomes
Introduction
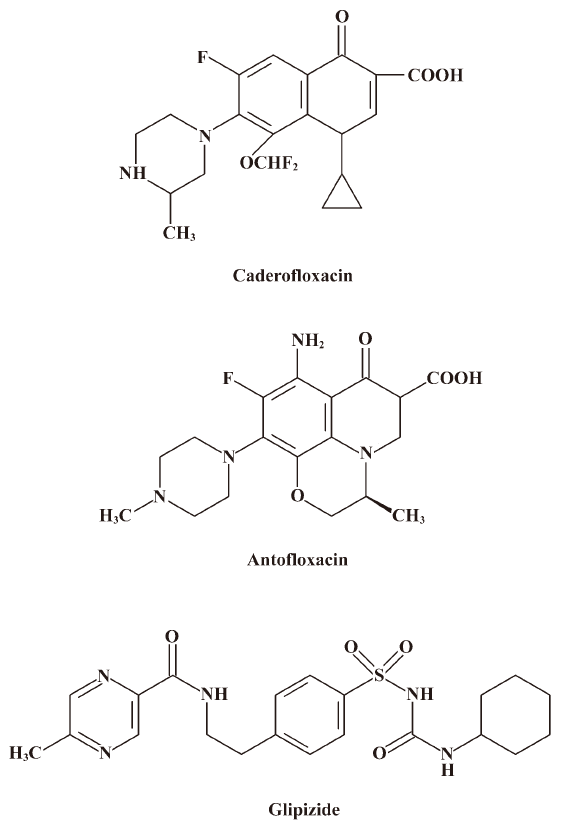
Fluoroquinolones that have efficient oral absorption, long serum elimination half-lives, good tissue distribution, and a broad range of activities against aerobic pathogens[1] have been proven to be very effective for treating bacterial infections, resulting in the widespread use of these drugs and the development of several new agents over the past decade. Antofloxacin and caderofloxacin are 2 new fluoroquinolones under clinical development in China (Figure 1). The in vitro antibacterial activity of antofloxacin was similar to that of levofloxacin (antofloxacin data on file); caderofloxacin was found to be effective against Gram-positive and -negative bacteria, exhibiting antibacterial activity against S aureus superior to ciprofloxacin, from which it is derived[2,3]. A lot of literature has reported that some fluoroquinolones cause an increase in the levels of theophylline or warfarin in plasma that lead to drug-drug interactions when quinolones are co-administered with these drugs[4–12]. For example, ciprofloxacin causes a decrease (30%) of the total body clearance of theophylline, which results in a series of clinical signs and symptoms of theophylline toxicity[5]. It is well known that a major contributing factor of the drug-drug interaction is the inhibition of cytochrome P450 (CYP) enzyme-mediated activities, of which human CYP1A2 is mainly responsible for theophyline metabolism and CYP2C9 for warfarin metabolism. Thus, it is essential to investigate the inhibitory effects on CYP1A2 and CYP2C9 inhibition of the 2 new fluoroquinolones, caderofloxacin and antofloxacin, and compare them with marketed fluoroquinolones. The most promising tool for this purpose is a high-throughput screening method based on liquid chromatography/mass spectrometry (LC-MS/MS) by monitoring the candidate drug’s effect on the metabolism of probe substrates for specific enzyme in in vitro human liver microsome cocktail incubation[13]. As we know, no LC-MS/MS method had been reported for the simultaneous determination of the inhibitory potential of these fluoroquinolones on CYP1A2 and CYP2C9 in in vitro human liver microsome cocktail systems so far. Therefore, the purpose of this study was: (1) to develop a rapid and sensitive LC-MS/MS method for simultaneously analyzing the metabolites of the CYP1A2 and CYP2C9 probe substrates in in vitro human liver microsome cocktail systems; and (2) to study the inhibitory potential of 2 new fluoroquinolones, caderofloxacin and antofloxacin, together with 4 marketed fluoroquinolones, moxifloxacin, gatifloxacin, levofloxacin, and ciprofloxacin, on the activity of CYP1A2 and CYP2C9 based on the developed method.
Materials and methods
Chemicals Phenacetin (PHE), tolbutamide (TOL), 4-hydroxytolbutamide (OHTOL), α-naphthoflavone (α-NF), sulfaphenazole (SUL), and NADPH tetrasodium salt were purchased from Sigma (St Louis, MO, USA). Paracetamol (PAR), ciprofloxacin, loratadine, diazepam, gatifloxacin, and levofloxacin were purchased from the National Institute for the Control of Pharmaceutical and Biological Products (Beijing, China). Antofloxacin and caderofloxacin were obtained from Anhui Global Pharmaceutical Co and Harbin Pharmaceutical Group (Harbin, China), respectively. Moxifloxacin and glipizide (GLI; 99.7% purity, internal standard) was kindly provided by Bayer HealthCare AG (German) and Beijing Honglin Pharmaceutical (Beijing, China) respectively. Acetonitrile and methanol (HPLC grade) were purchased from Caledon Laboratories (Georgetown, Canada), and formic acid (HPLC grade) was purchased from Dikma Technology (Richmond Hill, USA). All other reagents were of analytical grade.
Human liver microsome preparation Microsomes were prepared from human liver tissues from patients undergoing partial hepatectomy for the removal of metastasis tumors at Department of General Surgery, Beijing Cancer Hospital (Beijing, China). Informed consent was obtained from all of the patients. The samples were confirmed to be pathologically normal. The collection of liver tissues was approved by the Ethics Committee of Peking University, China (Beijing, China). The livers were transferred to ice immediately after surgical excision, cut into pieces, and stored at –70 ºC until the microsomes were prepared. A weight-balanced microsomal pool of 5 donors was prepared using a differential centrifugation method as described previously[14]. The liver was weighed and homogenized in 100 mmol/L potassium phosphate buffer (pH 7.4), and the homogenate was centrifuged at 10 000×g for 15 min at 4 ºC in a Tomos 3-18R centrifuge (Tomos Life Science Group, NJ, USA). The supernatant was then centrifuged at 105 000×g for 60 min at 4 ºC in an OTD-B Combi Sorvall ultracentrifuge (Sorvall Products, Newtown, USA) and the pellet was suspended in a storage buffer (100 mmol/L potassium phosphate buffer and 20% glycerol, pH 7.4) and stored at –70 ºC until use. Accurate protein content was determined by Bradford method[15].
Microsomal incubations and sample preparation Incubation mixtures were prepared in a total volume of 200 μL with final component concentrations as follows: 100 mmol/L potassium phosphate buffer (pH 7.4), 1 mmol/L NADPH, 0.5 g/L human liver microsome, and CYP1A2 and CYP2C9 probe substrates in cocktail or individual substrates (10 μmol/L for PHE/CYP1A2, 100 μmol/L for TOL/CYP2C9). The incubation conditions were optimized to ensure the linear formation of metabolites. After 5 min pre-incubation at 37 ºC, the reaction was initiated by the addition of 1 mmol/L NADPH. The incubation was performed for 20 min at 37 ºC in a water bath with gentle shaking, then the reaction was terminated by placing the incubation mixtures on ice and adding 2 mL chilled ethyl acetate. 40 μL GLI (2 mg/L), used as an internal standard, was added to the final mixture. After shaking for 15 min and centrifugation (3000×g, 10 min), the organic phase was separated and evaporated to dryness at 40 ºC under a gentle stream of nitrogen .The residues were dissolved in 200 μL acetonitrile. A 10 μL aliquot of the solution was injected into the LC-MS/MS for analysis.
Standard and quality controls The mixed calibration standards of the metabolites of the probe substrates (0.06−13.96 μmol/L for PAR, 0.03−7.91 μmol/L for OHTOL, n=3) and quality control (QC) samples (0.16, 1.31, 10.47 μmol/L for PAR, 0.09, 0.74, and 5.94 μmol/L for OHTOL, n=9) were prepared. The samples (200 μL) contained 100 mmol/L potassium phosphate buffer (pH 7.4), 0.5 g/L human liver microsome, and varying concentrations of PAR/OHTOL, either for the calibration curves or for the QC. 40 μL GLI (2 mg/L) and 2 mL ethyl acetate were then added. All of the samples were subjected to the sample preparation procedure described earlier.
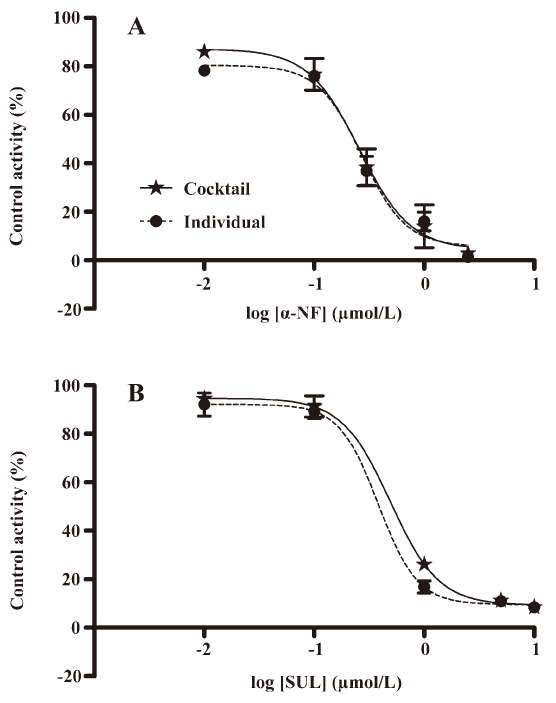
Validation of the in vitro cocktail system by known CYP enzyme inhibitors Specific inhibitors towards the 2 human hepatic CYP isoenzymes (α-NF for CYP1A2, and SUL for CYP2C9) were incubated with cocktail substrates and individual substrates alone to validate the cocktail method. The inhibitory incubation mixtures (200 μL) contained 100 mmol/L potassium phosphate buffer (pH 7.4), 0.5 g/L microsomal protein, 1 mmol/L NADPH, 10/100 μmol/L PHE/TOL, and inhibitors of various concentrations. Then the same incubation and sample preparation procedures described earlier were applied. The inhibitor concentrations varied within a range based on the literature-reported IC50 values (α-NF/CYP1A2/0.01–2.5 μmol/L, SUL/CYP2C9/0.01–10 μmol/L)[16–23]. Negative control (in the absence of the inhibitor) incubations were also conducted. All samples were performed in triplicate.
Investigating the inhibitory potential of fluoroquinolones on CYP1A2 and CYP2C9 Two new fluoro quinolones, caderofloxacin and antofloxacin, together with 4 marketed fluoroquinolones, moxifloxacin, gatifloxacin, levofloxacin, and ciprofloxacin, were incubated with cocktail substrates, respectively, to investigate the inhibitory potential of these fluoroquinolones on the activity of CYP1A2 and CYP2C9. The incubation mixtures (200 μL) contained 100 mmol/L potassium phosphate buffer (pH 7.4), 0.5 g/L microsomal protein, 1 mmol/L NADPH, 10/100 μmol/L PHE/TOL, and various concentrations of fluoroquinolone (0.1−200 mg/L). All other conditions (incubation and sample preparations) were the same as those described earlier. The fluoroquinolone concentrations varied between 0.1- to 100-fold, as reported in previous preclinical studies or human plasma maximum concentrations[24–28]. Negative control (in absence of fluoroquinolone) incubations were also conducted. All samples were performed in triplicate.
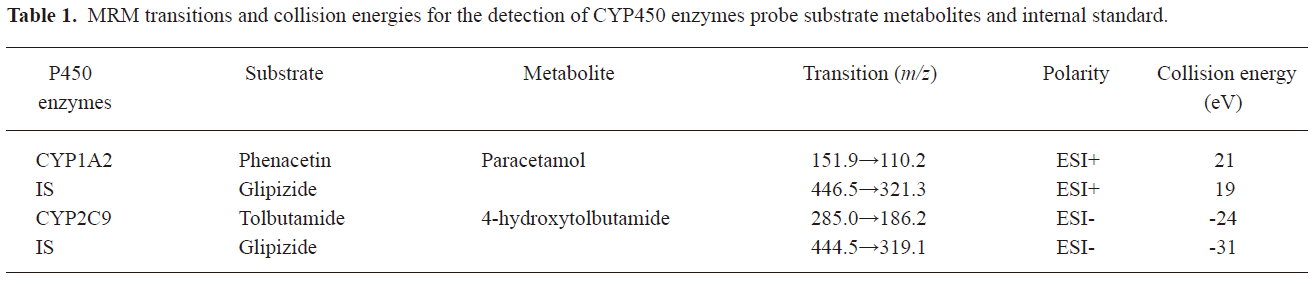
LC-MS/MS conditions The samples were analyzed using an API 3000 LC-MS/MS system (Applied Biosystems, Foster City, CA, USA) mass spectrometer equipped with an electrospray ionization source. The HPLC system consisted of a solvent pump and an autosampler (Agilent, USA). Aliquots (10 μL) were injected onto an Agilent C8 column (4.6*100 mm with 3.5 μm particle size). The mobile phase was acetonitrile: 0.1% formic acid=80:20 (v/v) and the eluent flow rate was 300 μL/min. The total run time was 4.5 min for each sample. The mass spectrometer was operated either in positive (spray voltage set at 5200 V) or negative mode (spray voltage set at –4800 V), with the main operating parameters as follows: ion source temperature, 450 ºC, nebulizing gas, 10 units; curtain gas, 7 units; and collision gas (nitrogen) pressure, 2 units (Table 1). Quantitation was performed by multiple reaction monitoring (MRM), using GLI as an internal standard to establish peak area ratios (GLI was detected in both modes). Quadrupoles Q1 and Q3 were set at unit resolution. Data acquisition was processed by Analyst software (version1.2; Applied Biosystems, USA).
Full table
Data analysis The P450-mediated activities in the presence of inhibitors or fluoroquinolones were expressed as percentages of the corresponding control activities. IC50 values were calculated in a sigmoid dose–response mode via GraphPad Prism 4.0 software (GraphPad, San Diego, CA, USA).
Results
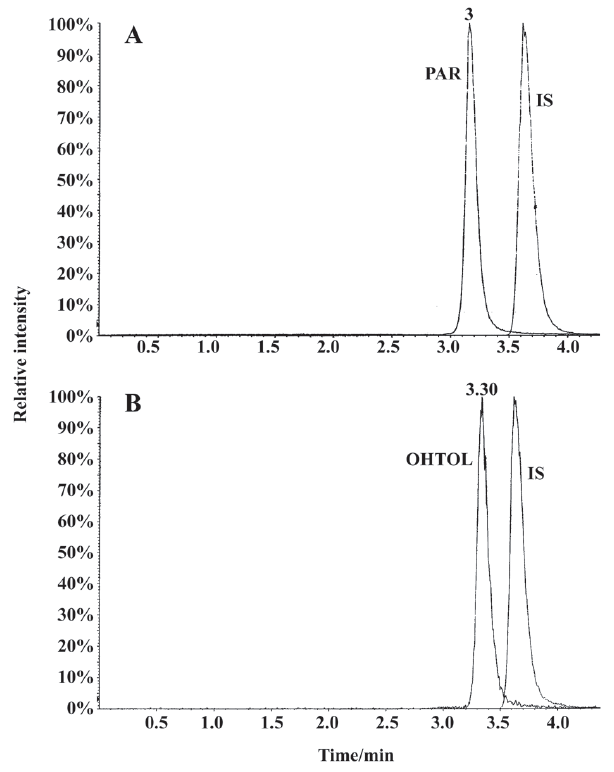
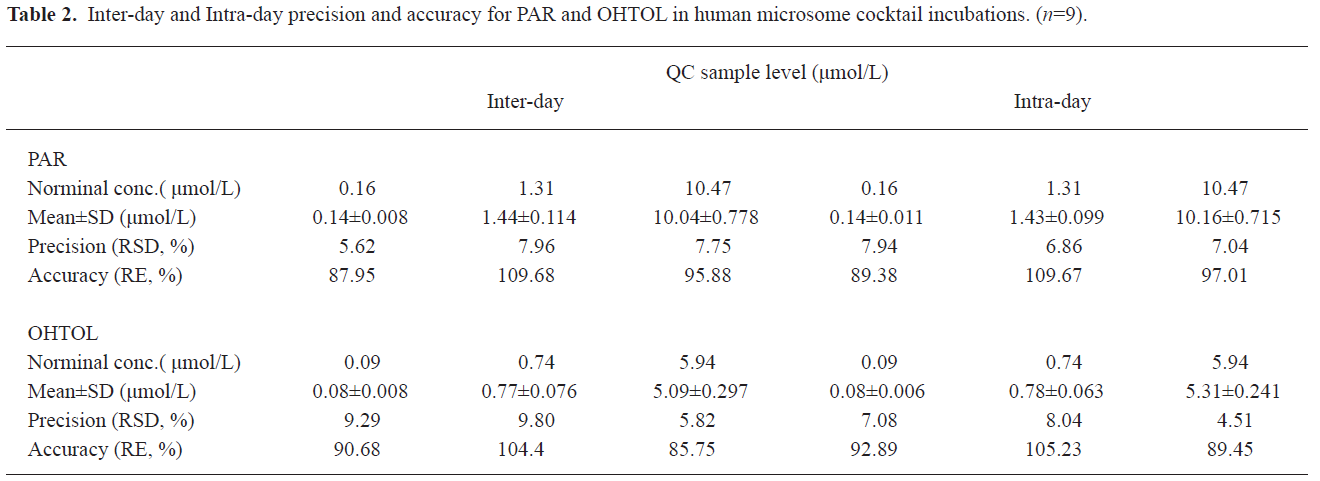
Analysis method validation The MRM chromatograms of metabolites of in vitro human liver microsome cocktail incubation systems showed that the retention times for PAR, OHTOL, and GLI were approximately 3.2, 3.4, and 3.6 min, respectively (Figure 2). In this study, a 3 d validation was performed to evaluate the LC-MS/MS method for the quantification of the marker metabolites in microsomal incubations. The calibration ranges of 0.06 −13.96 μmol/L for PAR and 0.03−7.91 μmol/L for OHTOL were proven to be sufficient for the determination of metabolites generated in microsomal incubations. The calibration curve for PAR was Y=3.24X+0.0198, r=0.9953 and for OHTOL Y=3.93X+0.0847, r=0.9985. The lower limit of quantification was 0.06 μmol/L for PAR and 0.03 μmol/L for OHTOL, with acceptable accuracies and precisions lower than 15%. The limit of detection was 0.03 μmol/L for PAR and 0.019 μmol/L for OHTOL, with a signal-to-noise ratio >3. The method accuracy was determined by calculating the relative error, and the precision was determined by calculating the relative standard deviation. Both were determined by QC samples at 3 concentrations in 3 separate days. Overall, the interday accuracy for all analytes was between 85.75% and 109.68% with precision less than 9.29% (Table 2). Matrix effect values at the 3 QC concentrations ranged from 86.4% to 117.1% for all analytes, suggesting ion suppression or enhancement from the incubation matrix can be negligible in this experiment. The extraction recoveries yielded a mean recovery greater than 80% for PAR and 60% for 4-hydroxytolbutamide.
Full table
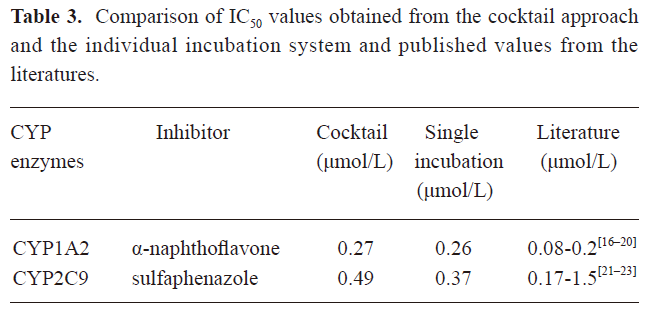
Validation of the in vitro cocktail system by determining the IC50 values of CYP enzyme inhibitors The method was validated by incubating known specific CYP enzyme inhibitors (α-NF/CYP1A2/0.01–2.5 μmol/L, SUL/CYP2C9/0.01–10 μmol/L) in the CYP450 enzyme substrate cocktail system, as well as in the individual CYP enzyme substrate incubation system in vitro (Figure 3). The 2 incubation systems generated similar IC50 values for each CYP enzyme inhibitor and all of the measured IC50 values were in agreement with the range of previously-reported values in the literature (Table 3)[16–23]. This demonstrated that IC50 values can be accurately determined in the cocktail system simultaneously as well as incubating 2-probe substrates, respectively.
Full table
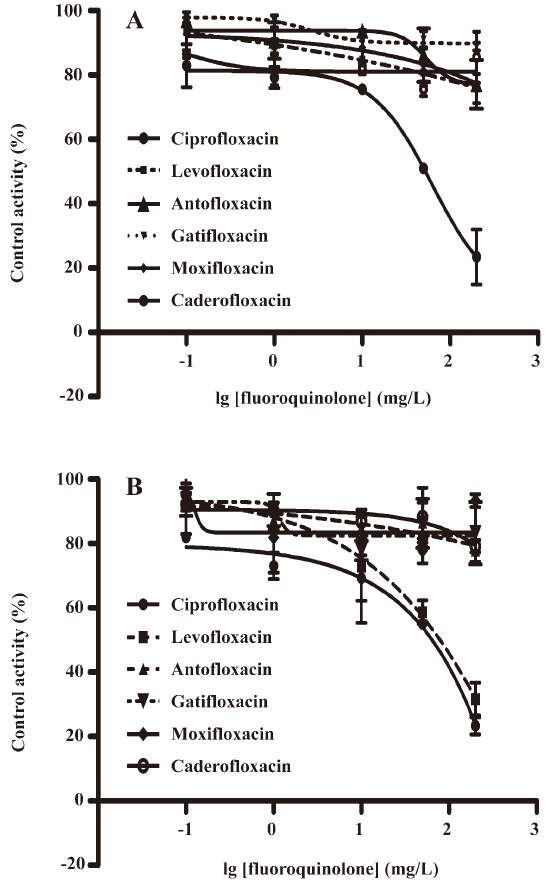
Investigating the inhibitory potential of fluoroquinolones on CYP1A2 and CYP2C9 We used the validated in vitro cocktail system to investigate the inhibitory potential of 2 new fluoroquinolones, caderofloxacin and antofloxacin, together with 4 marketed fluoroquinolones, moxifloxacin, gatifloxacin, levofloxacin, and ciprofloxacin, on the activity of CYP1A2 and CYP2C9. The incubation was performed with 5 different concentrations in the range of 0.1−200 mg/L for each fluoroquinolone, which covered the clinical relevant concentrations (0.1−3.6 mg/L)[24–28]. The results suggested ciprofloxacin as a weak inhibitor on both the activity of CYP1A2 (IC50 135 μmol/L) and CYP2C9 (IC50 180 μmol/L), levofloxacin only inhibited CYP2C9 (IC50 210 μmol/L), and caderofloxacin, antofloxacin, moxifloxacin, and gatifloxacin showed little or no inhibition on the activity of CYP1A2 and CYP2C9 at comparable concentrations (0−200 mg/L; Figure 4). These in vitro data correlated well with the preclinical studies and case reports describing the interactions between these fluoroquinolones and theophylline or warfarin.
Discussion
It is important to select specific probe substrates for each P450 enzyme because P450 enzymes are involved in the metabolism of drugs that may result in substrate interaction. In this study, we selected probe substrates for CYP1A2 and CYP2C9 based on a representative list of preferred and acceptable in vitro probe substrates recommended by the Food and Drug Administration (US)[29]. The simultaneous incubation of the 2 substrates might lead to various problems, such as the solubility of probe substrates and the inhibition of P450 activity by solvent and substrate interactions in cocktail incubations. Our results indicated that there was no substantial inhibition (<20%) of CYP1A2 and CYP2C9 at 0.5% acetonitrile; similar results have been reported by others[30–33]. These findings suggest that acetonitrile is the most optimal solvent for dissolving PHE and TOL in cocktail incubations for in vitro metabolism studies. Thus, the stock solutions of PHE and TOL were dissolved in acetonitrile, and then diluted with 100 mmol/L potassium phosphate buffer (pH 7.4) to achieve working solutions resulting in 0.5% (v/v) acetonitrile in the final incubation mixture. Concentrations of the substrates were selected in order to compromise between the Km of the substrates and the sensitivities of the related assay. The substrate interference between PHE and TOL was assessed by comparing the formation of metabolites in incubations with cocktail substrates versus individual substrate. No substantial interference (<20%) was found at substrate concentrations of 10 μmol/L for PHE and 100 μmol/L for TOL (data not shown).
The high-throughput screening method usually generates complex samples, each containing multiple compounds with diverse chemical characteristics which demand different detection modes (positive /negative) for a single sample at most times. Previous literature usually adopts 2 internal standards for each mode, causing inconvenience to in vitro studies. In this study, PAR responded better in the positive mode, whereas OHTOL was better in the negative mode. Loratadine and diazepam were initially considered internal standards; both responded well in the positive mode, but showed little sensitivity in the negative mode. GLI was eventually chosen as the internal standard for in both modes. This is the first study to report on an internal standard that can be simultaneously determined in both positive and negative modes for a high-throughput LC-MS/MS screening method. The most optimal collision energy and spray voltage were determined by observing the maximum response obtained for the fragment ion peak m/z (Table 1). A liquid-liquid extraction method with ethyl acetate was chosen for the sample preparation throughout the study for little matrix effect and better extraction efficiency for all analytes.
In vivo animal tests provide a physiologically-relevant system for investigating drug–drug interactions, but well-documented interspecies differences limit the animal-to-human extrapolation. For example, elimination half-lives of antofloxacin in rats and humans were approximately 2 and 20 h, respectively[34,35], which indicated marked interspecies differences of antofloxacin metabolism. Therefore, human tissue systems have been developed to avoid the limitations of drug metabolism studies based on animal models to screen compounds preclinically. Human liver microsomes are now one of the most widely used in vitro test systems for investigating the inhibitory potential of new chemical entities on cytochrome P450[16–23]. However, variable enzyme expressions between donors may influence reproducibility, which would need a microsomal pool of several donors to avoid interindividual variability to be more reliable for prediction. This study is the first to use a high-throughput LC-MS/MS method to investigate the inhibitory potential of new fluoroquinolones on CYP1A2 and CYP2C9 in human microsome incubation systems, which can conduct inhibition studies efficiently and avoid the limitation of species differences. According to well-recognized rules[36], compounds are classified as potent (IC50≤1 μmol/L), marginal(1 μmol/L <IC50≤10 μmol/L), or weak (IC50>10 μmol/L) CYP enzyme inhibitors. When IC50 >50 μmol/L, the compound is regarded as a negligible inhibitor. The results obtained in the fluoroquinolone inhibition study suggested that caderofloxacin, antofloxacin, moxifloxacin, and gatifloxacin are negligible inhibitors to CYP1A2 and CYP2C9, which correlated well with case reports describing the interactions between these marketed fluoroquinolones and theophylline or warfarin[37,38]. These findings will further assist in the design of the 2 new fluoroquinolones’ clinical trials. This in vitro human liver microsome cocktail system can be used as a high-throughput model to efficiently screen similar compounds by LC-MS/MS for early identification of potential drug-drug interactions.
References
- Hooper DC, Wolfson JS. Fluoroquinolone antimicrobial agents. N Engl J Med 1991;324:384-94.
- Biedenbach DJ, Sutton LD, Jones RN. Antimicrobial activity of CS-940, a new trifluorinated quinolone. Antimicrob Agents Chemother 1995;39:2325-30.
- Masuda N, Takahashi Y, Otsuki M, Ibuki E, Miyoshi H, Nishino T. In vitro and in vivo antibacterial activities of CS-940, a new 6-fluoro-8-difluoromethoxy quinolone. Antimicrob Agents Chemother 1996;40:1201-7.
- Beckmann Elsässer W, Gundert-Remy U, Hertrampf R. Enoxacin –– a potent inhibitor of theophylline metabolism. Eur J Clin Pharmacol 1987;33:227-30.
- Maesen FP, Teengs JP, Baur C, Davies BI. Quinolones and raised plasma concentrations of theophylline. Lancet 1984;8401:530-5.
- Raoof S, Wollschlager C, Khan F. Serum theophylline levels are increased by ciprofloxacin (BAY 9687), a new quinolone antibiotic. Chest 1985;99 Suppl:32.
- Wijnands WJ, Van Herwaarden CL, Vree TB. Enoxacin raises plasma theophylline concentrations. Lancet 1984;8394:108-9.
- Wijnands WJ, Vree TB. Interaction between the fluoroquinolones and the bronchodilator theophylline. J Antimicrob Chemother 1988; 22 SupplC: 109–14.
- Ellis RJ, Mayo MS, Bodensteiner DM. Ciprofloxacin-warfarin coagulopathy: a case series. Am J Hematol 2000;63:28-31.
- Ravnan SL, Locke C. Levofloxacin and warfarin interaction. Pharmacotherapy 2001;21:884-5.
- Gheno G, Cinetto L. Levofloxacin–warfarin interaction Eur J Clin Pharmacol 2001;57:427-8. (letter).
- Jones CB, Fugate SE. Levofloxacin and warfarin interaction. Ann Pharmacother 2002;36:1554-7.
- Ansede JH, Thakker DR. High-throughput screening for stability and inhibitory activity of compounds toward cytochrome P450-mediated metabolism. J Pharm Sci 2004;93:239-55.
- Lake B. Preparation and characterization of microsomal fractions for studies on xenobiotic metabolism. In: Snell K, Mullock B, editors. Biochemical toxicology: a practical approach. Washington: IRL-Press; 1987. p 183–9.
- Bradford MM. A rapid and sensitive method for the quantitation of microgram quantities of protein utilizing the principle of protein–dye binding. Anal Biochem 1976;72:248-54.
- He F, Bi HC, Xie ZY, Zuo Z, Li JK, Li X, et al. Rapid determination of six metabolites from multiple cytochrome P450 probe substrates in human liver microsome by liquid chromatography/mass spectrometry: application to high-throughput inhibition screening of terpenoids. Rapid Commun Mass Spectrom 2007;21:635-43.
- Dierks EA, Stams KR, Lim HK, Cornelius G, Zhang H, Ball SE. A method for the simultaneous evaluation of the activities of seven major human drug-metabolizing cytochrome P450s using an in vitro cocktail of probe substrates and fast gradient liquid chromatography tandem mass spectrometry. Drug Metab Dispos 2001;29:23-9.
- Testino SA, Patony G. High-throughput inhibition screening of major human cytochrome P450 enzymes using an in vitro cocktail and liquid chromatography-tandem mass spectrometry. J Pharm Biomed Anal 2003;30:1459-67.
- Yuan R, Madani S, Wei XX, Reynolds K, Huang SM. Evaluation of cytochrome P450 probe substrates commonly used by the pharmaceutical industry to study in vitro drug interactions. Drug Metab Dispos 2002;30:1311-9.
- Shader RI, Granda BW, von Moltke LL, Giancarlo GM, Greenblatt DJ. Inhibition of human cytochrome P450 isoforms in vitro by zafirlukast. Biopharm Drug Dispos 1999;20:385-8.
- Yin H, Racha J, Li SY, Olejnik N, Satoh H, Moore D. Automated high throughput human CYP isoform activity assay using SPE LC/MS method: application in CYP inhibition evaluation. Xenobiotica 2000;30:141-54.
- Bu HZ, Knuth K, Magis L, Teitelbaum P. High throughput cytochrome P450 (CYP) inhibition screening via a cassette probe dosing strategy. Validation of a direct injection/online guard cartridge extraction tandem mass spectrometry method for CYP1A2 inhibition assessment. Eur J Pharm Sci 2001;12:447-52.
- Walsky RL, Obach RS. Validated assays for human cytochrome P450 activities. Drug Metab Dispos 2004;32:647-60.
- Pea F, Pavan F, Di Qual E, Brollo L, Nascimben E, Baldassarre M, et al. Urinary pharmacokinetics and theoretical pharmacodynamics of intravenous levofloxacin in intensive care unit patients treated with 500 mg b.i.d. for ventilator-associated pneumonia. J Chemother 2003;15:563-7.
- Wagenlehner FM, Kinzig-Schippers M, Tischmeyer U, Wagenlehner C, Sörgel F, Dalhoff A, et al. Pharmacokinetics of ciprofloxacin XR (1000 mg) versus levofloxacin (500 mg) in plasma and urine of male and female healthy volunteers receiving a single oral dose. Intern J Antimicrob Agents 2006;27:7-14.
- Fish DN. Evaluation of gatifloxacin pharmacokinetics and pharmacodynamics in severely ill adults in a medical Intensive Care Unit. Intern J Antimicrob Agents 2007;29:715-23.
- Wagenlehner FM, Kees F, Weidner W, Wagenlehner C, Naber KG. Concentrations of moxifloxacin in plasma and urine, and penetration into prostatic fluid and ejaculate, following single oral administration of 400 mg to healthy volunteers. Int J Antimicrob Agents 2008;31:21-6.
- Liu L, Pang X, Zhang D, Xu X, Liu H, Liang Y, et al. Determination of caderofloxacin lactate in rat plasma by high-performance liquid chromatography–mass spectrometry and its application in rat pharmacokinetic studies. J Pharm Biomed Anal 2007;45:799-803.
- Department of Health and Human Services, Food and Drug Administration (US). Guidance for industry: bioanalytical method validation. Beltsville, MD: Department of Health and Human Services, Food and Drug Administration; 2001.
- Chauret N, Gauthier A, Griffith DA. Effect of common organic solvents on in vitro cytochrome P450-mediated metabolic activities in human liver microsomes. Drug Metab Dispos 1998;26:1-4.
- Hickman D, Wang JP, Wang Y, Unadkat JD. Evaluation of the selectivity of in vitro probes and suitability of organic solvents for the measurement of human cytochrome P450 monooxygenase activities. Drug Metab Dispos 1998;26:207-15.
- Busby WF, Ackermann JM, Crespi CL. Effect of methanol, ethanol, dimethyl sulfoxide, and acetonitrile on in vitro activities of cDNA-expressed human cytochromes P-450. Drug Metab Dispo 1999;27:246-9.
- Kim MJ, Kim H, Cha IJ, Park JS, Shon JH, Liu KH, et al. High-throughput screening of inhibitory potential of nine cytochrome p450 enzymes in vitro using liquid chromatography/tandem mass spectrometry. Rapid Commun Mass Spectrum 2005;19:2651-8.
- Hu JH, Xie L, Liu XD. Determination of antofloxacin in rat plasma and bile by HPLC and study of its pharmacokinetics. J China Pharm Univ 2006;37:153-6. (in Chinese).
- Xiao YH, Lu Y, Kang ZS, Zhang M, Liu Y, Zhang M, et al. Pharmacokinetics of antofloxacin hydrochloride, a new fluoroquinolone antibiotic, after single oral dose administration in Chinese healthy male volunteers. Biopharm Drug Dispos 2008;29:167-72.
- White RE. High-throughput screening in drug metabolism and pharmacokinetic support of drug discovery. Annu Rev Pharmacol Toxicol 2000;40:133-57.
- Stass H, Kubitza D. Profile of moxifloxacin drug interactions. Clin Infect Dis 2001;32 Suppl 1:S47-50.
- Niki Y, Hashiguchi K, Miyashita N, Nakajima M, Matsushima T. Influence of gatifloxacin, a new quinolone antibacterial, on pharmacokinetics of theophylline. J Infect Chemother 1999;5:156-62.