
Quantitative determination of acetylshikonin in macaque monkey blood by LC-ESI-MS/MS after precolumn derivatization with 2-mercaptoethanol and its application in pharmacokinetic study1
Introduction
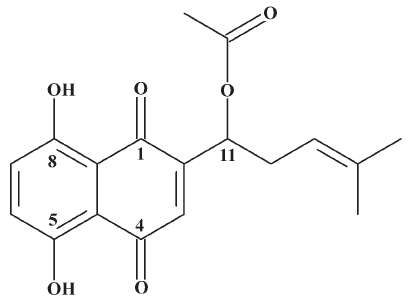
The roots of Arnebia euchrona (Royle) Johnst as a medical herb have been officially documented in Chinese and Japanese pharmacopoeia[1]. The active components are a series of naphthoquinone compounds, of which acetylshikonin (Figure 1) presents multiple activities in vivo and in vitro, such as anti-inflammatory[2,3], antitumoral[4,5] and cytotoxic[2,6], and antimicrobial activities[4,7]. The anti-inflammatory effects were due to acetylshikonin’s inhibition of the transcriptional activation of the tumor necrosis factor-α promoter. The cytotoxicity was evaluated by 3-(4,5-dimethylthiazol-2-yl)-2,5-diphenyltetrazolium bromide (MTT) method in 3 human cancer cell lines: HL-60, A-549, and P-388. The present study indicated that acetylshikonin showed significant cytotoxicity in HL-60 and A-549 cells. Acetylshikonin has been pursued for further investigation as an anti-inflammatory and antitumoral drug candidate.
Acetylshikonin has been studied for many years worldwide, but no specific and accurate method for determination of acetylshikonin in vivo has been reported to date. We tried many methods in our preliminary studies, such as liquid-liquid extraction, solid-phase extraction, deproteinization, and enzymolysis by the Bacillus subtilis enzyme prior to the quantitative determination of acetylshikonin using the liquid chromatography-electrospray ionization tandem mass spectrometry (LC-ESI-MS/MS) method, but none could extract acetylshikonin from the blood samples. In the literature[8–10], β,β-dimethylacrylalkannin has been reported to be able to combine with reducible protein and glutathione in vitro, and the combination reaction between β,β-dimethylacrylalkannin and 2-mercaptoethanol (2-ME) was also studied in vitro. Considering the fact that acetylshikonin and β,β-dimethylacrylalkannin have a similar chemical structure, we assumed that the combination of acetylshikonin, protein, and glutathione could lead to difficulties in the extraction of acetylshikonin from blood samples. Therefore, 2-ME was applied as a derivatization reagent and added to the blood sample to develop a novel derivatization method to determine acetylshikonin.
The purpose of this study was to establish a new LC-ESI-MS/MS method with precolumn derivatization with 2-ME for measuring concentrations of acetylshikonin in macaque monkey blood. In this method, 2-ME was used to react with acetylshikonin to form new derivatives. A major derivative correlated well with acetylshikonin. The structure of this derivative was identified by UV spectra, MS, and the 1H-NMR and 13C-NMR spectra. This derivative was extracted with cyclohexane and measured immediately by LC-ESI-MS/MS. This method was validated and successfully applied to the pharmacokinetic study of acetylshikonin in macaque monkeys.
Materials and methods
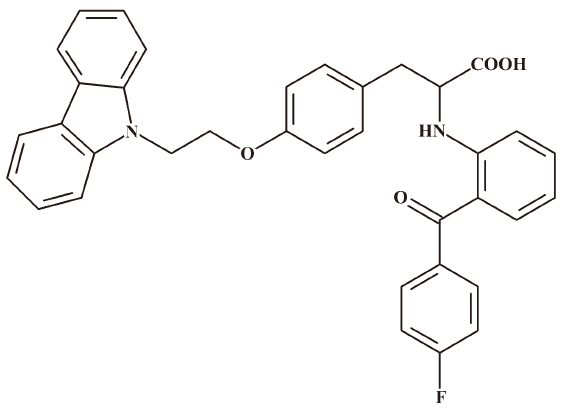
Reagents and materials Acetylshikonin (purity ≥98.2%) was generously provided by Beijing Jin BenCao Chinese Herbal Medicine Technology Development (Beijing, China). Chiglitazar (Figure 2) was used as an internal standard (IS, CS38, purity ≥98.6%) and was obtained from Dong-xiao SUN (Chipscreen Biosciences,Shenzhen, China). 2-ME was purchased from Merck Schuchardt OHG (Hohenbrunn, Germany). Methanol and acetonitrile were purchased from Fisher Scientific (Fair Lawn, NJ, USA). Cyclohexane and potassium phosphate monobasic and dibasic salts (all of chemical grade) were from Beijing Chemical Reagents Company (Beijing, China). Distilled water was purified with a SZ-93A auto-double distillation apparatus (YaRong, Shanghai, China). Argon and liquid nitrogen were purchased from Beijing Capital Oxygen Manufactory (Beijing, China).
Chromatography The LC system consisted of an auto-sampler, MS pump, and a TSQ Quantum Ultra (Thermo Finnigan, San Jose, CA, USA), which was equipped with an electrospray ion source and operated by Xcalibur software version 2.0 (Thermo Electron, Waltham, MA, USA). The separation was achieved on a Capcell Pak MG S-5 column (5 μm, 2 mm×50 mm, Shiseido Corporation, Tokyo, Japan). The mobile phase consisted of solvent A, methanol (1.96% acetic acid), and solvent B, 10% methanol in water (10 mmol/L ammonium acetate and 1.96% acetic acid). A gradient elution was applied by increasing solvent A from 60% to 95% in 1.5 min, maintaining 95% solvent A for additional 3 min, decreasing 95% solvent A to 60% at 4.51 min, and maintaining 60% solvent A for an additional 1.5 min. The overall run time was 7 min. The flow rate was set at 0.2 mL/min. The analysis was carried out at an ambient temperature.
MS detection The settings of the MS detection were as follows: –35 V capillary offset, 3.8 kV spray voltage, 325 °C capillary temperature, and 8 V collision-induced dissociation. The sheath gas and auxiliary gas pressure were 15 psi and 15 arbitrary units, respectively. Argon was used as the collision gas. The SRM m/z transitions monitored for major derivatives, the tube lens offset, and the optimized collision energy for each analyte are shown in Table 1.
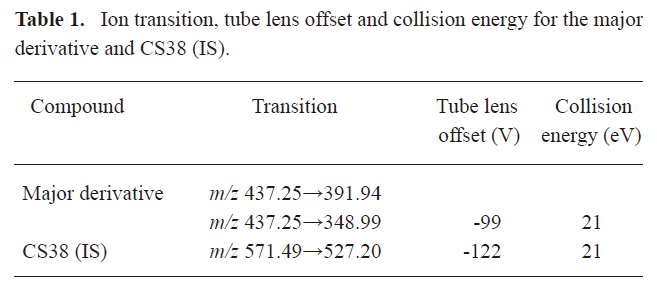
Full table
MS analysis Ion trap-based MS was performed on a Finnigan LCQ Advantage (Thermo Finnigan, USA) equipped with a surveyor photodiode array detector and an electrospray ion source. Settings for the MS analysis of derivative III are as follows: 4.7 kV spray voltage, –16 V capillary voltage, 270 °C ion transfer capillary temperature, 30 psi sheath gas pressure, 5 arbitrary units auxiliary gas pressure, and 0 V tube lens offset, respectively. The mass spectrometer was operated in negative ion mode with a scan range from 100–1000 m/z. Data were collected and analyzed by Navigator software (version 1.2, Thermo Electron, USA).
1H-NMR and 13C-NMR spectra The 1H-NMR and 13C-NMR spectra of the analytes were obtained from Unity-Inova 600 (Varian, Palo Alto, CA, USA) using tetramethylsilane as an internal standard; chemical shifts were recorded in δ ppm values.
Preparation of stock and working solutions Stock solutions containing acetylshikonin (1 mg/mL) and internal standard (IS) (3 mg/mL) were prepared in methanol and methanol/acetonitrile (1:1, v/v), respectively. They were stored at 4 °C away from light. A series of working standard solutions of acetylshikonin were obtained by further dilution of the stock solution with methanol. An internal standard working solution (30 μg/mL) was prepared by diluting the stock solution with methanol/acetonitrile (1:1, v/v).
Sample preparation 2-ME at 2 mol/L (335 μL) and potassium hydrogen phosphate buffer (pH 7.4) at 10 mmol/L (135 μL) were added to each 200 μL blood sample aliquot. The mixture was vortexed for 1 min and immediately incubated in a 37 °C water bath away from light for 1 h. After incubation, 10 μL methanol/acetonitrile (1:1, v/v), containing internal standard CS38 (30 μg/mL), was added to the mixture and vortexed for 1 min. The derivatized samples were extracted twice with 700 μL cyclohexane by vortex mixing for 2 min. After centrifugation at 17 968×g for 8 min, the supernatant was transferred and evaporated under nitrogen stream at room temperature. The residue was dissolved in 100 μL of 95% solvent A and 5% solvent B, vortexed, and centrifuged. An aliquot (10 μL) of each sample was injected into the LC-ESI-MS/MS system for immediate analysis.
Preparation of calibration standards and quality control samples In total, 20 μL working solutions of acetylshikonin with known concentrations were added to 180 μL of blank blood samples and mixed slightly, achieving calibration standards of 5, 10, 20, 50, 100, 200, 500, 1000, and 2000 ng/mL acetylshikonin, in a total volume of 200 μL. Quality control samples at 10 (low), 100 (medium), and 1000 ng/mL (high) were prepared independently of the working solutions used for the calibration curves. Calibration standards and quality control samples were prepared 24 h prior to the assay.
Method validation The method was validated for specificity, precision, accuracy, sensitivity, and stability in macaque monkey blood. The specificity of the method was demonstrated by comparing chromatograms of biological samples from 4 independent sources to ensure no significant endogenous interference was found in the area of interest. Accuracy and precision were assessed by quantitative determination of the quality control samples (10, 100, and 1000 ng/mL) in 3 d validation. The accuracy and precision were expressed as the percentage of the relative error and the percentage of the relative standard deviation, respectively. The results were calculated using one-way ANOVA. Sensitivity was expressed by the lower limit of quantification (LLOQ) with a signal-to-noise (S/N) ratio of 10. The limit of detection (LOD) was computed at a S/N ratio of 3. Stability was evaluated after 3 freeze-thaw cycles (frozen at –70 °C for 24 h and thawed at room temperature) for 3 weeks at –70 °C. The stability of the derivatized samples, which were kept in an auto-sampler for 24 h at room temperature, was also assessed.
Animal handling and blood sample collection Three macaque monkeys (2 male and 1 female, 4–5 kg each) were obtained from the Institute of Jing Feng Medical Animal Center (Beijing, China). The monkeys fasted for 12 h prior to acetylshikonin administration and were allowed access to water throughout the experimental period. The animals were given food 6 h after the oral administration of 0.5% carboxymethyl cellulose suspension containing acetylshikonin by gastric gavage at a dose of 80 mg/kg. Blood samples were collected from a vein in the hind leg at 0 (predose) at 0.08, 0.25, 0.5, 1, 2, 4, 6, 8, 12, 24, 36, 48, 60, 84, and 108 h post-dosing, respectively. All samples were stored at –70 °C and prepared together prior to the analysis.
Pharmacokinetic parameters and statistical analysis Pharmacokinetic parameters were calculated using the non-compartmental method. The blood peak concentration (Cmax) and the time to reach Cmax (tmax) were obtained directly from the concentration-time curve. The elimination rate constant (Ke) was determined by linear regression of the terminal log-linear phase of the concentration versus the time curve. The terminal elimination half-life (t1/2) was calculated by 0.693/Ke. The area under the concentration-time curve to the last measurable concentration (AUC0−t) was calculated by the linear trapezoidal rule. The mean residence time (MRT) was calculated from the ratio of area under the first moment of concentration-time curve to AUC0–t.
Results
Optimization of derivatization reaction The key factors affecting the derivatization reaction were net content of 2-ME in blood samples and incubation time. Therefore, the optimization of the derivatization conditions was carried out in terms of the concentration of 2-ME and the incubation time when the volume ratios of blood, 2-ME, and phosphate buffer were established to be 3:5:2. Four derivative peaks were observed (Figure 3A) with HPLC-UV detection at 520 nm before optimization of derivatization conditions in the blood samples. The production of 4 derivatives was caused by the various reagent concentrations and reaction time.
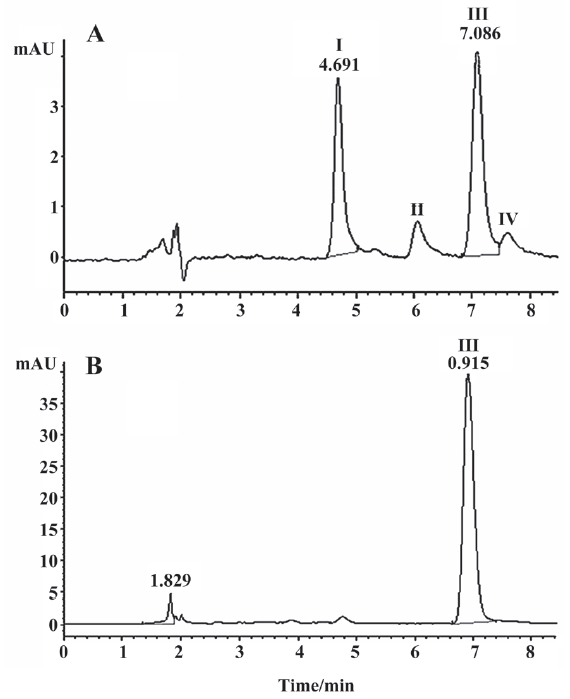
The incubation time was set to 30 min to optimize the reagent concentration. When the reagent concentration of 2-ME reached 1 mol/L, 4 derivative peaks were observed. However, when the reagent concentration was 1.5 mol/L, the peak of derivative III (tR=7.1 min) became predominant and was at its highest at 2 mol/L. Therefore, the optimum concentration of the reagent concentration was established to be 2 mol/L. The results of the optimization of 2-ME concentrations are shown in Figure 4A.
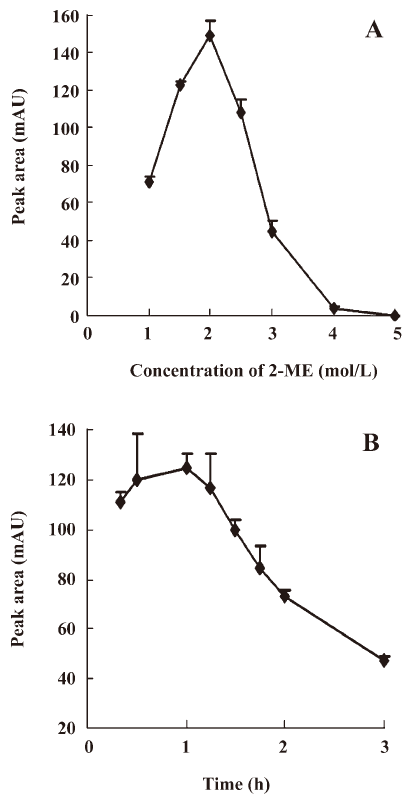
The reaction time was optimized at a 2-ME concentration of 2 mol/L. When the reaction time reached 20 min, 4 derivative peaks were observed. However, when the reaction time was 30 min, 4 derivative peaks transformed into 1 major derivative peak III (tR=7.1 min). The highest value of major peak III was found when the reaction time was 1 h. According to the results, the optimization of the reaction time was established to be 1 h. The results for the optimization of the reaction time are shown in Figure 4B.
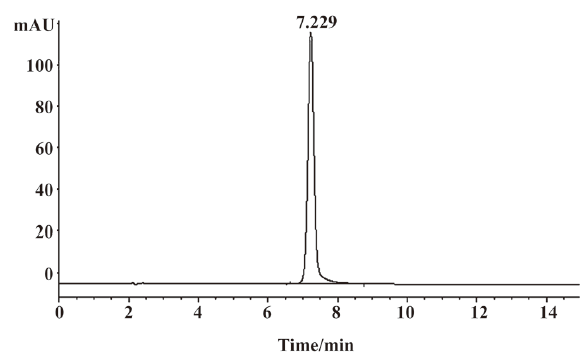
For the final procedure, the optimization was established to be 2 mol/L for the derivatization reagent and 1 h for the reaction time at a ratio of 3:5:2 among the blood sample, 2-ME, and buffer volumes. The final chromatogram is shown in Figure 3B. Major derivative III correlated well with the acetylshikonin concentration. Phosphate buffer plays an important role in diluting blood to improve blood fluidity and keeping a stable environment for the reaction system by maintaining the pH value.
Preparation of major derivative III The process for the preparation of major derivative III was similar to that of the blood sample preparation. The reaction volume was increased by 30 times. In total, 600 µL saturate acetonitrile solution of acetylshikonin was added to a 5.4 mL aliquot of human plasma (provided by N
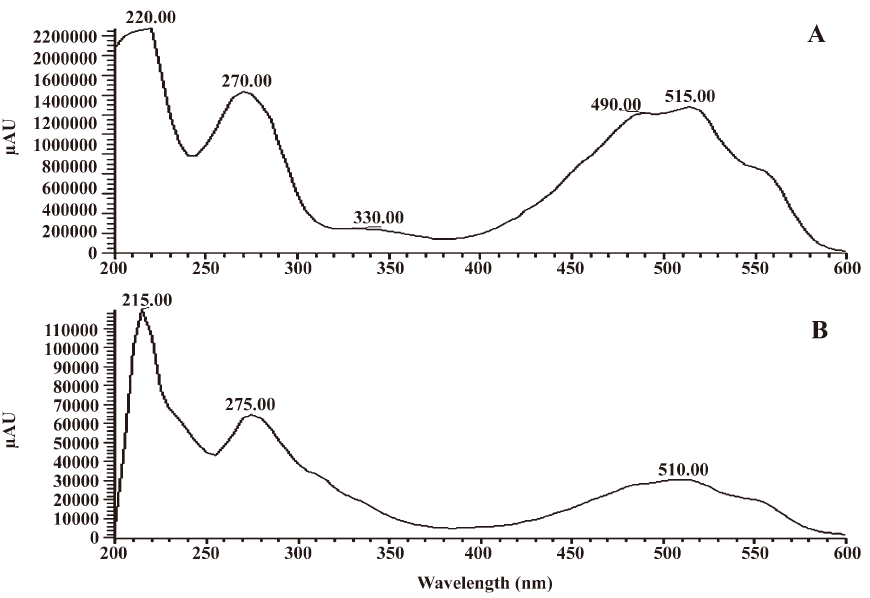
Identification of major derivative III UV spectra, MS, and the 1H-NMR and 13C-NMR spectra were used to identify the structure of major derivative III. UV spectra of major derivative III and acetylshikonin are shown in Figure 6. Comparing the characteristic absorption wavelength of acetylshikonin with that of derivative III, a minor shift of 5 nm in derivative III was observed, which could be due to the structural change of the compound.
The 1H-NMR and 13C-NMR spectra showed the signal that corresponded to a loss of 1 acetyl group on the side chain of acetylshikonin. The signal of C-11 also changed from δH 6.00 (t, 1H) and δC 68.6 to δH 4.39 (t, 1H) and δC 41.5, respectively. It has been proposed that the substitution reaction of -SCH2CH2OH might take place at C-11. This reaction has also been reported in the literature[9]. Compared to the 1H-NMR and 13C-NMR data after 2-ME substitution reported previously, a similar signal change of C-11 on the side chain of acetylshikonin was observed, which confirmed 2-ME substitution at C-11 of acetylshikonin. The 1H-NMR spectra showed that only 1 position had the hydrogen atom signal on the naphthoquinone ring, suggesting that 2 substitution reactions occurred. The 13C-NMR spectra showed that 2 carbon atoms on the naphthoquinone ring shared a similar chemical shift, indicating a similar chemical circumstance of both carbon atoms. Only C-6 and C-7 on the naphthoquinone ring could be suitable to this condition, in which 2 substitution reactions could take place. There were signals for 20 carbon atoms on the 13C-NMR spectra, and 18 of them were observed on the naphthoquinone ring and the side chain. A single peak on the 1H-NMR spectra was shown to contain 4 hydrogen atom signals on the side chain, corresponding to the symmetrical structure of the -CH2CH2- group. In agreement, ESI-MS information showed derivative III to be 437 m/z (M-H)–. In addition to the known hydrogen and carbon atoms, there was an unknown fragment of 64 m/z, which suggested 2 sulfur atoms. Therefore, the structure of major derivative III (Figure 7) was identified as follows:
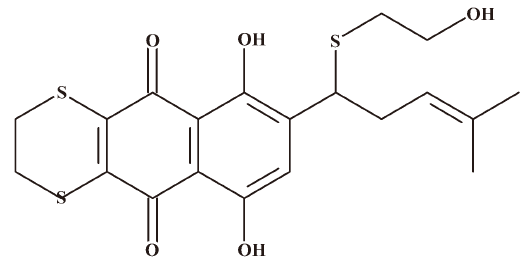
Derivative III: violet red powder after cyclohexane extraction.
ESI-MS: m/z 437 (M-H)–, 409 ([M-H]-CO)–, 392 ([M-H]-CH2CH2OH)–, 364 ([M-H]-CH2CH2OH-CO)–, 359 ([M-H]-HSCH2CH2OH)–, 377, and 349.
1H-NMR (CDCl3) δH 1.59 (s, 3H), 1.66 (s, 3H), 2.59 (t, 2H, J=7.2 Hz), 2.63–2.71 (m, 2H, J=6 Hz), 3.32 (s, 4H), 3.70 (t, 2H, J=6 Hz), 4.39 (t, 1H, J=7.2 Hz), 5.08 (t, 1H, J=7.2 Hz), 7.37 (s, 1H), 12.19 (s, 1H), and 12.87 (s, 1H).
13C-NMR (CDCl3) δC 18.2, 25.9, 27, 27.1, 34, 35.3, 41.5, 60.8, 109.8, 110.5, 120, 127.1, 135.3, 140.9, 141.5, 144.9, 156.4, 158, 181.3, and 182.1.
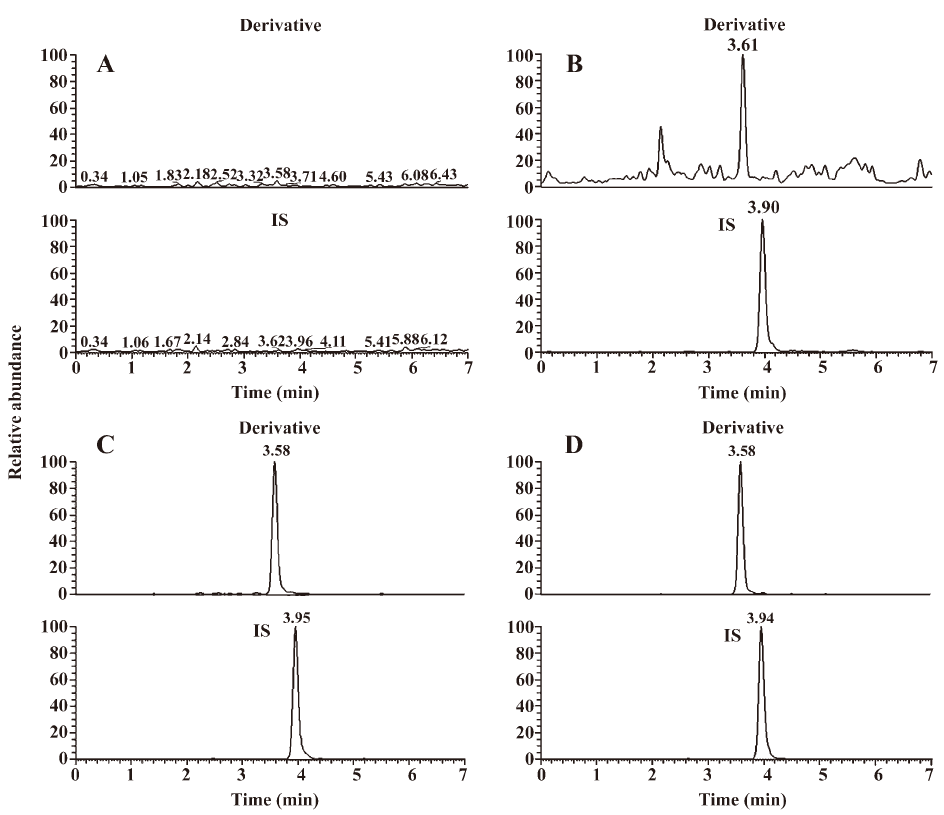
Specificity The specificity of the method was tested by comparing chromatograms of biological samples from 4 independent sources (Figure 8), which indicated that no significant endogenous substances interfered at the retention time of derivative III and IS.
Calibration curve and sensitivity Biological samples were quantified using the ratio of peak area of major derivative III to that of IS. The calibration curve in the monkey blood for acetylshikonin was linear within the concentration range of 5–2000 ng/mL, and the correlation coefficients (r) were greater than 0.99 using a 1/x2 weighted linear regression model. The typical regression equation was y=–3.22×10⁻³+4.93×10⁻³x (r=0.9954). The LLOQ and the LOD of acetylshikonin were determined as 5 and 2.5 ng/mL, respectively. During the routine analysis, each analytical run included a set of calibration samples, quality control samples, and unknown samples. The LLOQ (Figure 8) was determined by analyzing blood samples spiked with known concentrations of analyte that was quantified with acceptable accuracy and precision (±15%).
Accuracy and precision Quality control samples at 3 concentrations (10, 100, and 1000 ng/mL) with 6 replicates per concentration were applied to assess the accuracy and precision. The results showed that the intra- and inter-assay accuracies ranged from –3% to 0.6%, and the intraday and interday precisions were less than 12.3%, with the exception of the lowest concentration, which was less than 17.2%. The accuracy and precision of the LC-MS assay are shown in Table 2.
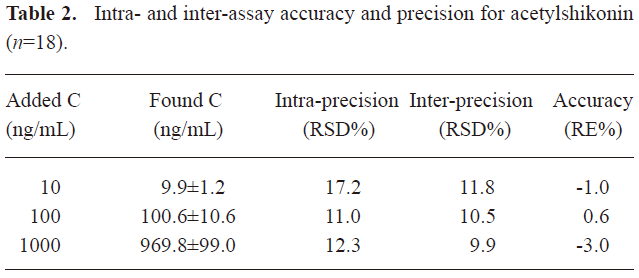
Full table
Stability The stability of acetylshikonin in different conditions was investigated. Quality control samples stored in a freezer at –70 °C remained stable for 3 weeks. The analysis after 3 freeze (–70 °C)-thaw (ambient) cycles showed that acetylshikonin was stable. The derivatized samples kept in auto-sampler vials remained stable at room temperature for 24 h.
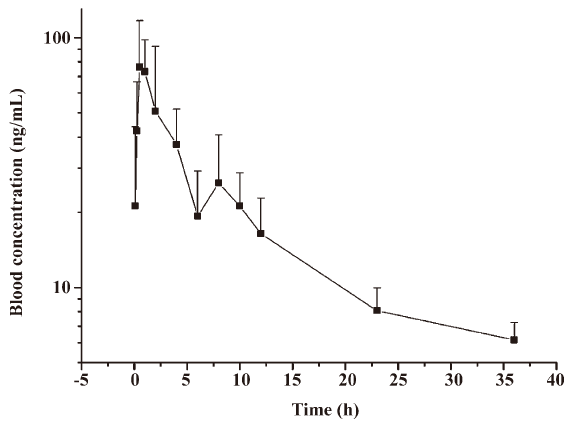
Pharmacokinetic study in macaque monkeys After a single oral administration of acetylshikonin (80 mg/kg) to 3 macaque monkeys, the concentrations of acetylshikonin in the monkey blood were determined by the LC-ESI-MS/MS method described earlier. The mean blood concentration versus time curve after oral administration is shown in Figure 9. The Cmax and tmax of acetylshikonin in the monkeys were 86.7±24.5 ng/mL and 0.7±0.3 h, respectively. The t1/2 and MRT were 12.3±1.6 h and 10.2±0.7 h, respectively. The AUC0−t was 615.4±206.5 ng·h/mL.
Discussion
An indirect method for determining acetylshikonin in vivo, which measures the oxidation of hydroxyl group in β-shikonin by luminol-H2O2-Co2+ chemiluminescent reaction to quantify acetylshikonin has been reported in the literature[11]. However, the specificity of this method was poor and the sensitivity (20 ng/mL LLOQ) was not high enough compared to the method reported here.
The buffer of ammonium acetate played a key role as an ion-pairing reagent in the mobile phase. In the buffer system, the derivative can be separated with excellent resolution and better peak shape. Acetic acid (1.96%) was added in the mobile phase to adjust the pH to approximately 3.5, which maintains the stability of the derivative during the analysis process. The most important advantage of using ammonium acetate was that it promised highly-reproducible results of the determination. Although the acetate pH (pH=3.5) of the buffer inhibited the negative ion detection of LC-ESI-MS/MS, the advantages outweigh the disadvantages. In addition, the application of 5% solvent B in dissolving the residue during the sample preparation is essential. It also greatly contributes to the reproducibility of the LC-ESI-MS/MS method. It should be noted that derivatization reagent 2-ME is unstable at room temperature. Its storage at 4 °C away from light is necessary. During the experiment, 2-ME was prepared when it was used in each analysis run, and was exactly added to all the samples. The reaction time was strictly controlled at 1 h. After 1 h incubation, the extraction agent was immediately added to the samples.
In conclusion, a LC-ESI-MS/MS method was developed and validated for determining acetylshikonin in macaque monkey blood with precolumn derivatization using 2-ME. The structure of major derivative III was identified by UV spectra, MS, and the 1H-NMR, and 13C-NMR spectra. The method was applied to determine the pharmacokinetic profiles of acetylshikonin in macaque monkeys following its oral administration. The significance of this study lies in the innovation of the precolumn derivatization method, and to our knowledge, this is the first time that acetylshikonin determination in vivo has been reported.
Acknowledgements
The authors would like to gratefully acknowledge Mr Xin-yu WANG and Ms Hai-yan ZHOU for the technical support.
References
- Li HY, Luo SR, Zhou TH. Studies on in vitro metabolism of shikonin. Phytother Res 1999;13:236-8.
- Kundakovic T, Fokialakis N, Dobric S, Pratsinis H, Kletsas D, Kovacevic N, et al. Evaluation of the anti-inflammatory and cytotoxic activities of naphthazarine derivatives from Onosma leptantha. Phytomedicine 2006;13:290-4.
- Singh B, Sharma MK, Meghwal PR, Sahu PM, Singh S. Anti-inflammatory activity of shikonin derivatives from Arnebia hispidissima. Phytomedicine 2003;10:375-80.
- Papageorgiou VP, Assimopoulou AN, Couladouros EA, Hepworth D, Nicolaou KC. The chemistry and biology of alkannin, shikonin, and related naphthazarin natural products. Angew Chem Int Ed 1999;38:270-300.
- Huang ZS, Zhang M, Ma L, Gu LQ. A survey of chemical and pharmacologic studies on ZiCao. Nat Prod Res Dev 1999;12:73-82. (in Chinese).
- Lu Q, Liu WJ, Ding J, Cai JC, Duan WH. Shikonin derivatives: synthesis and inhibition of human telomerase. Bioorg Med Chem Lett 2002;12:1375-8.
- Papageorgiou VP, Assimopoulou AN, Samanidou VF, Papadoyannis IN. Recent advances in chemistry, biology and biotechnology of alkannins and shikonins. Curr Organ Chem 2006;10:2123-42.
- Duan ZF, Huang ZS, Bu XZ, Xie WL, Gu LQ. Study on the reaction of natural naphthazarin compounds with thiol nucleophiles. Chin J Organ Chem 2001;21:1112-6. (in Chinese).
- Duan ZF, Huang ZS, Ma L, Che ZT, Gu LQ. Covalent modification of lactate dehydrogenase and alcohol dehydrogenase by alkannin derivatives. Chin J Organ Chem 2001;21:668-71. (in Chinese).
- Huang ZS, Gu LQ, Che ZT, Zhang M, Qiu GQ. The nucleophilic reaction of β-dimethylacrylalkannin with aniline and thiophenol. Acta Chim Sin 2000;58:1043-9. (in Chinese).
- Pang ZG, Wang BQ, Li HF. Study on the compound pharmacokinetics of β-shikonin. J Xi-an Med Univ 2001;22:319-20. (in Chinese).