
Effects of navelbine and docetaxel on gene expression in lung cancer cell strains1
Introduction
Chemotherapy failure in lung cancer is usually caused by multidrug resistance. Discovering ways to overcome resistance to chemotherapeutic drugs is the main problem to be resolved. There are different mechanisms of resistance to different drugs, while various mechanisms can produce resistance to the same drug. Many of these mechanisms, such as drug transition protein (CABC and lung cancer resistant protein), change the molecular target, the state of detoxifying enzymes, the obstruction of apoptosis, the repairing ability of DNA or the activity of oncogenes. Much work has been reported on the function of drug resistant genes in lung cancer using calcium antagonists and the MTT assay, as well as other methods, but there are few reports about the relationship between anticancer drug sensitivity and related genes.
Gene chip technology has provided a powerful tool to study the expression profile of genes and their related genes, providing much better data than the previous gene-monitoring techniques. The cDNA gene chip techniques can be divided into 2 types according to the different density of hybridized genes: (i) macroarrays[1]; and (ii) microarrays[2]. Macroarrays are better than microarrays in that they are economical, have a high level of repeatability and therefore accuracy, and they do not require special instruments. We therefore used macroarrays to measure the gene expression profiles of 10 lung cancer cell strains. We also measured drug sensitivity to navelbine (NVB) and docetaxel (DOC) in 10 lung cancer cell strains using the MTT assay, and analyzed the relationship between them. The precision of our results was then confirmed by reverse transcription olymerase chain reaction (RT-PCR). This outcome has significance for clinical therapy.
Materials and methods
Cell strains There were 11 cell strains used in the experiments, of which 6 were NSCLC strains (LK-2, PC-7, PC-9, PC-14, A549 and Lu65) and 4 were SCLC strains (H69, N231, Lu135 and SBC-3); BET2A was used as a control. All cell strains were cultured in RPMI 1640 supplemented with 5% fetal bovine serum at 37 oC in humidified air containing 5% CO2.
Concentration adjustment of anticancer drugs The concentration of NVB was adjusted to within the range 0.005 µg/ mL–10 µg/mL using RPMI 1640, and DOC was adjusted to within the range 0.005 µg/mL–50 µg/mL using dimethyl-sulphoxide (DMSO).
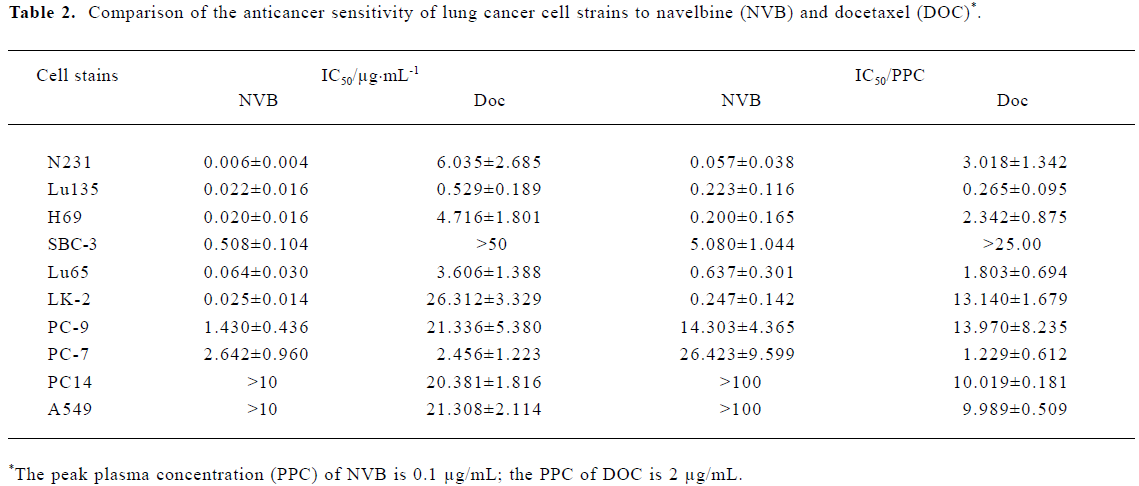
Measurement of cell sensitivity to anticancer drugsSensitivity to the anticancer drugs was assessed using the MTT assay[3]. The IC50 was calculated using the Reed-Muench method[4], while the index of sensitivity was calculated as: IC50/peak plasma concentration (PPC).
Anticancer drug sensitivity-related genes Genes related to anticancer drug sensitivity were assessed using cDNA macroarray.
Isolation of mRNA from total RNA Total RNA was isolated from 1×10⁸ cells, which were grown in suspension, at A260/ A280 ratio∈[1.8, 2.0]. mRNA was isolated by incubation with oligo-dT-magentic beads (Toyobo Co, Osaka, Japan), followed by washing to remove non-specific binding.
Reverse transcription-polymerase chain reaction and labeling of the mRNA polyA+RNA 0.8 µg was picked and RT-PCR was carried out using the RT, Rever TraAce (Toyobo Co, Osaka, Japan). The probes were labeled with biotin by incorporation of biotin-16-dUTP during the synthesis of cDNA.
Making the filters Gene Navigator cDNA Array System-Cancer Selected (Geneticlab, Sapporo Co, Osaka, Japan) was used. Anti-cancer drug-sensitivity genes (1291 species) were spotted onto the filter in duplicate. There were 280 non-mammalian genes and 49 housekeeping genes as negative controls[5]. A list of the set of genes on the filter is shown on the web site (http://www.toyobo.co.jp/seihin/xr/product/genenavi/genenavigator.html).
cDNA array hybridization Filters were preincubated in 30 mL Perfect Hyb (Toyobo Co, Osaka, Japan) at 68 oC for 30 min. Biotin-labeled probes (100 µg) were denatured at 100 oC for 5 min before being added to the prehybridization solution. The filters were incubated in the hybridization mixture at 68 oC for 20 h, then the filters were washed 3 times at 68 oC for 10 min using 30 mL 2×SC/0.1% sodium dodecylsulfate (SDS) and 0.1×SC/0.1% SDS.
Signal measuring After washing the filters, specific signals on the filters were detected using the Imaging High Chemifluorescence Detection Kit (Toyobo Co, Osaka, Japan). Vistra ECF substrate (AttoPhos) (Amersham Pharmacia Biotech, Uppsala, Sweden) was used as the chemifluorescence substrate. Substrate images were acquired by Fluorimager (Amersham Pharmacia Biotech, Uppsala, Sweden).
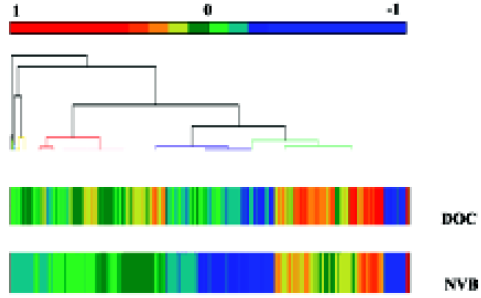
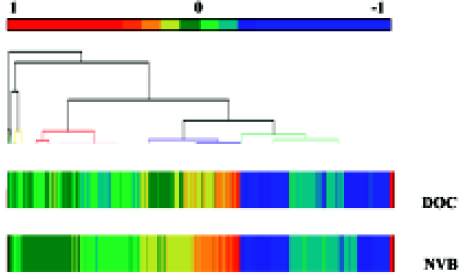
Measuring gene expression The drugs were clustered on the basis of Pearson correlation coefficients relating their patterns across the 10 cell strains to the expression patterns of genes. These correlation coefficients were calculated for each combination of gene and drug by taking the level of expression of the gene in each cell line, enhancing it by the corresponding sensitivity of the cell to the drug, summing the results over all of the cell strains and renormalizing. This produced 1291 correlation coefficients (1 for each gene and target) for each of the 2 drugs. We then clustered the 2 drugs on the basis of these correlation coefficients.
Computer soft analysis “A” was designed as a drug active model (the drug sensitivity of 10 lung cancer cell strains to NVB and DOC-IC50), Tr was the related data model of the level of mRNA expression (the expression of 1291 genes from 10 lung cell strains), and gene expression data included the rate of expression intensity of measuring gene and BET2A cells.
Statistical analysis The AT-clustered image map (CIM; Figure 1 and Figure 2) summarizes the relationship between drug activity and gene expression by means of the clustering method. In this CIM, drugs were together with related genes, and genes were also together with related drugs. Each color reflects the connection of one gene and one drug. For example, a red point (high positive Pearson correlation coefficient) indicates that cell strains with more expressed genes tend to be more sensitive to the agent; a blue point (high negative Pearson correlation coefficient) indicates the opposite; a yellow point and a green point indicate a lower correlation.
Expression of clusterin, galectin-1 mRNA Following RT-PCR, Generunner software was used to design specific primers (Table 1), and the specificity of the primer was proved through the BLAST(Basic Local Alignment Search Tool) internet database. Total RNA was extracted from LK-2 and A549 cell lines according to methods described previously and the first chain was finished through RT-PCR. b-Actin was used as an internal control.
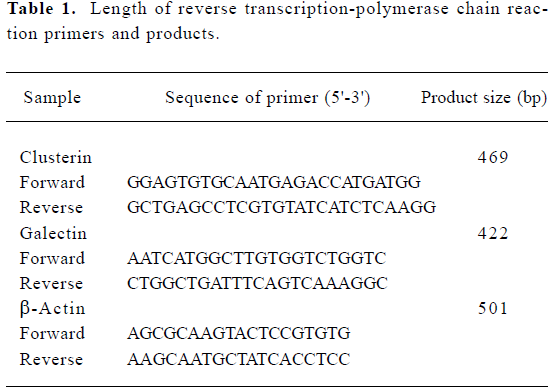
Full table
The PCR amplification products were visualized by bromide-ethyl pastille following sodium dodecyl sulphate-polyacrylamide gel electrophoresis with the DL-2000 molecular weight standard (Generunner).
Results
Comparison of the sensitivity of the lung cancer cell strains to navelbine and docetaxel The anti-cancer drug sensitivity of the lung cancer cell strains to NVB was greater than that to DOC (Table 2).
Full table
Comparing the clustered image map of the drugs with the clustered image map of genes The study related the 1291 gene expression profiles from the CIM of the lung cancer cell strains to NVB and DOC (Figure 1 and Figure 2). In the 10 lung cancer cell strains, there were more genes positively correlated to DOC than to NVB, but there were more genes negatively related to NVB than to DOC. Of the 6 NSCLC cell strains, there were more genes that expressed either positive or negative correlations to DOC than to NVB.
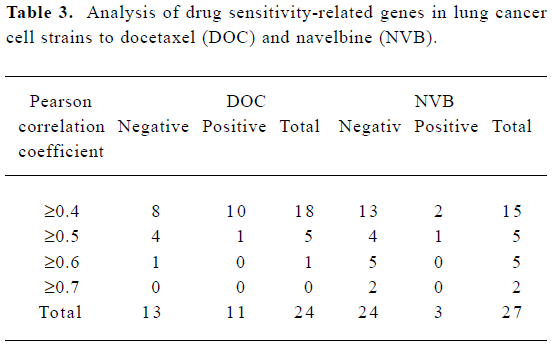
In total, there were 51 genes sensitive to NVB and DOC in the 10 lung cancer cell strains, 3.95% of all the genes in the experiment. There were 24 genes sensitive to DOC (11 positive Pearson correlation coefficients, 13 negative Pearson correlation coefficients), and 27 genes sensitive to NVB (3 positive Pearson correlation coefficients, 24 negative Pearson correlation coefficients, Table 3).
Full table
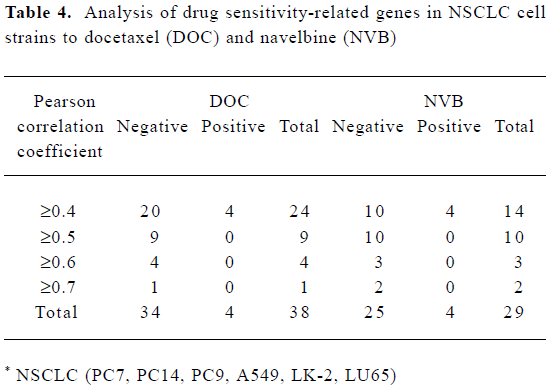
In total, there were 67 genes sensitive to DOC and NVB in 6 NSCLC cell strains. They made up 5.19% of all the experimental genes. Thirty-eight genes were sensitive to DOC and 29 genes were sensitive to NVB. There were more genes negatively related to NVB and DOC than positively related (Table 4).
Full table
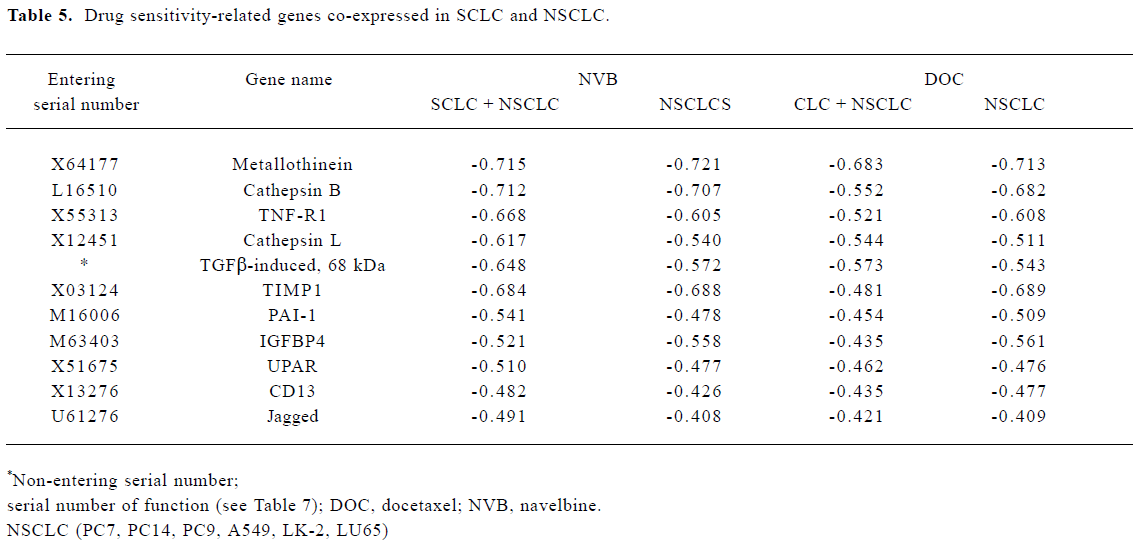
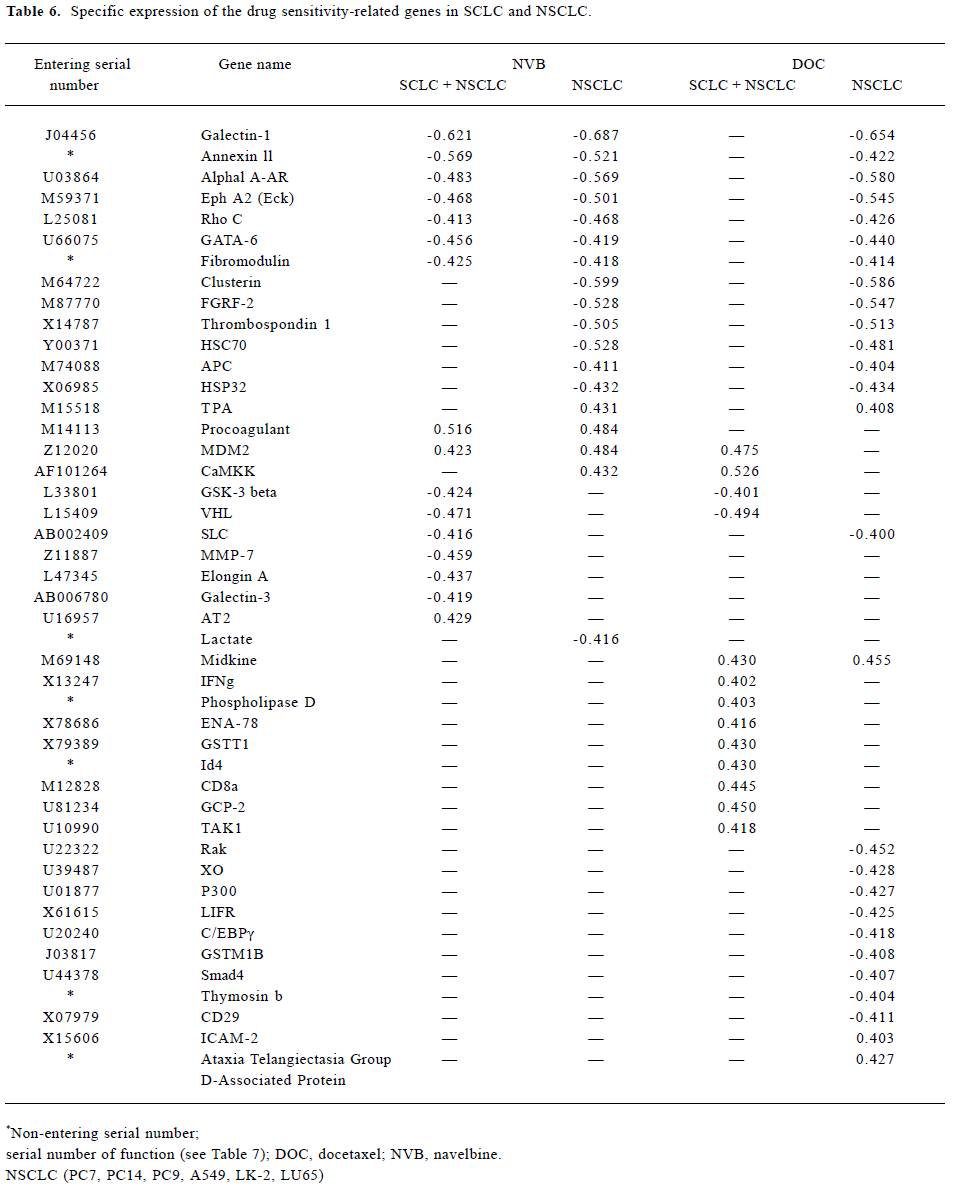
Analysis of gene sensitivity to navelbine and docetaxel In total, there were 56 genes related significantly to NVB and DOC (rr≥±0.4; Table 5 and Table 6). They can be divided into 11 types:
Full table
Full table
- 1 11 genes negatively related to DOC and NVB in the SCLC and NSCLC. They were metallothinein, cathepsin B, TNF-R1, cathepsin L, TGFb-induced 68 kDa, TIMP1, PAI-1, IGFBP4, UPAR, CD13 and Jagged.
- 2 7 genes negatively related to NVB in the SCLC and NSCLC. Genes negatively related to DOC were only in the NSCLC. They were Galectin-1, Annexin 11, aA-AR, EphA2, Rho C, GATA-6 and Fibromodulin.
- 3 6 genes negatively related to DOC and NVB in the NSCLC. They were APC, Clusterin, FGFR-2, thrombospondin 1, HSC70, and HSP32, but the TPA gene was a positively related gene.
- 4 The procoagulant gene was positively related to NVB in the SCLC and NSCLC. The midkine gene was positively related to DOC.
- 5 The MDM2 gene was positively related to NVB in the NSCLC and SCLC. The CaMKK gene was positively related to NVB only in the NSCLC, MDM2 and CaMKK were both positively related to DOC in the SCLC.
- 6 GSK-3β and VHL2 were both negatively related to NVB and DOC in the SCLC.
- 7 Elongin A, MMP-7 and Galectin-3 were negatively related to NVB in the SCLC. Elongin A, MMP-7, Galectin-3 were negatively related to DOC in the NSCLC, but the AT2 gene was positively related to NVB in the SCLC.
- 8 8 genes positively related to DOC in the SCLC. They were TAK1, IFN-γ, Phospholipase D, ENA-78, GSTT1, Id4, CD8α and GCP-2.
- 9 9 genes negatively related to DOC in the NSCLC. They were Rak, XO, P300, LIFR, C/EBPγ, GSTMIB, Smad4, Thymosin b and CD29.
- 10 ICAM-2 and Ataxia Telangiectasia Group D-Associated Protein were positively related to DOC in the NSCLC.
- 11 ICAM-2 and Ataxia Telangiectasia Group D Associated Protein and NSCLC were positively related to DOC.
The classification of gene sensitivity to NVB and DOC in lung cancer cell strains is shown in Table 7. They were divided into 4 types: signal transduction molecules, cell factors, transcription factors, and metabolism-related enzymes and inhibitors.
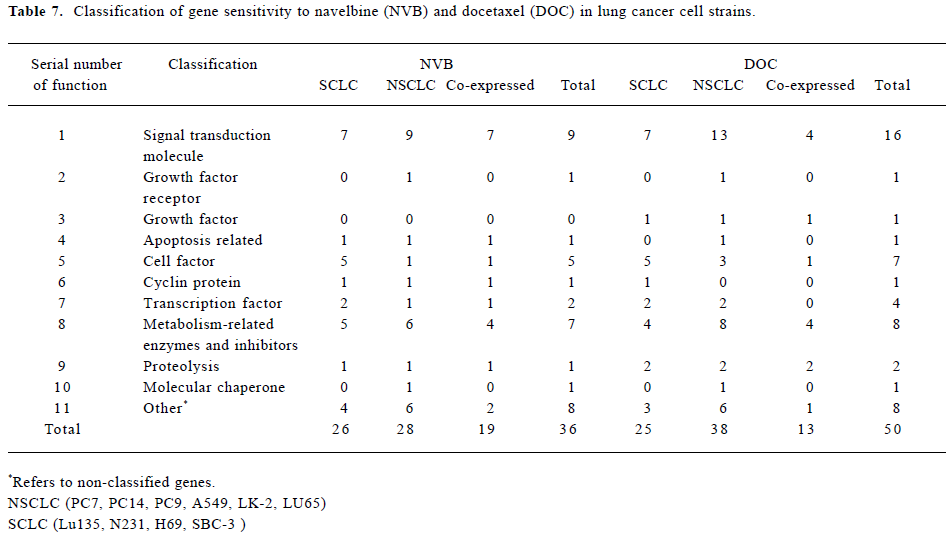
Full table
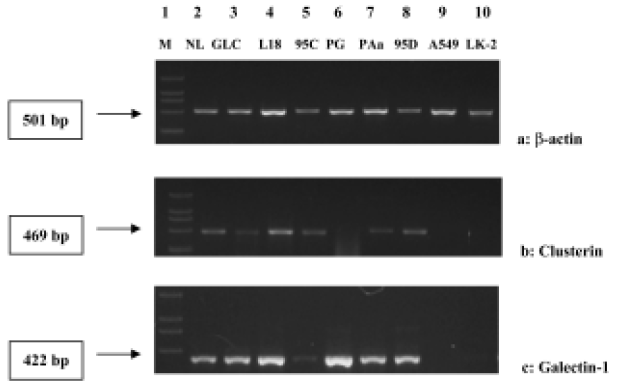
Verification In order to verify the reliability of hybridization, GLC, L18, 95C, PG, PAa, 95D, A549 and LK-2 cell lines were chosen. cDNA of Galectin-1,and Clusterin, which were downregulated in expression and selected with cDNA macroarray, was used in semi-quantitative RT-PCR.The results are shown in Figure 3A-3C.
Discussion
The morbidity of lung cancer is higher now than in the past, and lung cancer therapy is less sensitive to chemotherapy than other kinds of cancer. Because most patients are in the middle or late stages when cancer is found, the rate of surgical success is low. Therefore, chemotherapy is a commonly integrated treatment for lung cancer patients. NVB and Doc are both new anticancer drugs act on microtubules[6-9]. NVB can inhibit the assembly of tubulin and act on the mid-stage of mitosis, leading to stasis of cancer cell growth. Because of its special anticancer function, in December 1994 the FDA (Food and Drug Administration) approved NVB in combination with CDDP for use as a first-line therapy for advanced NSCLC patients[10]. As for DOC, its mechanism is to promote the aggregation of tubulin and to inhibit its disassembly, preventing cells from entering into the growth phase. It is widely used in cancer treatments, mainly for lung cancer and breast cancer in advanced stages[11].
In clinical cases there are usually different sensitivities to anticancer drugs. The same chemotherapeutic medicine is often used for patients with different types of cancer cells, even for different individuals with the same type of cancer cells. This is due to such factors as the different biological characters of tumors, different patients and different drug responses.
There are many methods to determine sensitivity to anticancer drugs by analyzing gene expression. Only 1 gene at a time can be tested through northern blotting, which has an obvious disadvantage in automation. Other methods include differential display, cDNA sequence analysis and SAGE, but they also have many disadvantages. For any organism, we can analyze many different drug responses by means of DNA gene chip technology, and obtain more reliable results than with other methods. We conclude that other single element methods are less advantageous than the DNA gene chip technique[12-15].
A recent study showed that drug sensitivity to DOC is concerned with P-GP(P Glucose protein), and changes in target molecules, changes in signal transduction system, cell-control factors and apoptosis-related factors. In addition, the metabolism of DOC in the body is primarily through the sub-family of CYP3A proteins. The activity of enzyme in this family varies greatly among individuals, and the factors sensitive to NVB have not yet been reported.
We have examined the genes sensitive to DOC and NVB in 10 lung cancer cell strains using cDNA macroarrays. The results showed that there were 56 genes significantly related to NVB and DOC (r≥±0.4). Among them, 36 were related to NVB, 20 were co-expressed in the NSCLC set and the NSCLC+SCLC set; 27 were related in the NSCLC+SCLC set and 7 were specifically related genes; 29 were related genes in the NSCLC set, and 9 were specifically related genes. There was a total of 50 genes related to DOC and 12 co-expressed genes related in the NSCLC and NSCLC+SCLC sets; 24 related genes in the NSCLC+SCLC set and 12 specifically related genes. In the NSCLC set there were 38 related genes and 26 specifically related genes.
The genes described above are mainly signal transduction molecules, metabolism-related enzymes and inhibitors, cell factors and transcription factors. At the same time, Clusterin and Galectin-1 genes, which were downregulated in expression in LK-2, were tested using RT-PCR. The results were in agreement with those obtained through cDNA macroarray. However, with the A549 cell line, the cDNA macroarray did not show the same downregulated expression as with RT-PCR. Genes screened by cDNA macroarray therefore need to be further tested using other methods.
In this study, we identified the relationship among the gene expression profiles of 10 lung cancer cell strains, which focused on 1291 genes and drug sensitivity to DOC and NVB. This study may help to explain the mechanisms of action of NVB and DOC, provide theoretical evidence in the search for new ways to overcome drug resistance, discover new anticancer drugs by providing new targets, and facilitate individualized therapy regimens and increased response rates. The aim of our future work is to identify and analyze these new genes screened for drug sensitivity, especially those not known to us previously.
References
- Ohira T, Akutagawa S, Usuda J, Nakamura T, Hirano T, Tsuboi M. Up-regulated gene expression of angiogenesis factors in post-chemotherapeutic lung cancer tissues determined by cDNA macroarray. Oncol Rep 2002;9:723-8.
- Califano A, Stolovitzky G, Tu Y. Analysis of gene expression microarrays for phenotype classification. Proc Int Conf Intell Syst Mol Biol 2000;8:75-85.
- Shimoyama Y, Kubota T, Watanabe M, Ishibiki K, Abe O. Predictability of in vivo chemosensitivity by in vitro MTT assay with reference to the clonogenicassay. J Surg Oncol 1989;41:12-8.
- Reed LJ, Muench HA. Simple method of estimating fifty percent end points. Am J Hyg 1938;27:493.
- A.Gemma K, Takenaka Y, Hosoya K, Matuda M, Seike F, Kurimoto Y. Altered expression of several genes in highly metastatic subpopulations of a human pulmonary adenocarcinoma cell line. Eur J Cancer 2001; 37: 1554?61.
- Le Chevalier T, Brisgand D, Douillard JY, Pujol JL, Alberola V, Monnier A, et al. Randomized study of vinorelbine and cisplatin versus vindesine and cisplatin versus vinorelbine alone in advanced non-small-cell lung cancer: results of a European multicenter trial including 612 patients. J Clin Oncol 1994;12:360-7.
- Wozniak AJ, Crowley JJ, Balcerzak SP, Weiss GR, Spiridonidis CH, Baker LH, et al. Randomized trial comparing cisplatin with cisplatin plus vinorelbine in the treatment of advanced non-small-cell lung cancer: a Southwest Oncology Group study. J Clin Oncol 1998;16:2459-65.
- Adjei AA, Argiris A., Murren JR. Docetaxel and irinotecan, alone and in combination, in the treatment of non-small cell lung cancer. Semin Oncol 1999;26:s32-40.
- Robinet G, Thomas P, Perol M, Vergnenegre A, Lena H, Taytard A, et al. PhaseIIstudy of docetaxel in inoperable advanced non small cell lung cancer. Bull Cancer 2000;87:253-8.
- Dong M, Feng FY, Shi YK. Studying progress about the anticancer drug Vinorelbine. Foreign Med Sci Cancer Sec 1998;25:145.
- Sun Y, Li WL, Guan ZH, Li LQ, Zhang XR, Wu HY, et al. Clinical Validation of Doc- etaxel in treatment of advanced breast cancer and NSCLC. J Chin New Med 1998;7:165-7.
- Khan J, Bittner ML, Chen Y, Meltzer PS, Trent JM. DNA microarray technology: the anticipated impact on the study of human disease. Biochim Biophys Acta 1999;1423:M17-28.
- Wildsmith SE, Elcock FJ. Microarrays under the microscope. Mol Pathol 2001;54:8-16.
- Scherf U, Ross DT, Waltham M, Smith LH, Lee JK, Tanabe L, et al. A gene expression database for the molecular pharmacology of cancer. Nat Genet 2000;24:236-44.
- Dan S, Tsunoda T, Kitahara O, Yanagawa R, Zembutsu H, Katagiri T, et al. An integrated database of chemosensitivity to 55 anticancer drugs and gene expression profiles of 39 human cancer cell lines. Cancer Res 2002;62:1139-47.