
Altered expression of cytochrome P450 and possible correlation with preneoplastic changes in early stage of rat hepatocarcinogenesis1
Introduction
Cytochrome P450 (CYP) plays a pivotal role in oxidative metabolism of lipophilic drugs and xenobiotics (some of them are carcinogens), which will then be transformed into more polar water soluble molecule[1]. During these processes, activation or detoxicitation takes place. A prominent phenomenon during hepatocarcinogenesis is an alternation of the expression of drug metabolism enzymes[2]. CYP can be influenced by a number of exogenous and endogenous factors and its induction is of the utmost interest in carcinogenesis[3,4].
The underlying mechanisms by which CYP enzymes involved in the process of hepatocarcinogenesis have not been elucidated clearly or in detail. Some probable mechanisms have been suggested including the metabolism of exogenous chemicals involved in the generation of reactive oxygen species and oxidative DNA damage, which are associated with apoptosis and cell cycle arrest[5]. Moreover, alteration of the activities of CYP in rats could be an important factor in determining resistance or susceptibility to xenobiotics in the early stage of hepatocarcinogenesis[6].
Preneoplastic and neoplastic lesions induced by various different treatment regimens have a decrease in expression of phase I enzymes and an increase in expression of phase II enzymes in common[7]. The decrease in expression of CYP in preneoplastic lesions could alter the synthesis and/or inactivate endogenous and/or exogenous substance, which act as tumor promoters or comitogens, thus resulting in the selective growth of a subset of hepatic hyperplastic lesions [7,8]. CYP1A family might be marker enzymes that indicat the carcinogenic potential of xenobiotics. Most polyhalogenated aromatic hydrocarbons that have proven to be carcinogen have a common induction of CYP1A1. A previously published study demonstrated that the level of N-nitrosodimethylamine demethylase activities (mainly catalysed by CYP2E1) and CYP2E1 protein content were lower in hepatomas than in the corresponding host liver[9]. However, the change of CYP2E1 expression in the early stage of hepatocarcinogenesis and the probable role in the process of hepatocarcinogenesis was unclear.
Oxidative stress interacts with all 3 stages of the cancer process. Higher levels of reactive oxygen species (ROS) have been found in neoplastic nodules of rat liver than in the surrounding normal tissue. ROS can be generated from several intracellular locations including microsomal pathway and the mitochondrial electron transport chain. Microsomal generated ROS is one of the most significant causes of liver injury[10]. The existence of NADPH-dependent production of ROS by animal liver microsomes has been linked to CYP. The uncoupling of electron transfer and oxygen reduction from monooxygenation by CYP2B1 and CYP2E1 could result in the release of O2− and H2O2. A recent study has demonstrated that this step is also involved in CYP1A1, CYP3A, and CYP4A isoforms[11]. Within these isozymes, CYP2E1 is a major inducible hepatic microsomal CYP involved in the hydroxylation of fatty acids, and can initiate the autopropagative process of lipid peroxidantion if they are not countered efficiently by antioxidants. In the present paper, a reconstituted mircrosomal lipid peroxidation system consisting of rat liver microsomal NADPH-cytochrome P450 reductase and cytochrome P450 incorporated into phospholipids vesicles was developed to investigate the possible role of the specific CYP to generate microsomal lipid peroxidation that resulted in the different cell redox status among the 4 groups.
The medium-term bioassay, which was developed by Ito et al in 1989 to detect the carcinogenic potential and their postinitiation modifying effects[12], is of relatively short duration, but results in sufficient lesions to allow statistical comparisons[13]. To investigate the induction and inhibiton of CYP in the early stage of hepatocarcinogenesis induced by DEN and 2-AAF, we performed the medium-term bioassay. In the present study, we investigated the major carcinogenesis related to CYP isozymes, namely CYP1A1, CYP1A2, CYP2B1/2, CYP3A, CYP2E1, and indicated their respective role in the formation of hyperplastic foci.
Materials and methods
Chemicals Diethylnitrosamine (DEN), 2-acetylaminofluo-rene (2-AAF), α-naphthoflavone, 8-methoxypsoralen were purchased from Sigma Chemical Co. Ethoxyresorufin and resorufin were obtained from Molecular Probes. Erythromycin was purchased from Shanghai Sangon Co Ltd. All the antibodies, except those mentioned (later), were purchased from Chemicon International Institute. Enhancing chemiluminescence (ECL) was obtained form Amersham Life Sciences (Amersham, United Kingdom).
Animal experiment Sixty male pathogen-free Sprague–Dawley rats (70–80 g) were obtained at 6 weeks of age from the Shanghai Laboratory Animal Center, Chinese Academy of Sciences (Shanghai, China), and housed in plastic cages with wood chips for bedding in a temperature and humidity-controlled animal facility center with a daily photoperiod of 12 h of light and 12 h of darkness. Forty rats which had no abnormal findings after a 1-week acclimatization period, were randomly divided into 4 groups referred to as group A, B, C, and D, each consisting of 10 animals. Group D (control) was maintained on a basal diet without carcinogen treatment; group A received a single ip injection of DEN (200 mg/kg) in 0.9% NaCl, and 2 weeks later were placed on a diet containing 2-AAF (100 ppm) for 6 weeks. Group B received a single ip injection of DEN (200 mg/kg) dissolved in 0.9% NaCl and was then maintained on the basal diet for 8 weeks; group C were placed on a diet containing 2-AAF (100 ppm) from week 2 to week 8 without DEN initiation. All groups received partial hepatectomy (two-thirds of the total liver) in the third week. At week 8 all the rats were anesthetized with diethyl ether; liver perfusion was performed with ice-cold perfusion buffer [1.15% KCl, 1 mmol/L-1 EDTA, 0.25 mmol/L phenylmethylsulfonyl fluoride (PMSF)] at room temperature. Separate portions were fixed in 10% phosphate-buffered formalin, partially frozen in liquid nitrogen and stored at liquid nitrogen for molecular assessment. Microsomes were prepared by differential centrifugations as described previously and stored at -80 °C until use.
Biochemical assay
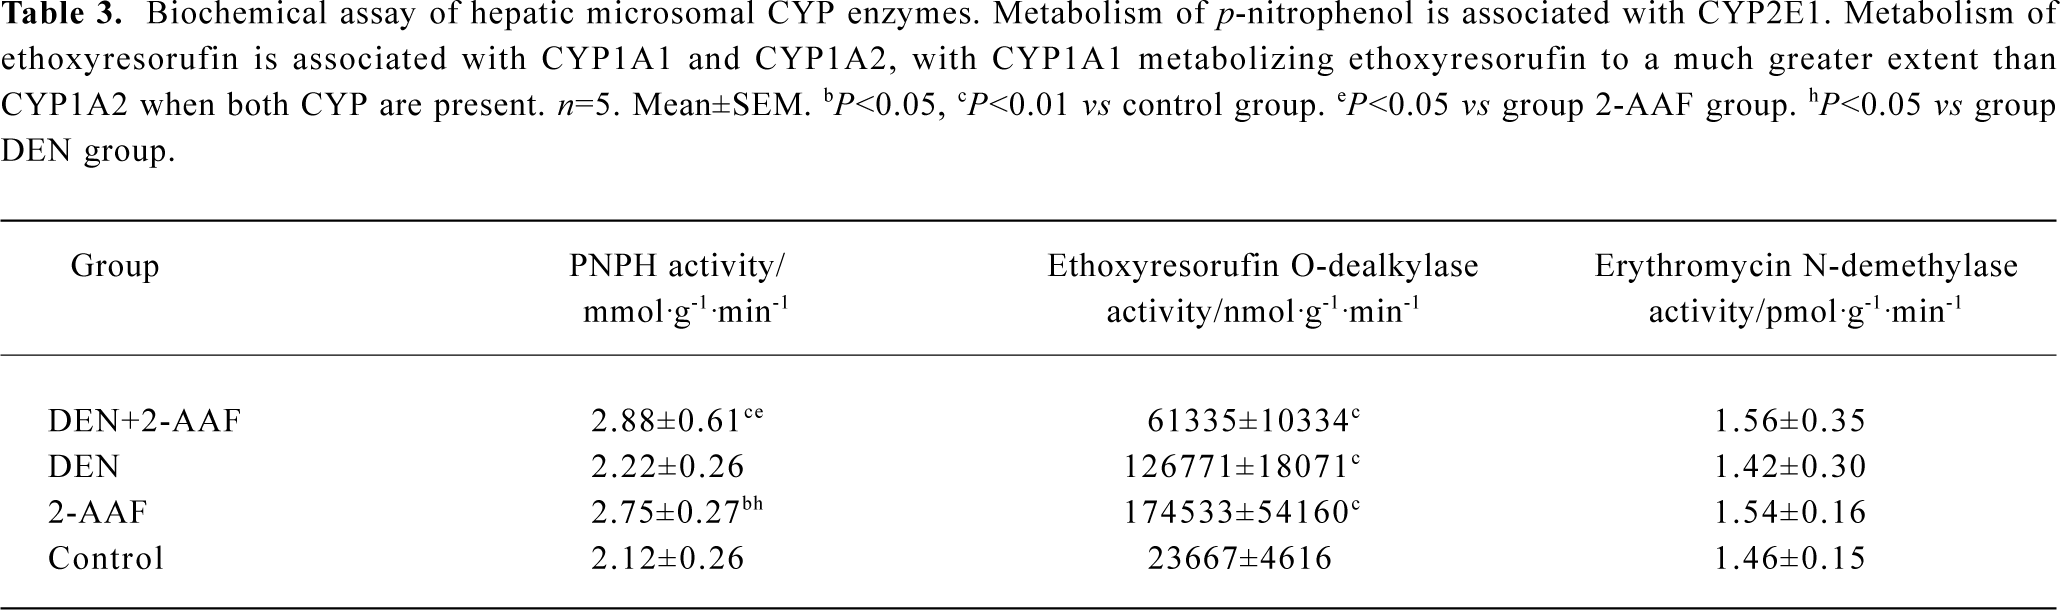
Ethoxy O-dealkylase activity assay The metabolism of ethoxyresorufin is associated with CYP1A1 and CYP1A2, with CYP1A1 metabolizing ethoxyresorufin to a much greater extent than CYP1A2 when both CYP are present. The dealkylation of ethoxyresorufin by microsomes was quantified by measurements of increased resorufin fluorescence over time using a Polar star* fluorescence microplate reader (BMG labtechnologies Pty Ltd, Melbourne, Australia). Microsome protein (50–150 µg) was added to 0.1 mol/L potassium phosphate buffer pH 7.6, along with 2 µmol/L ethoxyresorufin in the total reaction volume of 2.0 mL. This microsome substrate solution was incubated at 37 oC for 3 min prior to initiation of the reaction with 0.5 mmol/L NADPH. The reaction continued for the next 5 min, the formation of resorufin was measured at the excitation wavelength of 535 nm and emission wavelength of 590 nm. The standard curve was performed with the known amounts of resorufin.
p-Nitrophenol hydroxylase (PNPH) assay PNPH was assayed as described previously. The reaction mixtures contained a 0.1 mol/L potassium phosphate buffer, pH 6.8, 1.0 mmol/L ascorbic adid, 0.1 mmol/L p-nitrophenol, 100 µL 25% microsome protein and 1mmol/L NADPH in a total volume of 1.0 mL. The reaction was initiated by adding NADPH after incubation at 37 oC for 3 min. After a 10-min incubation at 37 oC, the reaction was stopped by adding 0.5 mL 0.6 mol/L HClO4. The 4-nitrocatechol formed was determined spectrally at 510 nm in 1.0 mL of the supernatant at 546 nm after the addition of 0.1 mL 10 mol/L NaOH.
Erythromycin N-demethylase activity assay The microsomal erythromycin N-demethylase activity was performed as previouly described. The reaction mixture included 0.6 mL 50 mmol/L potassium phosphate buffer (pH 7.25), 0.1 mL 150 mmol/L magnesium chloride, 0.1 mL 10 mmol/L erythromycin and 0.1mL microsomal suspension. After adding NADPH to initiate the reaction, the reaction mixture was incubated at 37 oC for 10 min. The reaction was then terminated by 0.5 mL ice-cold 12.5% (w/v) trichloroacetic acid. After centrifuge, the same volume of NASH reagent (NASH reagent containing 150 g ammonium acetate, 3.0 mL glacial acetic acid and 2.0 mL acetylacetone per liter of aqueous solution)was added to supernatant. The formaldehyde formed was determined spectrally at 412 nm after heating at 50 oC for 30 min.
Western Blot Microsomal fractions of the liver samples were separated by SDS-PAGE and electrophoretically transferred to polyvinylidene fluoride (PVDF) membranes, incubation with rabbit anti-rat CYP1A1, CYP1A2, CYP2B1/2, CYP2E1 (1:1000) at 4 oC overnight, followed by peroxidase-conjugated goat anti-rabbit IgG (1:4000) at room temperature for 1 h. Binding was visualized with an enchanced chemiluminescence.
Immunohistochemistry
glutathione S-transferase placental (GST-P) immunohistochemistry Immunhistochemical staining using rabbit anti-GST-P IgG (ready to use; Medical Biological Laboratories Co, Nagoya, Japan), was performed by avidin-biotin complex method. Quantitation of GST-P-positive foci was performed using 2-dimension evaluation only. The areas of GST-P-positive foci greater than 0.2 mm in diameter and the total areas of the liver sections were measured using Leica QFAB Image Processing (Leica Imaging Systems Ltd,Cambridge, England) and analysis system to give values per cm2 of liver section.
Immunohistochemistry of proliferating cell nuclear antigen (PCNA) PCNA was detected from formalin-fixed paraffin-embedded tissue sections. Immunohistochemical staining using monoclonal mouse anti-PCNA IgG (1:100 diluted in 0.01 mmol/L PBS, pH 7.2) and biotinylated rabbit anti-mouse immunoglobulins (1:300 diluted in 0.01mmol/L PBS, pH 7.2) was performed by avidin-biotin complex method. Antigen retrieval was performed by boiling for 10 min in a microwave oven (600W). The number of nuclei and PCNA-positive nuclei were counted under a light microscope. Ten random fields (approximately 2000 nuclei) per section were assessed under 40×objective lens.
Liver microsomal NADPH-dependent lipid oxidation: thiobarbitric acid reactive substances (TBARS) assay Fe3+/ADP-induced: liver microsomes (300 µg of protein per mL) were preincubated in 150 mmol/L Tris/HCl buffer, pH 7.4. After 10 min incubation at 37 oC, lipid peroxidation was initiated by the addition of 2 µmol/L FeCl3/200 µmol/L ADP (previously complexed), and 200 µmol/L NADPH. The total volume was 0.5 mL, and all additions expressed earlier were final concentration in the incubation system. Incubations were carried out at 37 oC. Lipid peroxidation was monitored by the formation of TBARS reactions.
Not Fe3+/ADP-induced: the microsomal protein (200 µg in 50 mmol/L phosphate buffer saline, pH 7.4) was incubated in the presence of 0.23 mmol/L NADPH at 37 oC for 10 min before analysis of thiobarbitric acid (TBA) reactive substances. For pharmacological inhibition studies, microsomal protein was pre-incubated for 10–30 min at room temperature in the presence of either diethyldithiocarbamate (CYP2E1 inhibitor, 50 µmol/L) or α-naphthoflavone (CYP1A inhibitor, 10 µmol/L), 8-methoxypsoralen (CYP1A and CYP2A6 inhibitor, 1 µmol/L). α-Naphthoflavone is 10 times more potent as an inhibitor of CYP1A2 than CYP1A1. 8-Methoxypsoralen has a similar inhibition of CYP1A1 and CYP1A2. The microsomal NADPH-dependent lipid peroxida-tion was performed as described earlier.
Glutathione assay Glutathione level in the homogenates was assayed with a microplate reader using the GSH test kit. The GSH test kit was obtained from the Nanjing Jiancheng Bioengineering Institute (Nanjing, China).
Statistical methods Data were expressed as mean±SEM. After homogenetic analysis, homogeneous data were analyzed with one-way analysis of variance and a post hoc test of least significant difference. Heterogeneous data were analyzed using the t-test. P<0.05 was considered significant.
Results
Body and liver weights The toxicity and abnormal proliferation induced by DEN and 2-AAF was evident in data for body or relative liver weights. The body weights of both groups A and B decreased significantly compared with that of group D. There were no significant alteration in absolute liver weight in all 4 groups. But the relative liver weights (relative to body weights) significantly (P<0.05, n=5) increased in DEN+2-AAF, DEN, and 2-AAF group (Table 1).
Full table
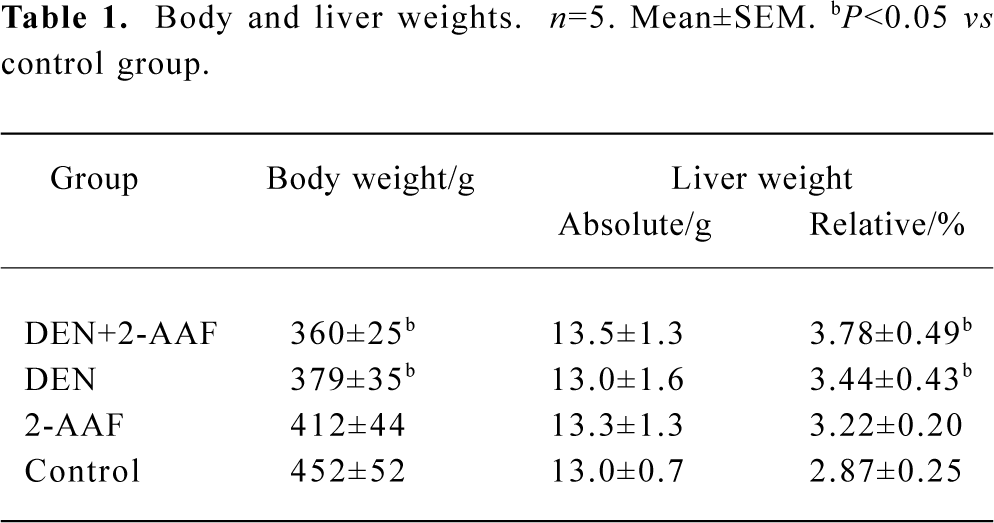
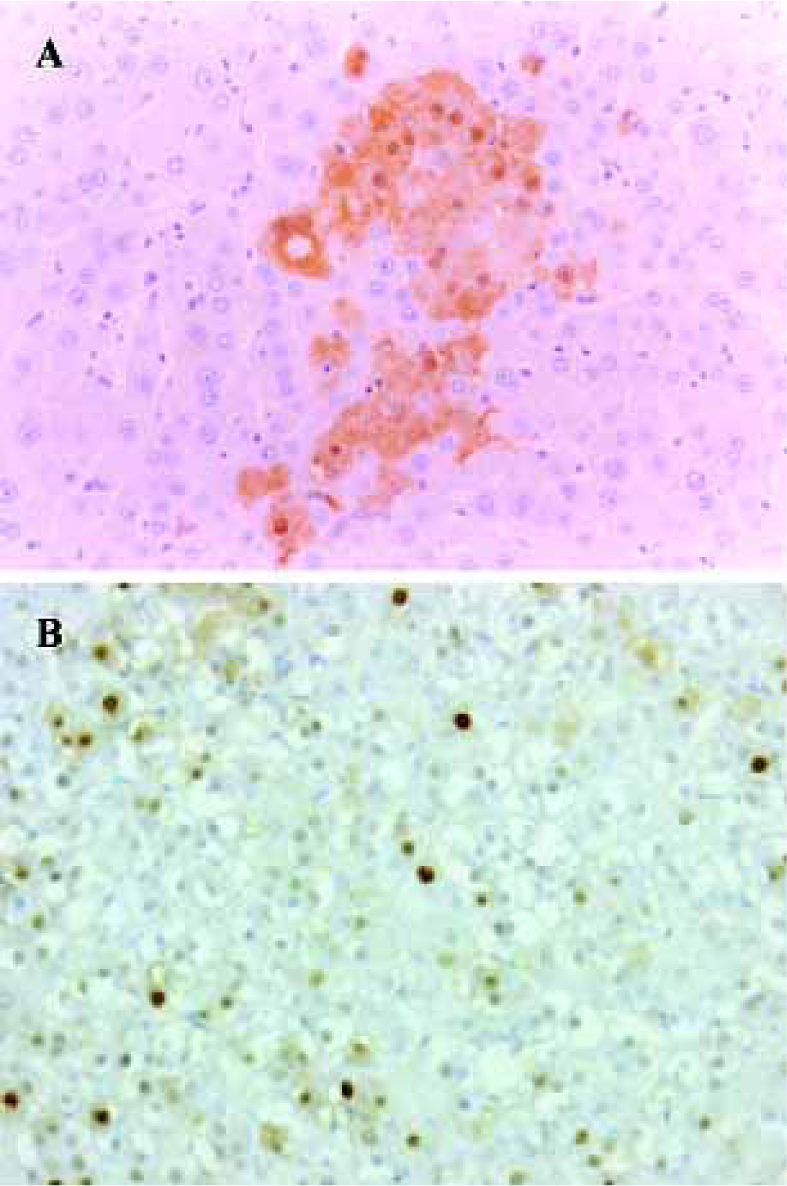
Carcinogenic potential assay: GST-P and PCNA immunohistochemistry Carcinogenic potential assay was performed by comparing the numbers and areas of GST-P-positive foci. The numbers and areas of GST-P-positive foci significantly increased in group A as compared with that of groups B and D (Figure 1A, Table 2). With the present carcinogenic protocol, treatment of rats with single injection of DEN alone did not induce altered hepatic foci but treatment with DEN plus 2-AAF induced many altered hepatic foci in the liver.
Full table
PCNA was used as an indicator of cell proliferation. Immunohistochemistry detection of PCNA is a common method used to grade proliferative activity in a given tissue. The number of PCNA-positive cells in groups A and C were remarkably (P<0.05, n=5) more than that of control group (Table 2, Figure 1B).
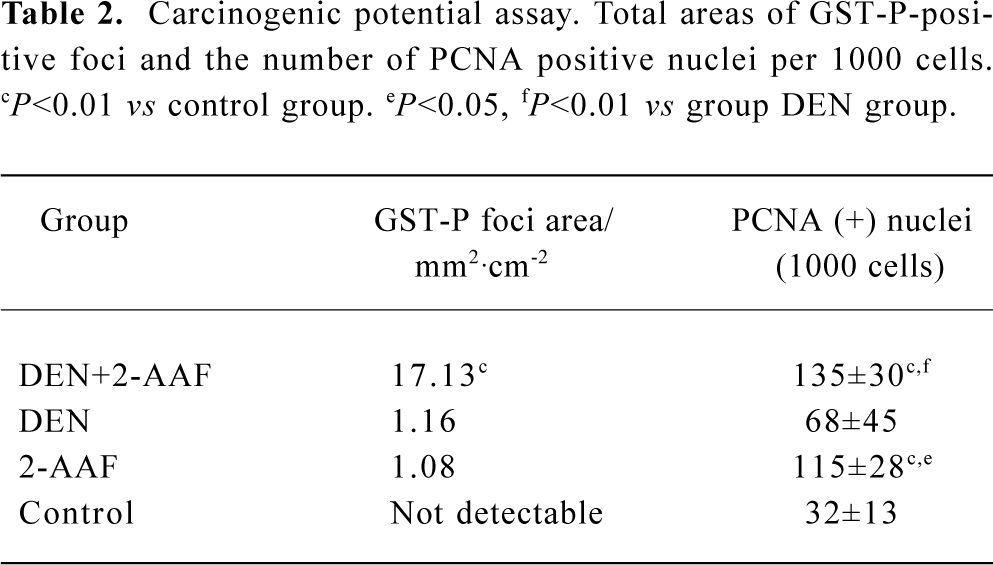
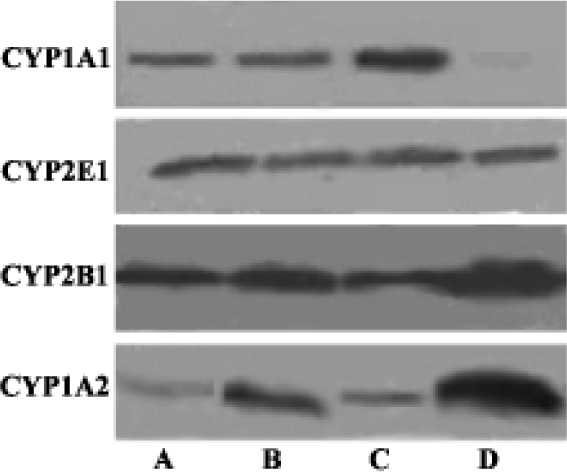
Western blot analysis of Cytochrome P450 isozymes In the present experiments, we used liver samples without isolation of hyperplastic nodules for the analyses of CYP enzymes, because each hyperplastic nodule was too small to isolate. Western blot analysis revealed a slight increase of CYP2E1, significant decrease of CYP1A2 and CYP2B1/2 in both groups A and C. There was no detectable difference of CYP2E1, CYP1A2, and CYP2B1/2 between the DEN-PH group and the control group. CYP1A1 was almost undetectable in the control group, but the induction of CYP1A1 in group C was greater than DEN+2-AAF group and DEN group (Figure 2).
Measurement of ethoxy-O-dealkylase activity, p-nitrophenol hydroxylase (PNPH) activity, and erythromycin N-demethylase activity assay The results of these experiments showed that treatment of DEN-PH-2-AAF statistically (P<0.01, n=5) increased the liver microsomal PNPH activity approximately 40% more than that of control group; treatment of 2-AAF-PH-2-AAF increased PNPH activity by approximately 30%, but the treatment of a single injection of DEN had no influence on the PNPH activity. These results were in accordance with our Western blot analysis and immunohistochemisty results (Table 3).
Full table
Treatment with 2-AAF dramatically increased the ethoxy-O-dealkylase activity approximatley 7 times than that of control group. However, treatment with DEN-PH-2-AAF only increased the ethoxy-O-dealkylase activity 1.6 times more (Table 3).
There were no differences of the liver microsomal erythromycin N-demethylase activity among the 4 experiment groups (Table 3).
Immunohistochemistry of CYP2E1 and CYP2B1/2 In the normal liver tissue, immunohistochemical staining of CYP2E1 showed moderate or weak staining around the centrolobular vein (Figure 3C, 3D). In the DEN-2-AAF group and 2-AAF alone group, the positive staining area was extended and the staining was stronger than that of the control group (Figure 3A). The staining of CYP2E1 was also not seen in the hepatocytes within the altered hepatic foci (Figure 3B).
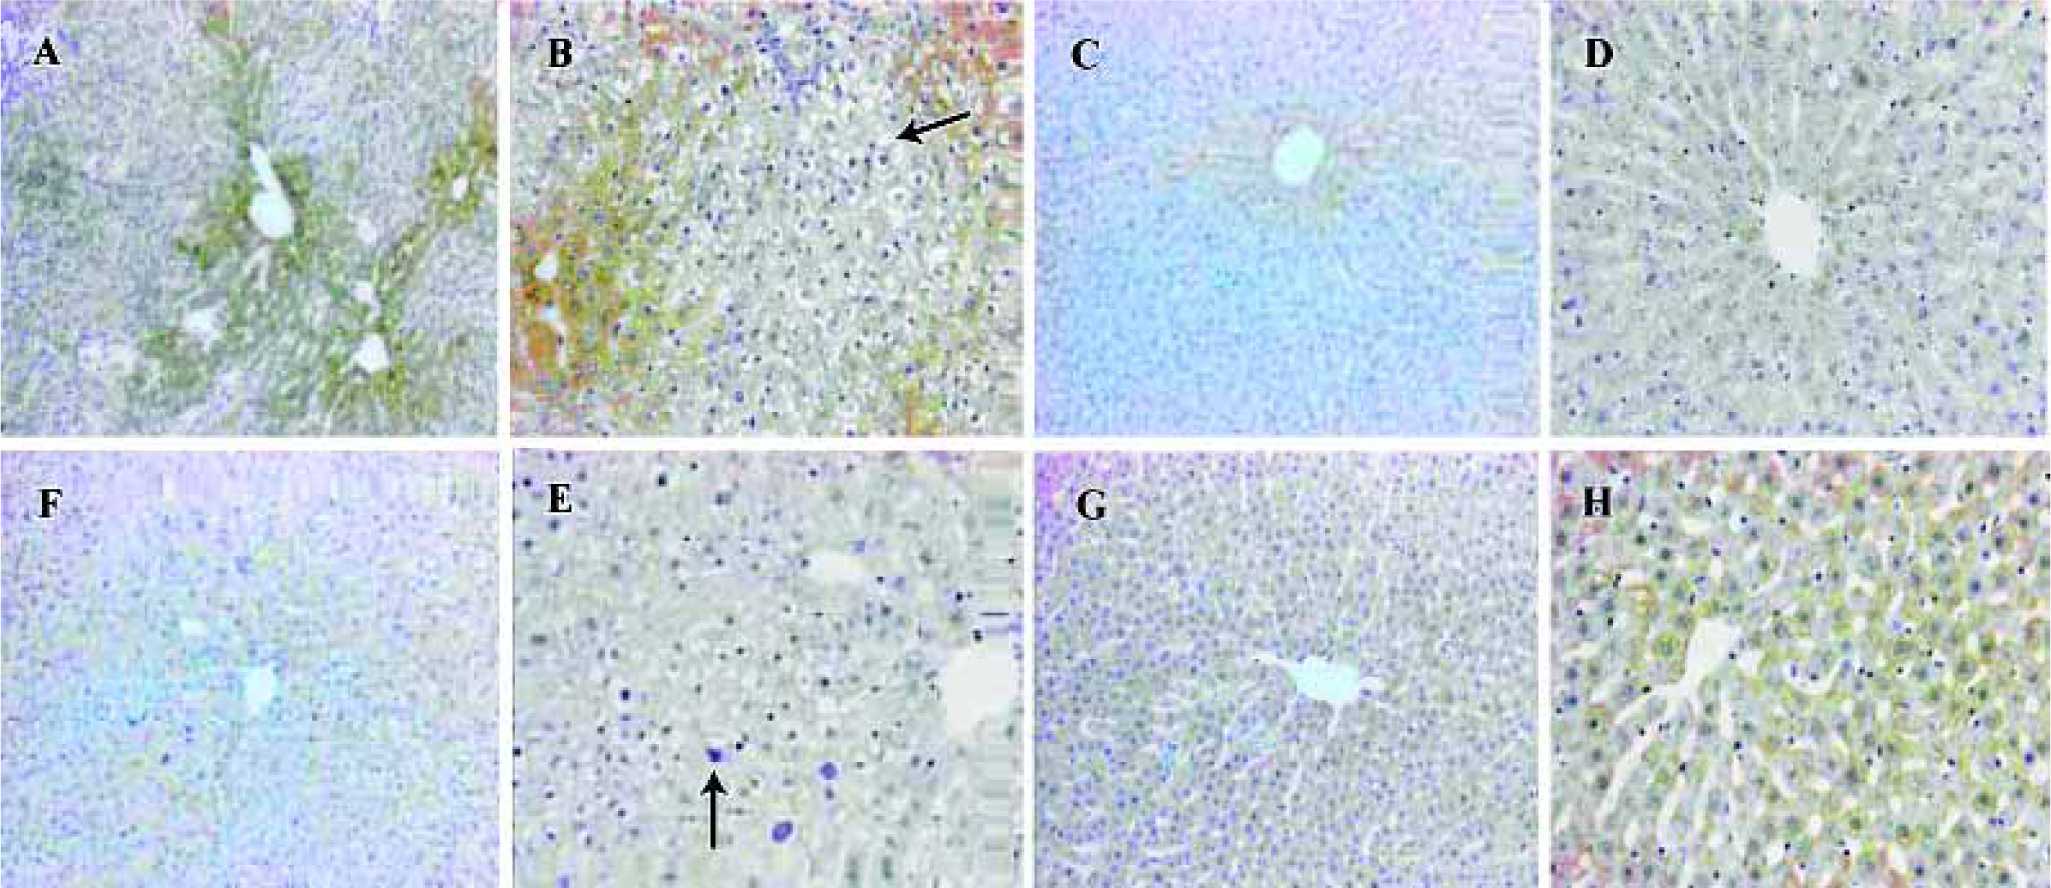
In the normal liver tissue, immunohistochemical staining of CYP2B1/2 showed a strong centrolobular staining pattern; no staining of CYP2B1/2 was found in the periportal area (Figure 3G, 3H). In the liver treated with DEN-2-AAF, centrolobular staining of CYP2B1/2 was relatively weak and the number of positive hepatocytes was less than that in the normal tissue (Figure 3E). There was no staining of CYP2B1/2 in the altered hepatic foci hepatocytes, except some positive staining hepatocytes scattered among the negative hepatocytes (Figure 3F).
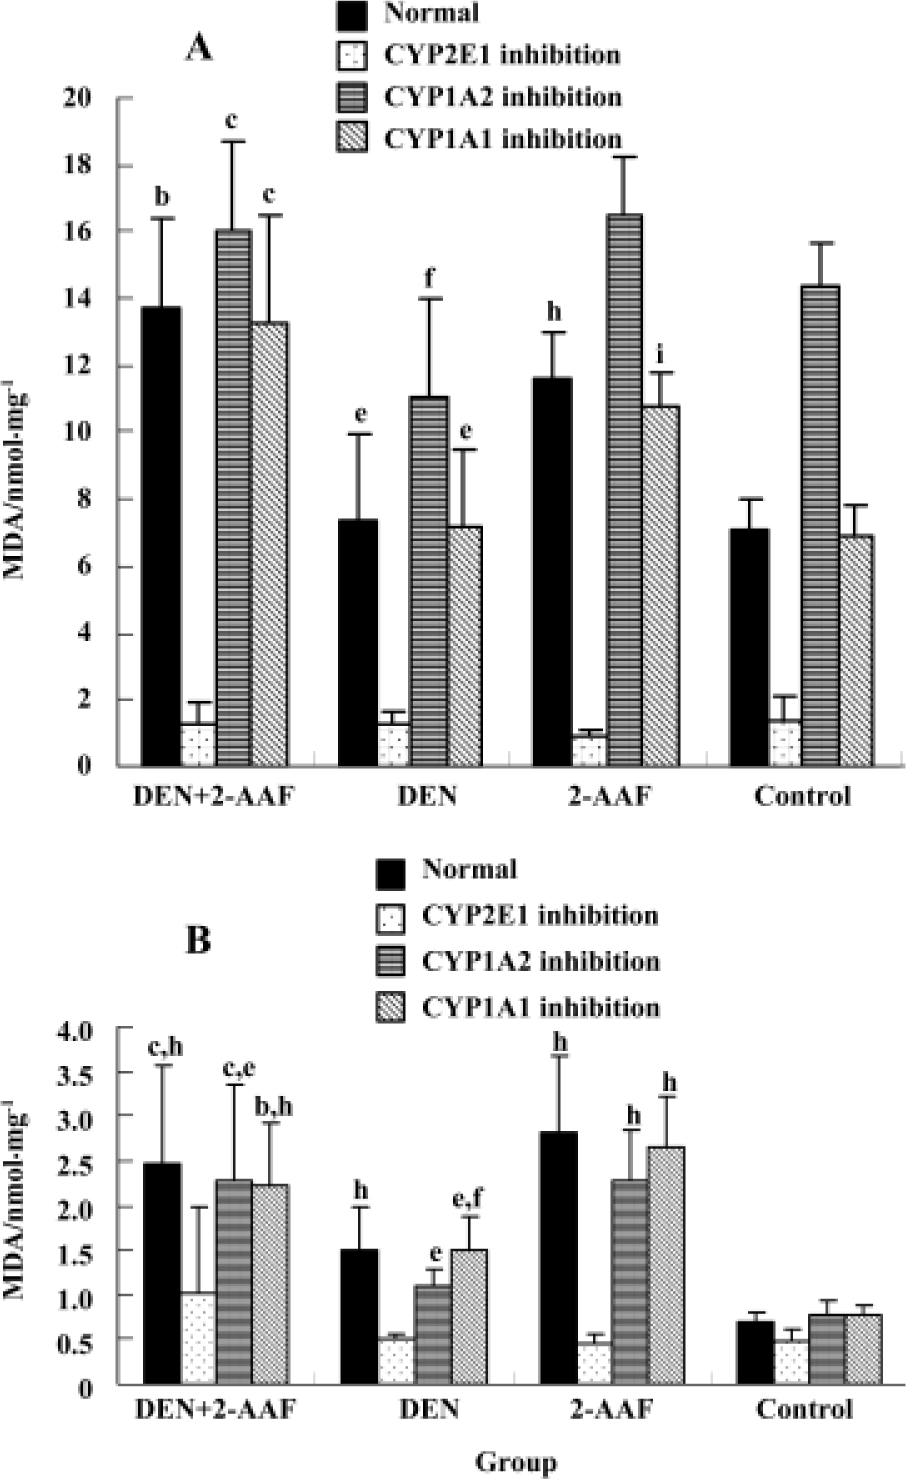
Liver microsomal lipid peroxidation and glutathione level Treatment with DEN/PH/2-AAF significantly (P<0.01, n=5) increased the ability of liver microsome to generate the lipid peroxidation whether in the presence or absence of Fe3+/ADP. Treatment with 2-AAF or a single injection of DEN could also increase the generation of lipid peroxidation without the presence of Fe3+/ADP. However, in the presence of Fe3+/ADP, no remarkable alteration existed between the groups DEN, 2-AAF, and control group, probably because Fe3+/ADP presence could increase the normal liver microsomal lipid peroxidation and obliterate the difference. In the presence of CYP2E1 inhibitor diethyl-dithiocarbamate, the generation of lipid peroxidation decreased remarkably (P<0.01, n=5) in all 4 groups. The difference between the groups was obliterated. All 4 groups bore the higher lipid peroxida-tion in the presence of CYP1A inhibitor α-naphthoflavone and Fe3+/ADP, than in the absence of α-naphthoflavone (Figure 4). This can indicate the specific role of CYP2E1 and CYP1A2 in the generation of microsomal lipid peroxidation.
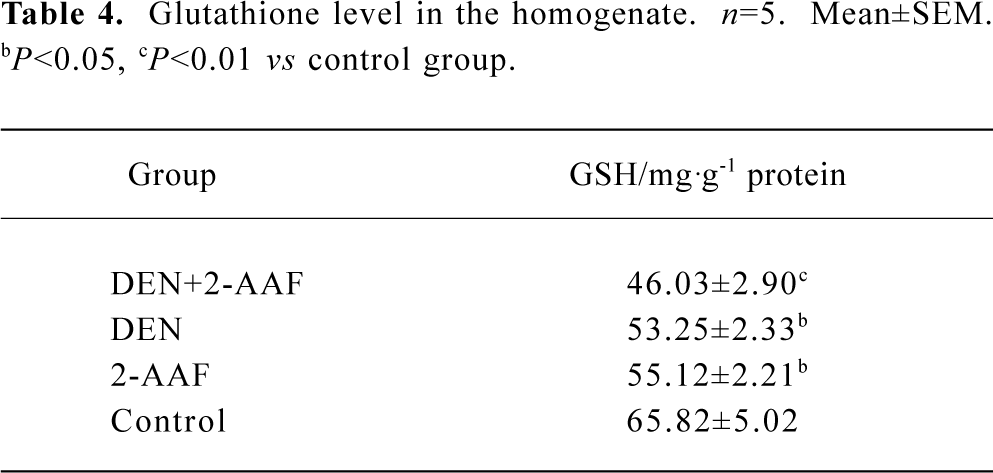
Glutathione depletion in the DEN-2-AAF group was evident in the data of the glutathione level in the liver homogenization (Table 4).
Full table
Discussion
With the present carcinogenic protocol, treatment of rats with single injection DEN or 2-AAF alone for 6 weeks only induced sporadic, little-altered hepatic foci or GST-P positive cells, but treatment of DEN as initiator and 2-AAF as promoter induced many altered hepatic foci in the liver. It has been demonstrated that neoplastic or preneoplastic changes of the liver results in a decrease in the amount of total P450 and the altered expression of CYP isozymes in the liver[14]. Some isozymes can be overexpressed, at the same time, other isozymes are downregulated expressed. The present work confirmed the alteration expression of CYP1A1, CYP1A2, CYP2B1/2 and CYP2E1. As we expected, CYP1A2 was down-regulated in groups A and C. As the previous report demonstrated[15], the expression of CYP1A2 was reduced preferentially in the liver bearing hyperplastic nodules. CYP1A1 which was undetectable in control rat liver, appeared in the groups A, B, and C. It was not expected that treatment with DEN alone significantly increased ethoxy-O-dealkylase activity, as DEN has no capacity for inducing CYP1A1 in vitro. This unexpected change was similar to those observed previously in the treatment of rats with DEN alone[15]. The mechanism of the unexpected appearance of CYP1A1 in the liver treated with DEN alone remains unclear and requires further study. It has been proposed that a link exists between the capacity of agents and their ability to promote hepatocarcinogenesis[16]. The altered hepatic foci that shows reduction of expression of CYP2B1/2 might have more potential to grow into hyperplastic nodules [17]. In the present study, CYP2B1/2 was down-regulated in groups A and C. However, CYP2B1/2 was down-regulated expression in the cells within the altered hepatic foci the same as the previous report .
CYP2E1 is a major microsomal source of hydrogen peroxide and NADPH-dependent lipid peroxidation[18]. In the present study, CYP2E1 inhibitor inhibited most microsomal lipid peroxidation production in all 4 groups and obliterated the difference among the groups. Thus, the increasing lipid microsomal peroxidation might be induced by overexpression of CYP2E1. This result was in accordance with the major role of CYP2E1 in the generation of microsomal hydrogen peroxide. Immunohistochemical assay indicated that CYP2E1 mainly expressed around the centrolobular vein and most of hepatocytes in the altered hepatic foci were negative. Thus, the hepatocytes within the altered hepatic foci might bear less peroxidation injury than that in the surrounding area. This could contribute to the formation of a resistant phenotype. Studies in vitro have indicated that CYP2E1 overexpression has left cells vulnerable to death from GSH depletion[19]; the different susceptibilities to ROS between hepatocytes within the altered hepatic foci and surrounding tissue can be partially explained by the depletion of glutathione, which was confirmed by the present assay of glutathione in the liver.
The previous study demonstrated that xenobiotic AHR(Aryl Hydrocarbon Receptor) ligands were mechanistically involved in toxicological processes of oxidative stress, generally resulting in increasing ROS production in microsomes[20]. The specific role of CYP1A1 and CYP1A2 that contributed to the generation of microsomal lipid peroxidation seemed to be contrary. CYP1A1 appeared to be an important contributor to a microsomal oxidative stress response. However, CYP1A2 decreased the microsomal hydrogen peroxidation generated by CYP2E1 and CYP1A1 by acting as an electron acceptor to prevent the uncoupled electron transferring from NADPH to O2[21]. The present results indicate that CYP1A inhibitor α-naphthoflavone promotes the generation of lipid peroxidation in the presence of Fe3+/ADP and did not effect the generation of lipid peroxidation in the absence of Fe3+/ADP. Because α-naphthoflavone is a more potent inhibitor of CYP1A2 than CYP1A1, and CYP1A2 was an antioxidant enzyme, we proposed that more lipid peroxidation production in groups A and C could result not only from over-expression of CYP2E1 and CYP1A1, but also from decreased expression of CYP1A2.
Changes in CYP isozymes expression can directly produce interindividual differences in susceptibility to carcinogenic compounds; toxicities are modulated by these enzymes. N-nitrosodiethylaminie (DEN) is a widely occurring carcinogenic nitrosamine that requires oxygenation of the α-carbon catalyzed by CYP (mainly by CYP2E1) for its DNA-damaging activity[22]. The first necessary step for 2-AAF activation is N-hydroxylation mediated by CYP1A to form the proximate carcinogen N-OH-AAF[23]. In normal rat livers, the relevant isozyme mediated N-hydroxylation of 2-AAF is CYP1A2, but in the liver in which CYP1A1 was induced, we speculated that this step was mediated primarily by CYP1A1, because CYP1A1 N-hydroxylated 2-AAF 6 times more rapidly than CYP1A2. Therefore, in the present study, DEN+2-AAF, DEN, and 2-AAF group, in which CYP1A1 was induced, might have more susceptibility to 2-AAF. Although we are unable to explain the high induction of CYP1A1 in the rat liver of the DEN-PH group, the induction of CYP1A1 after a single injection of DEN might result in more 2-AAF being transformed to N-OH-AAF. Based on this proposal, it can be concluded that alteration of expression of CYP1A1/2 contributed to the hepatocytes within the preneoplastic foci acquisition of resistance to 2-AAF.
In conclusion, the expression of CYP was altered in the early stage of hepatocarcinogenesis and these alterations have an effect on the alteration of cell redox status and the metabolism of carcinogen.
Acknowledgment
We would like to thank Ms Hua SHENG, Ms Xing-ju YUAN, Ms Mei-ying WANG, Mr Ming DU, and Mr Jun-liang WU for their assistance in the experiments.
References
- Lim JH, Lu AYH. Inhibition and induction of cytochrome P450 and the clinical implications. Clin Pharmacokinet 1998;35:361-90.
- Yu MW, Gladek-Yarborough A, Chiamprasert S, Santella RM, Liaw YF, Chen CJ. Cytochrome P450 2E1 and glutathione S-transferase M1 polymorphisms and susceptibility to hepatocellular carcinoma. Gastroenterology 1995;109:1266-73.
- Han XM, Zhou HH. Polymorphism of CYP450 and cancer susceptibility. Acta Pharmacol Sin 2000;21:673-9.
- Toussaint C, Albin N, Massaad L, Grunenwald D. Main drugs and carcinogen-metabolizing enzyme systems in human non-small cell lung cancer and peritumoral tissues. Cancer Res 1993;53:4608-12.
- Puga A, Marlowe J, Knudsen ES. Role of the aryl hydrocarbon receptor in cell cycle regulation. Toxicology 2002;181-182:171-7.
- Maliakal PP, Coville PF, Wanwimolruk S. Decreased hepatic drug-metabolizing enzyme activity in rats with nitrosamine-induced tumours. Drug Metabol Drug Interact 2002;19:13-27.
- Roomi MW, Ho RK, Farber E. A common biochemical pattern in preneoplastic nodules induced by 2-acetylaminofluorene in rat liver. Cancer Res 1985;45:564-71.
- Rinaudo JAS, Farber E. The pattern of metabolism of 2-acetyl-aminofluorene in carcinogen-induced hepatocyte nodules in comparison to normal liver. Carcinogenesis 1986;7:523-8.
- Hu JJ, Hong JY, Lea MA, Yang CS. Differential expression of cytochrome P4502E1 (CYP2E1) in Morris hepatomas and livers of tumor bearing rats. Int J Oncol 1998;12:1049-53.
- Klaunig JE, Xu Y, Isenberg JS. The role of oxidative stress in chemical carcinogenesis. Environ Health Perspect 1998;106:289-95.
- Sapone A, Affatato A, Canistro D, Broccoli M, Trespidi S, Pozzetti L, et al. Induction and suppression of cytochrome P450 isoenzymes and generation of oxygen radicals by procymidone in liver, kidney and lung of CD1 mice. Mutat Res 2003;527:67-80.
- Ito N, Imaida K, Shirai T. Early detection of carcinogenic substances and modifiers in rats. Mutation Research 2000;462:209-17.
- Ito N, Hasegawa R, Hagiwara A. Medium-term rat liver bioassay for rapid detection of hepatocarcinogenic substances. J Toxicol Pathol 1997;10:1-11.
- Degawa M, Miura S, Hashimoto Y. Expression and induction of cytochrome P450 isozymes in hyperplastic nodules of rat liver. Carcinogenesis 1991;12:2151-6.
- Degawa M, Miura S, Hashimoto Y. Altered expression of hepatic CYP1A Enzymes in rat hepatocarcinogenesis. Jpn J Cancer Res 1995;86:535-9.
- Chen ZY, Eaton DL. Differential regulation of cytochrome (s) P4502B1/2 by phenobarbital, hepatic hyperplastic nodules induced by aflatoxin B1, or diethylnitrosamine plus 2-acetylamino-fluorene in male F344 rats. Toxicol Appl Pharmacol 1991;111:132-44.
- Chen ZY, Farin F, Eaton DL. Association between growth stimulation by phenobarbital and express of cytochromes P450 1A1,1A2, 2B1/2 and 3A1 in hepatic hyperplastic nodules in male F344 rats. Carcinogenesis 1992;13:675-82.
- Leclercq IA, Farrell GC, Field J, Bell DR, Gonzalez FJ, Robertson GR. CYP2E1 and CYP4A as microsomal catalysts of lipid peroxides in murine nonalcoholic steatohepatitis. J Clin Invest 2000;105:1067-75.
- Jones BE, Liu H, Lo CR, Koop DR, Czaja MJ. Cytochrome P450 2E1 expression induces hepatocyte resistance to cell death from oxidative stress. Antioxid Redox Signal 2002;4:701-9.
- Dalton TP, Puga A, Shertzer HG. Induction of cellular oxidative stress by aryl hydrocarbon receptor activation. Chem Biol Interact 2002;141:77-95.
- Shertzer HG, Clay CD, Genter MB, Schneider SN, Nebert DW, Dalton TP. CYP1A2 protects against reactive oxygen production in mouse liver microsomes. Free Radical Biol Med 2004;36:605-17.
- Suzuki T, Imagawa M, Yamada R, Yokoyama K, Kondo S, Itakura K, et al. Acute changes in liver gene expression in the N-nitrsodiethylamine-treated rat. Carcinogenesis 1994;15:1759-61.
- Schrenk D, Gant TW, Michalke A, Orzechowski A, Silverman JA, Battula N, et al. Metabolic activation of 2-acetyl-aminofluorene is required for induction of multidrug resistance gene expression in rat liver cells. Carcinogenesis 1994;15:2541-6.