
Detecting robust gene signature through integrated analysis of multiple types of high-throughput data in liver cancer1
Introduction
Since the completion of the human genome draft[1,2], there was a recurrent need for informaticians to integrate various biology information with the human genome. The capability of viewing different comparative data of a chromosome or the entire genome becomes highly desirable for determining the gene expression level from all of the individual compartments[2]. For example, microarrays and serial analyses of gene expression (SAGE) are the 2 main approaches for high-throughput gene expression analysis, and even though these techniques have been applied broadly, each approach has its own advantages and disadvantages. They are both effective in gene expression profiling research; however, at individual gene expression level, the results of microarrays are not solid enough and the results of SAGE are subject to size and reliability of the SAGE libraries. Cross-examination of different sources of gene expression relational data is not only important to perform a comprehensive analysis of gene expression profile, but also provides an approach to revise each gene expression level.
Presently, the methods of analyses concentrate on integrated analyses generated by a single type of platform. The studies have attempted to integrate data of a similar nature, especially transcriptome data. For example, Lamb et al[3] integrated gene expression data from different sources to develop a mechanistic understanding of the function of cyclin D1 in tumorigenesis. Twenty one genes were found to be induced by both wild-type and mutant cyclin D1.
Genome alterations, such as chromosomal gains and losses, deletions, amplification, and methylation, can be studied with technologies of loss of heterozygosity (LOH), comparative genomic hybridization (CGH), and CGH array[4]. It has been discovered that most genome alterations affect mRNA expression[5]. Thus, it would be very useful to integrate genome alterations and transcriptome profiles[6], which, hampered by the fact that different studies use different platforms, protocols, and analysis techniques, remains a tough problem.
In this report, we use an approach of integrating a highly diverse collection of liver cancer genome-wide datasets at both the genome and transcriptome levels to discover the robust gene signatures (RGS) in liver cancer.
Materials and methods
System flow The system flow includes 5 major steps: (i) data preparation; (ii) initial analysis of each dataset; (iii) unification of the log ratio value of each experiment with t-statistics algorithm; (iv) integrative analysis with 1-class Significance Analysis of Microarrays (SAM), coupled with ranking score method; and (v) gene expression map generation.
Data preparation LOH data in liver cancer was obtained by searching PubMed (http://www.ncbi.nlm.nih.gov/entrez/query.fcgi?db=PubMed) with key words (LOH or “loss of heterozygosity”) and “liver cancer”. Microarray datasets were downloaded from the Stanford Microarray Database (SMD, http://genome-www5.stanford.edu), http://www.genome.wi.mit.edu/MPR, and Gene Expression Omnibus (GEO, http://www.ncbi.nlm.nih.gov/geo). Two pairs of liver cancer SAGE libraries were downloaded from the Cancer Genome Anatomy Project (CGAP, http://cgap.nci.nih.gov/).
The samples used in all the transcriptome datasets were reviewed and assigned to one of the liver cancer sample subtypes, including focal nodular hyperplasia (FNH), liver adenocarcinoma (Adenoma), primary tumor (PrimTumor), cell line (Cellline), and metastatic liver cancer (Metastatic). All the transcriptome datasets were accordingly split into 1 or more subtype datasets, which were named by the following method: DatabaseFirstAuthorCancerSubType (eg XINCHEN-LiverAdenoma) or DatabaseIdPlatformCancer-SubType (eg, GSE3500GPL2831LiverCellline).
Initial analysis for each present datasets We developed an algorithm of transforming LOH frequency to log ratio value. If a gene is located within or overlaps with a LOH region, then the possibility of under-representation of the target gene, called PU, is defined as:
where W is a weight factor and F is LOH frequency. A median frequency value of all LOH reports was used for the PU calculation if a LOH description had no frequency value in the corresponding report. The W value was set to 5 in default, so PU would be between -5 and 0. We did this because that most downregulated gene expression values (log ratio values) were in that range, hence, PU and gene expression M value had a similar range and distribution.
Fisher’s exact test[7] was performed on SAGE or Expressed Sequence Taq (EST) data between the normal and tumor libraries. The false discovery rate (FDR) values were calculated and applied as the threshold to screen the differentially expressed genes (DEG, QDEFAULT=0.10). The log ratio value, usually named the M value, was calculated between 2 SAGE or EST libraries for each unique tag or gene. The algorithm was described earlier[7]. If a particular tag had count nA in library A and count nB in library B, and if the total number of tags counted was tA for library A and tB for library B, then the M value was calculated as:
M=log2(nA+0.1)+log2(tB-nB+0.1)-log2(nB+0.1)-log2(tA-nA+0.1)
This algorithm simulated M value computation in the microarray data processing, and the resultant value had very similar performance of the M value in the microarray.
The SAM method[8] was conducted to screen DEG in the microarray datasets. The significance threshold was set to Q<0.10.
Combination of log ratio values Penalized t-statistics[9] was applied to combine the M values in parallel experiments within a dataset. The combined values were used in further integrative analyses.
Integrated analyses One-class SAM statistics, coupled with an algorithm of computing ranking score, named the R value, were applied in integrated analyses. The R value was defined as follows: any DEG log ratio values in all present dataset had a mean called X –. If >0, for each positive log ratio value (Xn), Rn was assigned 1, and for each negative Xn, Rn was set to -2; if X –<0, for each positive Xn, Rn was assigned -2, and for each negative Xn, Rn was set to 1. Consequently, the R value was calculated as:
Dual significance thresholds, Q<0.01 in SAM and R>9 in the ranking score, were used to screen the DEG among all the datasets.
Unsupervised hierarchical cluster methodology was conducted to the RGS genes in all the present datasets by using software package R (http://www.r-project.org/) Gene Ontology (GO, http://www.geneontology.org). Category enrichment analysis was performed by using GoMiner software (Genomics and Bioinformatics Group (GBG) of LMP, Georgia Tech/Emory University, USA)[10].
System assessment A comprehensive review of the published papers was conducted to validate the screened DEG. Two measurements, namely accuracy (Ac) and correlation coefficients (CC), were used to assess the results of our approach[11]. The upregulation and downregulation of gene expression were regarded as positive and negative, respectively. The validated gene expression information based on both literature and RT-PCR was used as a “golden criterion” to evaluate the predicted results. The 4 measurements were each calculated in terms of true positive (TP), false negative (FN), true negative (TN), and false positive (FP), as described earlier[11]. Each measurement was given as follows:
Gene expression map generation The human genome (hg18)-based gene expression map was implemented in Practical Extraction and Report Language (PERL) for the visualization and comparison of all included datasets. The UC Santa Cruz (UCSC) databases (http://hgdownload.cse.ucsc.edu/goldenPath/hg18/database) were used to obtain the information of each genome element, including chromosome size, the location of the cytogenetic band, centromere, and stalk.
Results and Discussion
Preliminary analysis Two microarray datasets, GSE3500 and SMD_XINCHEN, were downloaded from the GEO and SMD databases, respectively. After the assignment of the samples to liver cancer subtypes, 16 microarray datasets, namely GSE3500GPL2831LiverCellline, GSE3500GPL2831-LiverPrimTumor, GSE3500GPL2948LiverPrimTumor, GSE3500GPL3007LiverPrimTumor, GSE3500GPL3008Liver-PrimTumor, GSE3500GPL3009LiverFNH, GSE3500GPL3009-LiverPrimTumor, GSE3500GPL3011LiverAdenoma, GSE3500GPL3011LiverPrimTumo, GSE3500rGPL2935-Liver-Tumor, GSE3536LiverCellLine, SMD_XINCHENLiver-Adenoma, SMD_XINCHENLiverCellline, SMD_XINCHEN-LiverFNH, SMD_XINCHENLiverMetastatic, and SMD_XIN-CHENLiverPritumor, were collected, and from them, 1156, 3119, 3083, 2267, 614, 1016, 2998, 481, 2427, 1235, 2230, 2910, 1949, 3200, 2188, and 2904 DEG were screened, respectively, with a significance threshold of Q<0.10. One liver normal SAGE library, namely SAGE_Liver_normal_B_1, and 2 liver tumor SAGE libraries, namely SAGE_Liver_cholangiocar-cinoma_B_K1 and SAGE_Liver_cholangiocarcinoma_B_K2D were downloaded from CGAP. From the 2 cancer library (separately) versus the 1 normal library, in total, 1194 and 1020 DEG were obtained via Fisher's exact test, respectively. A total number of 1 625 051 gene expression measurements were analyzed.
Since LOH has a higher resolution than traditional CGH and has been broadly applied in genome alteration studies in many kinds of cancers, LOH data were adopted in this work to represent genome alterations. By reviewing the abstracts of 568 previous reports, 252 liver cancer-related LOH results were obtained (see supplementary file Table S1). All the LOH regions and markers were mapped to the human genome physical map (hg18).
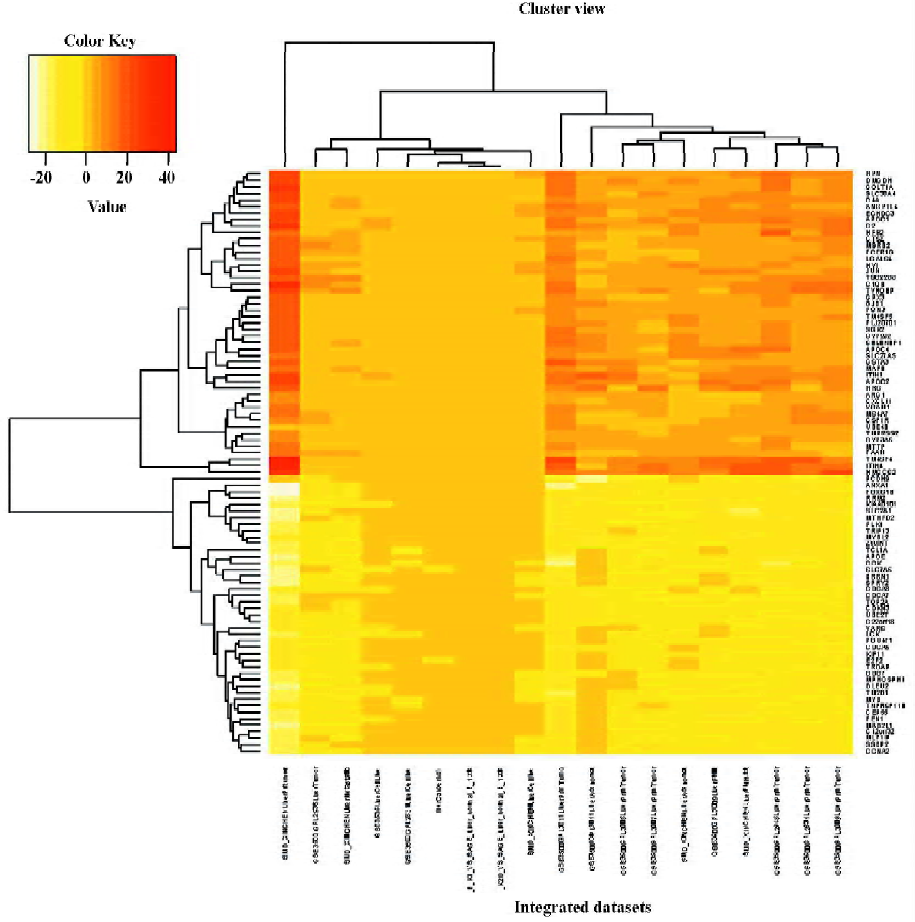
RGS of liver cancer The RGS in liver cancer was identified. By using the significance threshold of Q<0.01, 5 genes, namely, KIAA0101, TM2D1, MYB, JUN, and CCK, were present in at least 14 of 19 liver cancer signatures (R>13), 90 genes were present in at least 13 signatures (R>12), and 202 genes in at least 12 signatures (R>11; Table S2). Our discussion focuses on the 90 genes (R>12), including 43 under-represented and 47 over-represented genes. The hierarchical clustering result of the 90 liver cancer RGS genes is depicted in Figure 1. Many of the RGS genes have previously been associated with cancers, such as JUN, APOE, HRG, CCNA2, and LCK. We searched the RGS genes against the Online Mendelian Inheritance in Man (OMIM) database in the National Center for Biotechnology Information (NCBI) and found that 41 of the 90 genes had previously been associated with cancer (see supplementary file Table S3), while the remaining 59 genes were potential cancer genes and worthy of further study.
The GO category enrichment analysis was performed using GoMiner software. We screened the GO categories at the condition of 1000 random permutation and the statistical threshold of FDR<0.001. For the under-represented RGS genes, 14 GO terms, namely “apoptosis”, “chromosomal part”, “cell division”, “mitosis”, “cell cycle”, “chromosome”, “programmed cell death”, “M phase”, “mitotic cell cycle”, “intracellular non-membrane-bound organelle”, “non-membrane-bound organelle”, “M phase of mitotic cell cycle”, “cell cycle phase”, and “cell cycle process” were screened nevertheless for the over-represented RGS genes, 6 GO terms, namely “lipid transporter activity”, “extracellular space”, “extracellular region part”, “extracellular region”, “immunoglobulin-mediated immune response”, and “regulation of lipoprotein lipase activity” represented meaningful biological differences between RGS genes and auto-generated control genes (see supplementary file Table S4). The enrichment analysis results suggested that the under-represented RGS genes in liver cancer moved towards the process of cell death, cell cycle, and apoptosis, while the over-represented RGS genes were in relation to extracellular activity.
System assessment We separately assessed 9 analyses of single datasets: 7 microarray signatures of liver primary tumor tissues, 2 pairs of SAGE libraries, and the integrated analyses of all signatures. Table 1 shows the system assessment results. As expected, the integrative analyses generally had better performances than single dataset analyses. For the single dataset analyses, the Ac value ranged from 56% to 78% and the CC value from 0.42 to 0.75, whereas for the integration analyses, the Ac value was 92% and the CC value was 0.88.
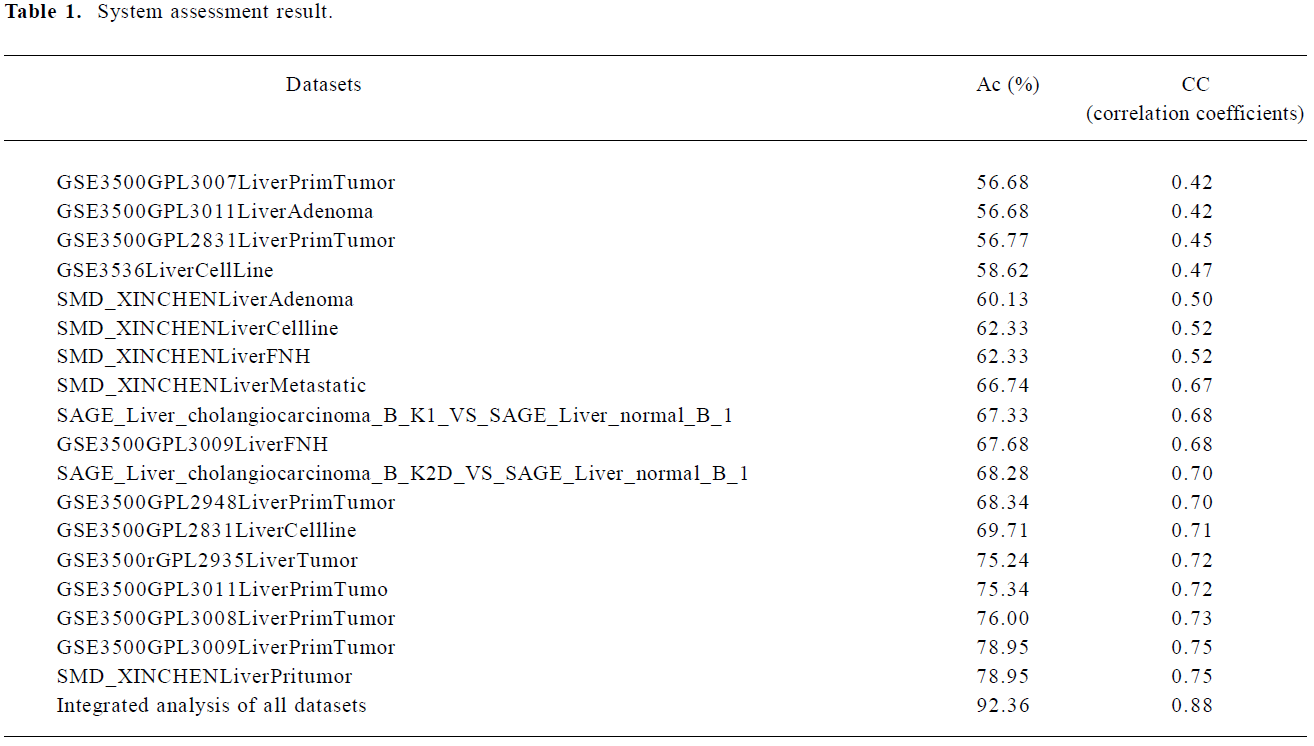
Full table
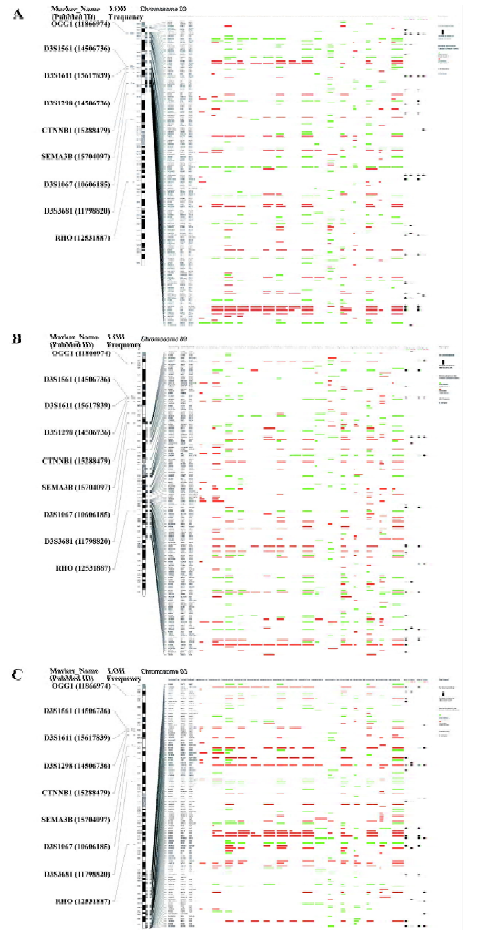
Genome-wide gene expression map in liver cancer The gene expression map of chromosome 3 in liver cancer is shown in Figure 2. A full view of all human genome and a higher-resolution version of this map is is available as supplementary file Figure S1. It may help oncologists to compare different studies in a single eyeshot and can also be used as a gene expression “database”, which is convenient for looking for specific genes.
References
- Lander ES, Linton LM, Birren B, Nusbaum C, Zody MC, Baldwin J, et al. Initial sequencing and analysis of the human genome. Nature 2001;409:860-921.
- Venter JC, Adams MD, Myers EW, Li PW, Mural RJ, Sutton GG, et al. The sequence of the human genome. Science 2001;291:1304-51.
- Lamb J, Ramaswamy S, Ford HL, Contreras B, Martinez RV, Kittrell FS, et al. A mechanism of cyclin D1 action encoded in the patterns of gene expression in human cancer. Cell 2003;114:323-34.
- Tai AL, Mak W, Ng PK, Chua DT, Ng MY, Fu L, et al. High-throughput loss-of-heterozygosity study of chromosome 3p in lung cancer using single-nucleotide polymorphism markers. Cancer Res 2006;66:4133-8.
- Spanakis NE, Gorgoulis V, Mariatos G, Zacharatos P, Kotsinas A, Garinis G, et al. Aberrant p16 expression is correlated with hemizygous deletions at the 9p21–22 chromosome region in non-small cell lung carcinomas. Anticancer Res 1999;19:1893-9.
- Hanash S. Integrated global profiling of cancer. Nat Rev Cancer 2004;4:638-44.
- Beissbarth T, Hyde L, Smyth GK, Job C, Boon WM, Tan SS, et al. Statistical modeling of sequencing errors in SAGE libraries. Bioinformatics 2004;20:I31-9.
- Tusher VG, Tibshirani R, Chu G. Significance analysis of microarrays applied to the ionizing radiation response. Proc Natl Acad Sci USA 2001;98:5116-21.
- Efron B, Tibshirani R. Empirical bayes methods and false discovery rates for microarrays. Genet Epidemiol 2002;23:70-86.
- Zeeberg BR, Qin H, Narasimhan S, Sunshine M, Cao H, Kane DW, et al. High-throughput GoMiner, an ‘industrial-strength’ integrative gene ontology tool for interpretation of multiple-microarray experiments, with application to studies of common variable immune deficiency (CVID). BMC Bioinformatics 2005;6:168.
- Kim JH, Lee J, Oh B, Kimm K, Koh I. Prediction of phosphorylation sites using SVMs. Bioinformatics 2004;20:3179-84.