
Molecular dynamics simulations of interaction between protein-tyrosine phosphatase 1B and a bidentate inhibitor1
Introduction
Protein-tyrosine phosphatases (PTP) are signaling enzymes that regulate a wide variety of cellular processes, including cell growth, differentiation, metabolism, progression through the cell cycle, cell-cell communication, cell migration, gene transcription, ion channel activity, the immune response, and apoptosis/survival decisions. Defective or inappropriate regulation of PTP activity can lead to aberrant tyrosine phosphorylation, which contributes to the development of many human diseases, including cancers and diabetes. PTP1B is regarded as a major negative regulator of both insulin- and leptin-stimulated signal transduction pathways, which suggests that specific PTP1B inhibitors may enhance insulin and leptin sensitivity and act as effective therapeutics for the treatment of type 2 diabetes, insulin resistance, and obesity. Thus, PTP1B is an attractive candidate for the design of drugs for the treatment of type 2 diabetes and obesity.
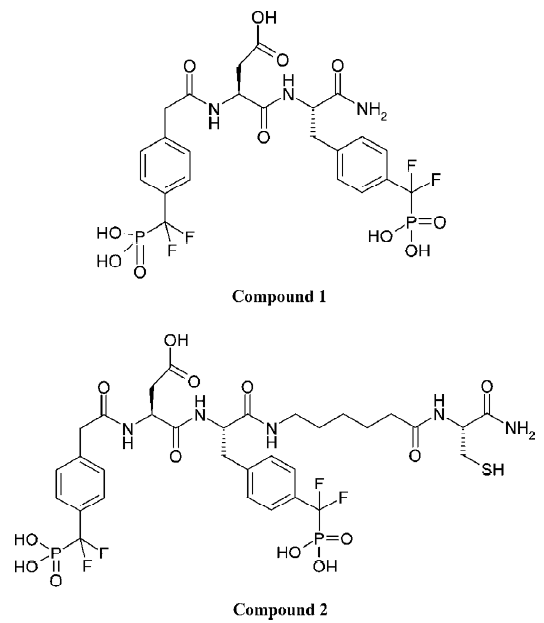
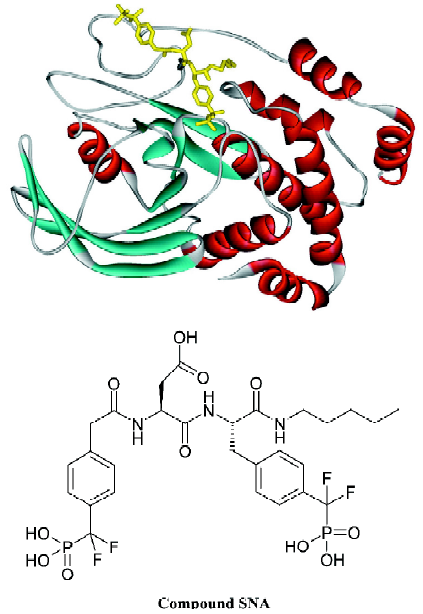
The development of PTP1B inhibitors began in the early 1990s and continues today[1–11]. PTP1B contains one high-affinity catalytic aryl phosphate binding site and, adjacent to it, one low-affinity noncatalytic aryl phosphate binding site. The active site of PTP1B is defined by residues 214–221 (P-loop, His-Cys-Ser-Ala-Gly-Ile-Gly-Arg), which binds the aryl phosphate and contains the catalytic Cys (Cys215). The noncatalytic aryl phosphate binding site is demarcated by Arg24 and Arg254. It has been suggested that a compound that simultaneously occupies both aryl phosphate binding sites may be a potent and selective inhibitor of PTP1B[12]. Recent results from Novo Nordisk[13] and Abbott Laboratories[14] demonstrated that this is indeed a viable approach to obtaining potent and selective PTP1B inhibitors. Other efforts aimed at targeting both the active site and the second aryl phosphate binding site have yielded numerous bis-aryl difluorophosphonate inhibitors that have low μmol/L affinity and reasonable selectivity for PTP1B[15–17]. However, some bis-aryl difluorophosphonates do not bind to PTP1B as expected; instead, the distal phosphonate does not bind to the second aryl phosphate-binding site but rather extends into the solvent and is involved in water-mediated ionic interactions with the guanidinium group of Arg47[18]. Zhang’s group acquired a highly potent and selective PTP1B inhibitor (Figure 1; compound 1), which has a Ki value of 2.4 nmol/L for PTP1B and exhibits several orders of magnitude of selectivity in favor of PTP1B against a panel of PTP[4]. Compound 1 is the most potent and selective PTP1B inhibitor reported to date. In order to gain further insight into the structural basis of the potency and selectivity of compound 1 for PTP1B, Zhang and colleagues intended to determine the crystal structure of PTP1B with another compound (Figure 1; compound 2, Ki=1.8 nmol/L), which has almost the same potency and selectivity as compound 1. Yet the final model (Figure 2; the complexed structure and the compound SNA) for the PTP1B-2 complex included PTP1B residues 2–298 and all atoms in compound 2 except the 1-carbamonyl-2-mercaptoethylcarbamoyl portion in the C-terminal extension. However, this does not affect the investigative results, because this missing portion did not affect the affinity of ligands for PTP1B[19].
The objective of the present study was to investigate the structural factors responsible for the high inhibitory potency and selectivity of inhibitor SNA using molecular dynamics simulations. In the present paper, we simultaneously present the 3 ns conventional molecular dynamics simulations of PTP1B in complex with a bidentate inhibitor SNA, as well as an uncomplexed PTP1B, with the purpose of analyzing the interactions between target protein and ligand, and revealing the possible mechanisms of ligand recognition and inhibition. Most importantly, we intend to find the residues beyond the catalytic aryl phosphate binding site that are crucial to increasing inhibitory potency and selectivity.
Materials and methods
Simulation model For comparison, the X-ray crystal structures of PTP1B at 2.80 Å resolution[20] and the PTP1B complexed with a bidentate inhibitor SNA at 2.15 Å resolution[19] were used to construct the structural models for simulations, respectively. Both structures were obtained from the Protein Data Bank at Brookhaven[21]. The entry codes are 2HNP and 1PXH for the uncomplexed and complexed PTP1B crystal structures, respectively. For the uncomplexed PTP1B model, the residue Met1 was added by using the molecular modeling software Sybyl 6.8[22]. By this means, the missing residues Met1-Glu4 and Gly283-Asp298 were also added to the PTP1B-SNA complex according to the crystal structure of the uncomplexed PTP1B. The repaired residues were subjected to energy minimization in Sybyl 6.8, using the steepest descent method up to a gradient tolerance of 0.05 kcal/(mol·Å) to relieve possible steric clashes and overlaps of the side chains by fixing the remaining part of the complex. The ionization states of all the residues of the 2 models are set as their standard protonation states.
Molecular dynamics simulation The molecular dynamics (MD) simulations were performed in periodic boundary conditions using the GROMACS program (version 3.1.4)[23,24] with the GROMACS force field[25,26]. The molecular topology file and force field parameters except the charges for the inhibitor SNA were generated by the program PRODRG[27]. The partial atomic charges of SNA were determined by using the CHELPG method[28] implemented in the Gaussian 98 program[29] at the level of HF/6-31G*. Before MD simulations, the uncomplexed and complexed models were solvated with the explicit SPC water[30] embedded in 7.0 nm×6.5 nm×6.8 nm or 7.3 nm×6.4 nm×7.2 nm boxes, respectively, in which the minimum distance between the protein surface and the box face was 0.8 nm in both cases. To neutralize the systems, 9 sodium ions were added to replace 9 water molecules in the boxes. The simulation systems were composed of 29525 (2HNP) and 31969 (1PXH) atoms in total. The systems were then subjected to a steepest descent energy minimization until a tolerance of 100 kJ/mol, step by step. At first, all water molecules and ions, with the whole fixed protein and inhibitor, were energy minimized, followed by the minimization for the protein by fixing the main-chain and Ca atoms. Finally, the entire systems were minimized. Afterwards, the solvent molecules were equilibrated with fixed protein at 300 K for 100 ps, taking the initial velocities from a Maxwellian distribution. Subsequently, the equilibrations of the protein and inhibitor were carried out for 20 ps at 10, 50, 100, 200, and 300 K. It should be pointed out that the protein and the ligand were fixed during the process of heating up. So the solute (ie, protein and inhibitor) was subsequently relaxed step by step and heated up to 300 K by using several 20 ps MD simulations. Finally, the 3 ns molecular dynamics simulations were performed under normal temperature (300 K) and pressure (1 bar), using a temperature coupling time constant of 0.1 ps and a pressure coupling time constant of 1.0 ps[31]. The value of the isothermal compressibility was set to 4.5×10⁻⁵ bar-1 for water simulations. All bond lengths including hydrogen atoms were constrained by the LINCS algorithm[32]. The electrostatic interactions were calculated by using the Particle-mesh Ewald (PME) algorithm[33], with interpolation order of 4 and a grid spacing of 0.12 nm. The cutoff for van der Waals interactions was 0.9 nm. Simulations were performed with a time step of 2 fs, and coordinates were saved every 1 ps.
Examinations and repairs of the molecular structures were achieved using the Sybyl modeling program. All simulations were carried out using the GROMACS program on a 128-processor SGI Origin3800 server. Analyses were preformed using the features within the GROMACS package.
Results and discussion
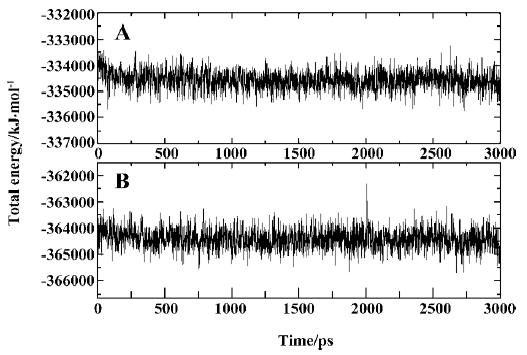
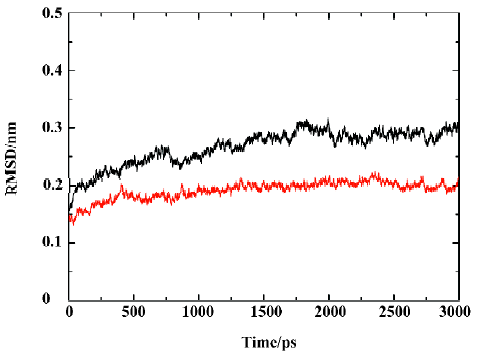
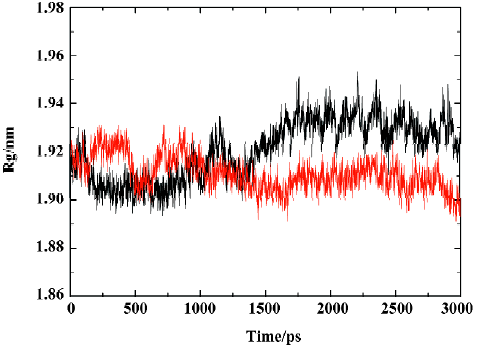
MD trajectories Molecular dynamics simulations of the uncomplexed PTP1B structure and the PTP1B-inhibitor complex (Figure 2) were performed using explicit SPC water and applying periodic boundary conditions. The total energies of both simulation models versus simulation time are shown in Figure 3A, 3B, which gives an indication of the overall stability of the MD trajectory. In general, the total energy of the system decreases slightly but does not change too much during the simulation except that the energy of the uncomplexed structure decreases more sharply than the complexed one in the first 80 ps. The root mean square deviation (RMSD) from the starting structure is an important criterion for the convergence of the protein system. The RMSD values of all protein atoms of PTP1B and PTP1B-inhibitor structures are shown in Figure 4, showing that the 2 simulation systems appear to have been stabilized after 1700 ps and 500 ps equilibrations, respectively. Furthermore, as shown in Figure 4, the RMSD for the uncomplexed PTP1B is larger than that for the complexed structure, which indicates that the flexibility of PTP1B decreases upon binding the ligand. This can also be confirmed by the larger fluctuation in the radius of gyration (Figure 5) of the uncomplexed structure relative to that of the complexed one.
Principal component analysis To support our results and investigate the most significant collective modes of motion occurring during the simulations of the uncomplexed PTP1B and complexed PTP1B, the covariance matrix corresponding to the Ca-atom coordinates was calculated and principal component analysis (ie, essential dynamics analysis) was performed. By diagonalizing the covariance matrix, the anharmonic and large-scale motions of the protein are isolated from the mostly harmonic and small-scale motions. Because the large-scale anharmonic motions in the essential subspace are often correlated to the vital functions of the protein, we only focus on these movements.
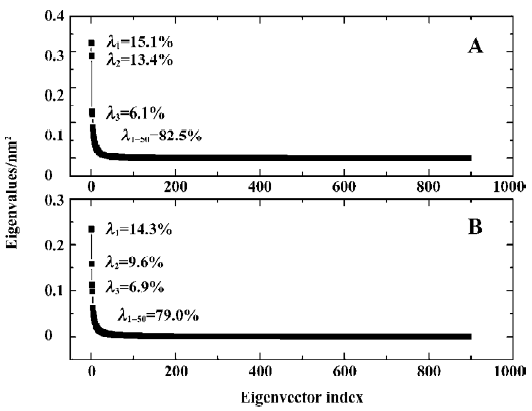
The 3N eigenvalues (894 eigenvalues) of the covariance matrix were ranked in a decreasing order of magnitude as shown in Figure 6. As is shown, ~80% of the total positional fluctuations are described by the first 50 eigenvectors of both models, which is similar to the simulation result of Peters et al[34], but different from the usual case, in which the first 10 eigenvectors represent ~95% of the total motion for the other protein. This indicates that the fluctuations in PTP1B are more complicated. Although the first 50 eigenvectors account for ~80% of eigenvectors, the first 4 eigenvectors alone represent about 40% (40.5% and 36.7% for uncomplexed and complexed PTP1B, respectively) of the fluctuations. Thus, the displacements of the components of the first 4 eigenvectors for uncomplexed PTP1B and complexed PTP1B are shown in Figure 7.
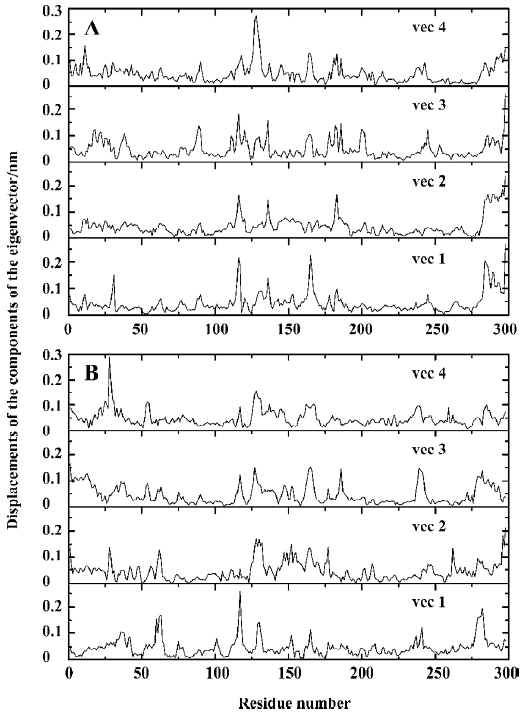
It is obvious that the fluctuations of the residues of the 4 eigenvectors appear similar for uncomplexed PTP1B or the complexed PTP1B independently. For uncomplexed PTP1B, the significant fluctuations are localized on the residues 113–120, 128–132, 162–168, 178–185, and 234–242, as well as the N-terminal and C-terminal regions. It is not surprising that the significant fluctuations occur in these regions, because they are generally located in the loop regions of the protein. Similarly, there also exist the fluctuations in these regions for the complexed PTP1B. But the fluctuations in residues 162–168 and 178–185 decrease. Because the WPD-loop (178–185) moves toward the inhibitor and interacts with the inhibitor, the fluctuation in this region decreases. Corres-pondingly, the loop (162–168) next to the WPD-loop fluctuates less. In contrast, the fluctuations in residues 234–242 of the complexed PTP1B are slightly more intense than those of the uncomplexed PTP1B. Additionally, a significant fluctuation in residues 59–65, which are contained in a long loop far from the ligand binding site, appears in the complexed PTP1B.
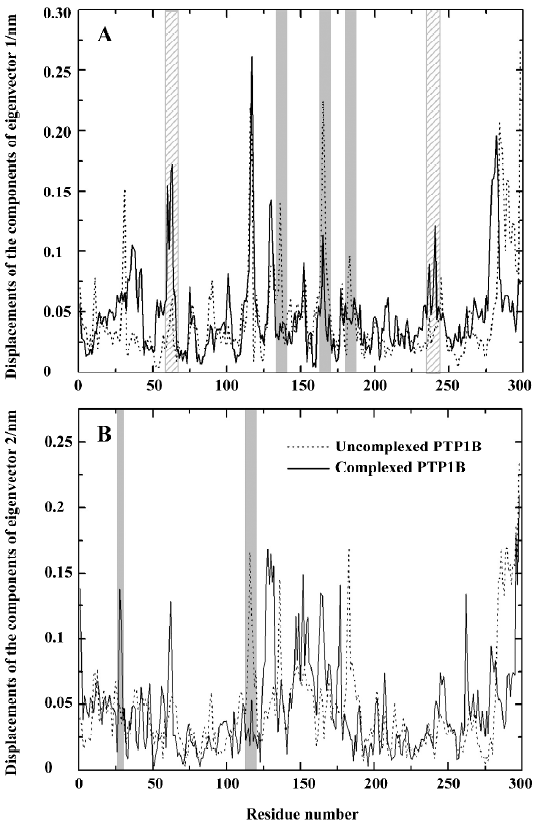
For comparing the fluctuations between uncomplexed and complexed PTP1B more clearly, we displayed the displacements of residues of eigenvector 1 for uncomplexed and complexed PTP1B in one plot (Figure 8A), and those of eigenvector 2 for both systems were drawn in another plot (Figure 8B), because the fluctuations of eigenvectors 1 and 2 are the major motions. It can be seen from Figure 8A that ligand binding reduces motion in residues 128–135, 162–168 and 178–185 (WPD-loop), whereas increases in fluctuations are observed in segments 59–65 and 234–242. It is not surprising that the fluctuation in the WPD-loop reduces once the ligand binds, because the WPD-loop moves toward the ligand and forms hydrophobic interactions with it, and the flexibility of the WPD-loop reduces accordingly. Visualization of the motions along the simulation revealed that the WPD-loop of the complexed PTP1B remained close all the way. Although the fluctuations in the WPD-loop of the uncomplexed PTP1B were oscillatory in nature, it was generally open, but closed once in a while, a finding that is consistent with previous experimental[35] and theoretical[34] results. This may be explained by the flexibility of the WPD-loop of the uncomplexed PTP1B, and it may be another reason that typical motions of peptide loops occur on a much longer time scale (10-9 to 10-1 s)[36–41]. Compared with the fluctuations of the components of eigenvector 1, those of eigenvector 2 have similar fluctuations, except for 2 relatively evident differences, specifically, the decreased fluctuation in region 114–120 and an increased fluctuation in residues 28 and 29 (Figure 8B).
General interaction between compound SNA and PTP1B To explore the interaction between the inhibitor SNA and the target protein PTP1B, we calculated the energy contributions of van der Waals and electrostatic energies. The van der Waals and short-range electrostatic energies between PTP1B and the inhibitor SNA and those between SNA and the solvent during the simulation are shown in Figure 9A and 9B, respectively. As indicated in Figure 9A (black curve), the van der Waals energy between SNA and PTP1B during the simulation is approximately -170 kJ/mol on average. However, the average short-range electrostatic energy between the SNA and PTP1B is approximately -794 kJ/mol (Figure 9A, red curve). Because the overall electrostatic energy between the ligand and the receptor comprises both short-range and long-range electrostatic energy, the overall electrostatic energy between SNA and PTP1B is doubtless lower than -794 kJ/mol. Thus it can be concluded that the electrostatic interaction plays a more important role in the PTP1B-SNA interactions than the van der Waals interaction. Indeed, previous studies have revealed that the field surrounding the binding pocket is positive and therefore PTP1B prefers negatively charged ligands[42]. Similarly, the short-range electrostatic energy (average -749 kJ/mol) is lower than the van der Waals energy (average -19 kJ/mol) between the inhibitor SNA and the solvent (Figure 9B). Both the ligand–solvent interaction energies are slightly higher than those between the ligand and the protein. The comparatively strong ligand-solvent electrostatic energy can be explained by the ligand being partly exposed to the solvent. Our calculated van der Waals and electrostatic energies between SNA and the protein/solvent are basically in agreement with those of a previous theoretical study[42].
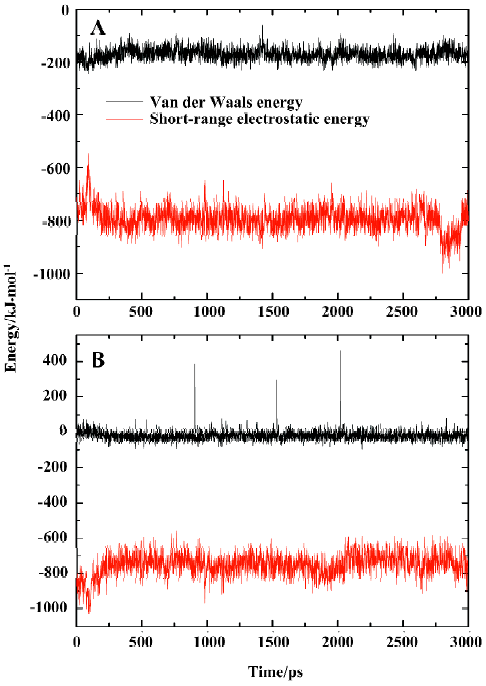
Yet, from Figure 9A it can be seen that there is a sudden decrease in PTP1B-SNA electrostatic energy between 2789 ps and 2944 ps of the simulation time. What is the reason for such a change? For the purposes of explaining this pheno-menon, we investigated the hydrogen bonding interaction between SNA and PTP1B.
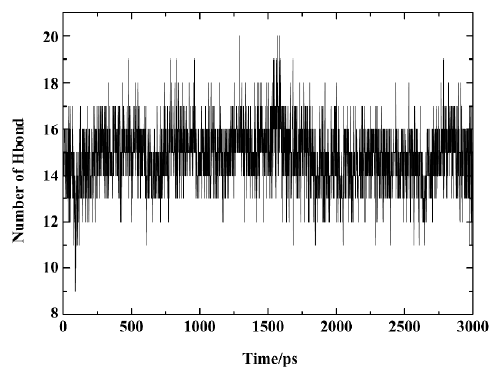
Figure 10 shows the number of hydrogen bonds between PTP1B and SNA during the 3 ns simulation. In general, the number of hydrogen bonds mostly fluctuates between 14 and 17 within the simulation time, which indicates that there are always 14–17 hydrogen bonds between SNA and PTP1B. Figure 11 shows which hydrogen bonds exist between PTP1B and SNA every 15 ps during the simulation. The hydrogen bonds with indexes 1–9 are those of Lys41-SNA. Indexes 10–22 correspond to the hydrogen bonds between Arg47 and SNA. Indexes 23 and 39–43 are the hydrogen bonds between Asp48 and SNA, and indexes 24–38 correspond to the hydrogen bonding interactions between the residues of PTP1B and the F2Pmp moiety of SNA. As is shown in Figure 11, the lines with indexes 25–28, 30–32, and 34 always appear with the simulation time, indicating that the hydrogen bonds between F2Pmp of the inhibitor and the residues of PTP1B exist all along. Also, 2 hydrogen bonds (indexes 10 and 20) between Arg47 and the distal phosphate of the inhibitor exist all along. As for the hydrogen bonding interactions between Asp48 and the linker Asp of SNA, 2 hydrogen bonds with indexes 39 and 41 form before 1850 ps, after which another 2 with indexes 40 and 42 appear. These hydrogen bonds play a crucial role in determining the orientation and configuration of ligands in binding to PTP1B. Although the number of hydrogen bonds between the F2Pmp of SNA and PTP1B is more than those between other regions of SNA and PTP1B, the latter still exert fairly important roles in locating the remaining parts of SNA. Other hydrogen bonds arise once in a while due to the flexibilities of both the ligand and the receptor.
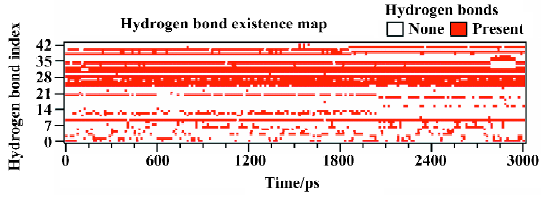
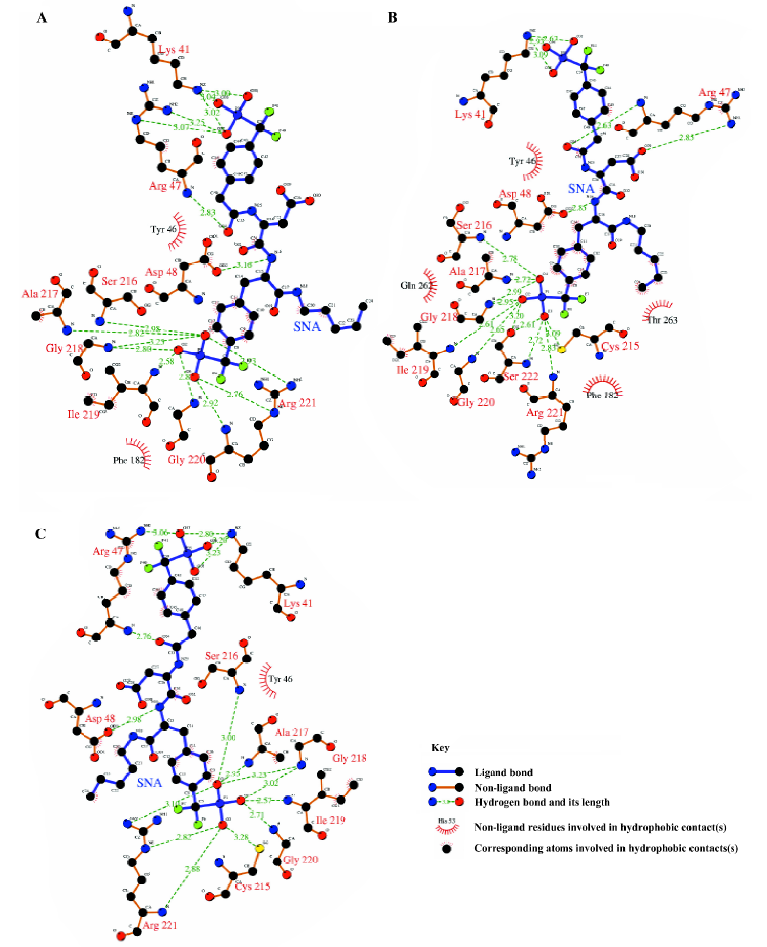
From Figure 11, it can be seen that between 2789 ps and 2944 ps simulation time, the hydrogen bonds with indexes 32 and 34, which correspond to 2 hydrogen bonds between residue Arg221 and the F2Pmp of SNA, disappear. Meanwhile, 3 new hydrogen bonds (indexes 35, 36, and 37) form between residue Ser222 and the F2Pmp of SNA. Furthermore, the lengths of other hydrogen bonds become short. All these may be the reasons for the reduction in electrostatic energy between PTP1B and inhibitor SNA between 2789 ps and 2944 ps. After 2944 ps, the situation reverts as it was before 2789 ps. The interacting models derived by the LIGPLOT program[43] of the inhibitor SNA with PTP1B are illustrated in Figure 12A, 12B, and 12C, which were taken from the structures with the average electrostatic energy of each stage.
Interactions in the active site F2Pmp of the inhibitor SNA occupies the active site of PTP1B. By visualizing the structures of the MD simulation and monitoring the distances of some atoms along the MD trajectory of complexed PTP1B, we gained an insight into the interactions between F2Pmp of the inhibitor SNA and the residues in the active site.
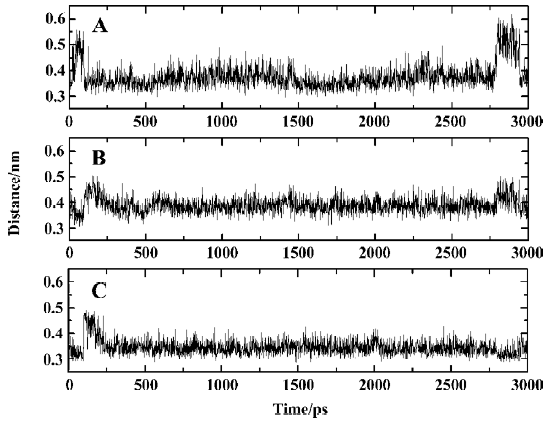
It can be seen clearly from the 2-dimensional representations of the interaction model of SNA with PTP1B (Figure 12) that the terminal phosphonate oxygens of F2Pmp form hydrogen bonds with the backbone amides of the phosphate-binding loop (residues 215–221) and the guanidinium side chain of Arg221. Also, the phenyl ring of F2Pmp is sandwiched between the side chains of Tyr46 and Phe182 and makes the hydrophobic and van der Waals interactions with the side chains of Ala217, Ile219, and Gln262. The interactions described here are similar to those between the Pmp-containing inhibitor and the active site. Unique to F2Pmp are the hydrogen bonds formed between the 2 benzylic fluorines and the residues in the active site, which are thought to be the reason that F2Pmp-containing inhibitors bind PTP better than Pmp-containing inhibitors. Based on our MD trajectory, we monitored the distances between the 2 benzylic fluorines and the residues of PTP1B. We found that the distances between the 2 benzylic fluorines and the main chain nitrogen of Phe182, as well as the distance between one benzylic fluorine (F6) and one nitrogen atom (NH2) of the guanidinium group of Arg221, were in general smaller than 0.4 nm, except at the starting stage of the MD simulation and at 2789–2944 ps (Figure 13). These results indicate that there exist hydrogen bonds between the 2 benzylic fluorine atoms of SNA and the main chain nitrogen of residue Phe182, and a third hydrogen bond is also formed between one benzylic fluorine (F6) and the NH2 atom of the guanidinium group of Arg221.
Interactions between SNA and PTP1B beyond the active site Because the interactions between the F2Pmp of an inhibitor and the active site of PTP1B have been extensively investigated previously and, moreover, because the interactions between the remainder of SNA and PTP1B (Figure 12) beyond the active site appear crucial in increasing inhibitory potency and selectivity, we therefore put emphasis on discussion of the interactions of SNA with PTP1B beyond the active site. From the interaction modes at 3 particular times (Figure 12), we know that the residues Lys41, Arg47, and Asp48 are important. To confirm which interactions exist all along and which are the most important, we monitored the distances of atoms of SNA from residues Lys41, Arg47, and Asp48 as a function of simulation time.
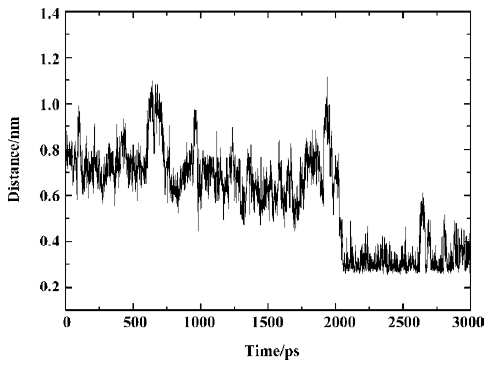
According to the distances between Arg47 and SNA atoms, it was found that a hydrogen bond between the main chain nitrogen of Arg47 and the carbonyl of the distal 4-phosphonodifluoromethylphenylacetyl group always exists during the simulation, which can also be confirmed by previous results (index 10 of Figure 11 and 12). Also, the nitrogen atoms of the guanidinium group of Arg47 form hydrogen bonds with the Asp side chain of SNA. In addition, there is a polar interaction between a fluorine atom of the distal difluorophosphonate group and the guanidinium group of Arg47. It should be noted that because of the high flexibility of the side chain of Arg47, the bond CD-CG (Figure 12) rotates at 2030 ps and thus the Arg47NH1-F polar interaction disappears and the Arg47NH2-F polar interaction arises. All these interactions of Arg47 with SNA are consistent with the experimental results[19]. Furthermore, due to the rotation of the CD-CG bond, the guanidinium group turned, and the NH2 atom of the guanidinium group approached one oxygen atom of the distal phosphate of SNA, forming a hydrogen bond after 2030 ps (Figure 14).
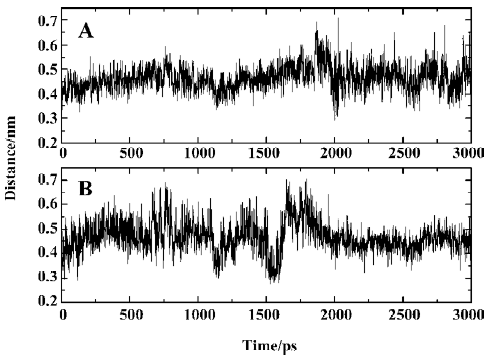
As is shown in Figure 12, there exists a hydrogen bond between one oxygen atom of the side chain of Asp48 and the main chain nitrogen of F2Pmp of SNA, a finding that is in agreement with experimental data[19]. However, another hydrogen bond, which was proposed to form between Asp48 and the C-terminal amide of F2Pmp, is not present in Figure 12. In order to determine if the second hydrogen bond exists, we monitored the distance between the side chain oxygen of Asp48 and the C-terminal amide of F2Pmp. The distances between the OD1 or OD2 of Asp48 and N18 of the C-terminal amide of SNA are shown in Figure 15A and 15B, respectively, which indicate that such a hydrogen bond does not exist, because the distances are mostly larger than 0.4 nm during the simulation.
As for the third important surface residue of PTP1B, Lys41, 2, or 3 hydrogen bonds are present between the amino group of Lys41 and the phosphonate oxygen atoms. The number of hydrogen bonds based on our simulation is more than that (one hydrogen bond) suggested by experimental data[19]. On the other hand, the polar interaction suggested by the experiment was not found in our simulation.
Considering the number and distribution of hydrogen bonds for Lys41, Arg47, and Asp48, we predict that Arg47 plays the most important role in inhibitory potency and selectivity. However, to evaluate these contributions, a detailed calculation of the free energy change during binding has to be performed, which may be carried out later.
In addition to the hydrogen bonding interactions and polar interactions, there are also some hydrophobic interactions that are shown in Figure 12. It is evident that the hydrophobic interactions are less strong than the other interactions, so we will not describe them in detail, because they do not predominate. However, we should comment on the hydrophobic interactions associated with the aliphatic chain of SNA, which are the only interactions with that chain. These come from the aliphatic portions of the side chains of Asp48 and Gln262. They are too weak to restrict the location of the aliphatic chain of SNA. Therefore, the aliphatic chain of SNA swings acutely during the simulation, which causes other parts of SNA to move to some extent.
Conclusion
The 3 ns molecular dynamics (MD) simulations on uncomplexed and complexed PTP1B were carried out with the aim of revealing the possible mechanisms of ligand recognition and inhibition. Based on our dynamics simulation and conformation analysis, many useful results were obtained. First, upon binding the ligand, the flexibility of the entire PTP1B molecule decreases. The most notable change is the movement of the WPD-loop, which moves toward the inhibitor and forms hydrophobic interaction with it, and the flexibility of the PTP1B molecule reduces accordingly. Second, according to our calculated van der Waals and electrostatic energies between PTP1B and the inhibitor SNA, it is evident that the electrostatic interaction contributes more to PTP1B-SNA complex conformation than the van der Waals interaction. This result is consistent with those of previous studies. Third, by analyzing the interactions between PTP1B and the high-affinity inhibitor SNA, it was found that the residues adjacent to the active site, including Lys41, Tyr46, Arg47, and Asp48, might be partially responsible for the high inhibitory activity and selectivity of SNA. Moreover, the residue Arg47 may be the most important determinant for PTP1B potency and selectivity among these 4 surface residues. Our results confirmed the experimental data, although the details of several PTP1B-SNA interactions beyond the active binding site are not completely in agreement with the experimental findings.
Our simulation results suggest that potent and selective PTP1B inhibitors may be designed by targeting the surface residues, for example the region containing Lys41, Arg47, and Asp48, instead of the second phosphate binding site (besides the active phosphate binding site). Perhaps the strategy of developing inhibitors by targeting not only both of the phosphate binding sites but also the adjacent peripheral sites is also feasible if the inhibitors are not too large to be absorbed.
References
- Ripka WC. In: Doherty AM, editor. Annual Reports in medicinal chemistry, volume 35. San Diego, CA: Academic Press; 2000. p 231–50.
- Johnson TO, Ermolieff J, Jirousek M. Protein tyrosine phosphatase 1B inhibitors for diabetes. Nat Rev Drug Discovery 2002;1:696-709.
- Blaskovich MA, Kim HO. Recent discovery and development of protein tyrosine phosphatase inhibitors. Expert Opin Ther Pat 2002;12:871-905.
- Shen K, Keng YF, Wu L, Guo XL, Lawrence DS, Zhang ZY. Acquisition of a specific and potent PTP1B inhibitor from a novel combinatorial library and screening procedure. J Biol Chem 2001;276:47311-9.
- Xie J, Seto CT. Investigations of linker structure on the potency of a series of bidentate protein tyrosine phosphatase inhibitors. Bioorg Med Chem 2005;13:2981-91.
- Dixit M, Tripathi BK, Srivastava AK, Goel A. Synthesis of functionalized acetophenones as protein tyrosine phosphatase 1B inhibitors. Bioorg Med Chem Lett 2005;15:3394-7.
- Shim YS, Kim KC, Lee KA, Shrestha S, Lee KH, Kim CK, et al. Formylchromone derivatives as irreversible and selective inhibitors of human protein tyrosine phosphatase 1B. Kinetic and modeling studies. Bioorg Med Chem 2005;13:1325-32.
- Ockey DA, Gadek TR. Discovery of novel PTP1b inhibitors. Bioorg Med Chem Lett 2004;14:389-91.
- Zhao HY, Liu G, Xin ZL, Serby MD, Pei ZH, Szczepankiewicz BG, et al. Isoxazole carboxylic acids as protein tyrosine phosphatase 1B (PTP1B) inhibitors. Bioorg Med Chem Lett 2004;14:5543-6.
- Patankar SJ, Jurs PC. Classification of inhibitors of protein tyrosine phosphatase 1B using molecular structure based descriptors. J Chem Inf Comput Sci 2003;43:885-99.
- Zhang ZY, Lee SY. PTP1B inhibitors as potential therapeutics in the treatment of type 2 diabetes and obesity. Expert Opin Investig Drugs 2003;12:223-33.
- Puius YA, Zhao Y, Sullivan M, Lawrence DS, Almo SC, Zhang ZY. Identification of a second aryl phosphate-binding site in protein-tyrosine phosphatase 1B: a paradigm for inhibitor design. Proc Natl Acad Sci USA 1997;94:13420-5.
- Iversen LF, Andersen HS, Moller KB, Olsen OH, Peters GH, Branner S, et al. Steric hindrance as a basis for structure-based design of selective inhibitors of protein-tyrosine phosphatases. Biochemistry 2001;40:14812-20.
- Liu G, Trevillyan JM. Protein tyrosine phosphatase 1B as a target for the treatment of impaired glucose tolerance and type II diabetes. Curr Opin Investig Drugs 2002;3:1608-16.
- Taing M, Keng YF, Shen K, Wu L, Laqrence DS, Zhang ZY. Potent and highly selective inhibitors of the protein tyrosine phosphatase 1B. Biochemistry 1999;276:3793-803.
- Taylor SD, Kotoris CC, Dinaut AN, Wang Q, Ramachandran C, Huang Z. Potent non-peptidyl inhibitors of protein tyrosine phosphatase 1B. Bioorg Med Chem 1998;6:1457-68.
- Desmarais S, Friesen RW, Zamboni R, Ramachandrn C. [Difluro(phosphono)methyl]phenylalanine-containing peptide inhibitors of protein tyrosine phosphatases. Biochem J 1999;337:219-23.
- Jia Z, Ye Q, Dinaut AN, Wang Q, Waddleton D, Payette P, et al. Structure of protein tyrosine phosphatase 1B in complex with inhibitors bearing two phosphotyrosine mimetics. J Med Chem 2001;44:4584-94.
- Sun JP, Fedorov AA, Lee Y, Guo XL, Shen K, Lawrence DS, et al. Crystal structure of PTP1B complexed with a potent and selective bidentate inhibitor. J Biol Chem 2003;278:12406-14.
- Barford D, Flint AJ, Tonks NK. Crystal structure of human protein tyrosine phosphatase 1B. Science 1994;263:1397-404.
- Bernstein FC, Koetzle TF, Williams GJB, Meyer EF, Brice MD, Roger JR, et al. The Protein Data Bank: a computer based archival file for macromolecular structure. J Mol Biol 1977;112:535-42.
- Sybyl [molecular modeling package], version 6.8. St Louis, MO: Tripos Associates; 2000.
- Berendsen HJC, van der Spoel D, van Drunen R. GROMACS: a message-passing parallel molecular dynamics implementation. Comp Phys Commun 1995;91:43-56.
- van der Spoel D, van Buuren AR, Apol E, Meulenhoff PJ, Tieleman DP, Sijbers AL, . Gromacs User Manual, Version 3.1. Nijenborgh, The Netherlands: Groningen University; 2002.
- van der Spoel D, van Buuren AR, Tieleman DP, Berendsen HJ. Molecular dynamics simulations of peptides from BPTI: a closer look at amide-aromatic interactions. J Biomol NMR 1996;8:229-38.
- van Gunsteren WF, Berendsen HJ. Gromos-87 manual. Nijenborgh, The Netherlands: Biomos BV; 1987.
- Van Aalten DMF, Bywater R, Findlay JBC, Hendlich M, Hooft RWW, Vriend G. PRODRG, a program for generating molecular topologies and unique molecular descriptors from coordinates of small molecules. JCAMD 1996;10:255-62.
- Breneman CM, Wiberg KB. Determining atom-centered monopoles from molecular electrostatic potentials. The need for high sampling density in formamide conformational analysis. J Comp Chem 1990;11:361-97.
- Frisch MJ, Trucks GW, Schlegel HB, Scuseria GE, Robb MA, Cheeseman JR, . Gaussian 98, revision A.3. Pittsburgh, PA: Gaussian Inc; 1998.
- Berendsen HJC, Postma JPM, van Gunsteren WF, Hermans J. Interaction models for water in relation to protein hydration. In: Pullman B, editor. Intermolecular forces. Dordrecht, The Netherlands: D Reidel Publishing Company; 1981. p 331–342.
- Berendsen HJC, Postma JPM, DiNola A, Haak JR. Molecular dynamics with coupling to an external bath. J Chem Phys 1984;81:3684-90.
- Hess B, Bekker H, Berendsen HJC, Fraaije JGEM. LINCS: a linear constraint solver for molecular simulations. J Comp Chem 1997;18:1463-72.
- Darden T, York D, Pedersen L. Particle mesh Ewald: an N·log(N) method for Ewald sums in large systems. J Chem Phys 1993;98:10089-92.
- Peters GH, Frimurer TM, Andersen JN, Olsen OH. Molecular dynamics simulations of protein-tyrosine phosphatase 1B. I. ligand-induced changes in the protein motions. Biophys J 1999;77:505-15.
- Lohse DL, Denu JM, Santoro M, Dixon JE. Roles of aspartic acid-181 and serine-222 in intermediate formation and hydrolysis of the mammalian protein-tyrosine-phosphatase PTP1. Biochemistry 1997;36:4568-75.
- Wade RC, Davis ME, Luty BA, Madura JD, McCammon JA. Gating of the active site of triose phosphate isomerase: Brownian dynamics simulations of flexible peptide loops in the enzyme. Biophys J 1993;64:9-15.
- Wade RC, Luty BA, Demchuk E, Madura JD, Davis ME, Briggs JM, et al. Simulation of enzyme-substrate encounter with gated active sites. Nature Struct Biol 1994;1:63-67.
- Kempner ES. Movable lobes and flexible loops in proteins. FEBS Lett 1993;326:4-10.
- Philippopoulos M, Xiang Y, Lim C. Identifying the mechanism of protein loop closure: a molecular dynamics simulation of the Bacillus stearothermophilus LDH loop in solution. Protein Eng 1995;8:565-73.
- Falzone CJ, Wright PE, Benkovic SJ. Dynamics of a flexible loop in dihydrofolate reductase from Escherichia coli and its implication for catalysis. Biochemistry 1994;33:439-42.
- Williams JC, MacDermott AE. Dynamics of the flexible loop of triosephosphate isomerase: the loop motion is not ligand gated. Biochemistry 1995;34:8309-19.
- Peters GH, Frimurer TM, Andersen JN, Olsen OH. Molecular dynamics simulations of protein-tyrosine phosphatase 1B. II. Substrate-enzyme interactions and dynamics. Biophys J 2000;78:2191-200.
- Wallace AC, Laskowski RA, Thornton JM. LIGPLOT: a program to generate schematic diagrams of protein-ligand interactions. Protein Eng 1995;8:127-34.