
Cloning, expression, and functional analysis of human dopamine D1 receptors1
Introduction
The neurotransmitter dopamine (DA) plays a prominent role in a variety of vital brain functions including motor control, short-term memory, attention and reward[1–3]. In the CNS, DA modulates neuronal excitability by regulating ligand- and voltage-gated ion channels[4]. The actions of DA are mediated by a family of seven-transmembrane G protein-coupled receptors (GPCRs), i.e., D1, D2, D3, D4, and D5, encoded by five distinct genes[5]. These five subtypes have been grouped into two different classes based on pharmacology and biochemistry: the D1-like and D2-like receptors. The D1-like receptors, D1 and D5, mediate dopamine stimulation of adenylyl cyclase, whereas D2-like receptors, D2, D3 and D4, mediate dopamine inhibition of adenylyl cyclase[5,6].
Assays capable of detecting and quantifying GPCR-ligand interactions are valuable tools for both fundamental studies of cell siganaling and drug development. Drug screening has mainly relied upon binding assays on membrane preparations using radioligands or assays measuring second messengers or enzymes modulated by these receptors. The ability to conduct high-throughput screening based upon functional activity of a given GPCR in a cell-based assay offers a more direct way of identifying lead agonists or antagonists[7–9].
In the present study, by using HEK293 cell lines stably expressing human D1R, we developed a series of method check character for analyzing GPCR activities in cell lines including CRE-SEAP activity assay and the intracellular calcium assay.
Materials and methods
Materials High glucose Dulbecco’s modified Eagle’s medium (DMEM), fetal calf serum, G418, penicillin and streptomycin were obtained from Gibco. Restricted enzyme (HindIII, EcoRI, XhoI, BamHI), T4 DNA ligase, reverse transcriptase and buffer were purchased from Promega (USA). Pyrobest DNA polymerase and buffer for PCR were obtained from TaKaRa (Dalian, China). (±)-SKF-38393 hydrochloride (SKF38393) and (+)-Butaclamol hydrochloride (Butaclamol) were obtained from RBI (Natick, MA, USA). Forskolin, Fluo-3/AM, p-(dipropylsulfamoyl)benzoic acid, 3-isobutyl-1-methyl-2,6(1H,3H)-purine-dione (IBMX), pluronic F-127, 4-methyl-umbelliferyl phosphate (4-MUP), HEPES, Triton X-100, bovine serum albumin leupeptin, pepstatin A, aprotinin and PMSF were purchased from Sigma (USA). [3H]SCH23390 was purchased from Amersham (USA). Plasmids pcDNA3, pcDNA3.1(+) and Lipofecta-mine2000 were purchased from Invitrogen (USA), and pCRE-SEAP was from BD Biosciences Clontech (USA). cAMP assay kit was purchased from Shanghai Second Medical University (Shanghai, China). Human embryo brain tissue was donated by Huashan Hospital (Shanghai, China). PCR primers were synthesized by Shenyou (Shanghai, China).
Cloning of the human dopamine D1RcDNA Human brain total RNA was obtained from human embryo brain tissue. The total RNA was reverse-transcribed using oligo-dT18 as a primer. With the cDNA, PCR was carried out using the primers D1R-1SE and D1R-1AS (Table 1). Gel-purified PCR product was treated with BamHI/XhoI and subcloned into the BamHI/XhoI site of the mammalian expression vector pcDNA3. With the subcloned D1R-pcDNA3 plasmid as a template, PCR was carried out using the primers D1R-2SE and D1R-2AS (Table 1), which resulted in full length codon sequence of cDNA. Gel-purified PCR product was treated with BamHI/EcoRI and cloned into the BamHI/EcoRI site of the mammalian expression vector pcDNA3.1(+).
Production of HEK293 cell lines stably expressing human dopamine D1RHEK293 Cells were transfected with the D1R-pcDNA3.1(+) expression vector, using the Lipofectamine reagent. Cells were treated with selection medium containing G418 (1 g/L) for 3 weeks to select stably transfected cells displaying neomycin resistance. Between 2 and 3 weeks into the selection process, resistant cells began to appear. They were separated out by serial dilution and allowed to grow from single cells. Receptor expression of single cell-derived colonies was tested by the radioligand binding assay.
Cell cultureHuman embryonic kidney (HEK293) cell lines were cultured in DMEM containing streptomycin (100 µg/mL), penicillin G (1000 kU/L) and fetal bovine serum (10%). Cells were incubated at 37 ºC in 5% CO2. Stably transfected HEK293 cell lines were cultured in DMEM high glucose medium containing streptomycin (100 mg/L), benzylpenicillin (1000 kU/L), G-418 (200 mg/L) and fetal bovine serum (10%). Cells were incubated at 37 ºC in 5% CO2. For passaging, the cells were detached from the cell culture flask by washing with phosphate-buffered saline (PBS) and brief incubation with trypsine (0.5 g/L)/EDTA (0.2 g/L). The cells were passaged every 3 d.
Membrane preparationThe D1 cells were lifted from Petri dishes with a cell scraper. Harvested cells were washed twice with ice-cold PBS and centrifuged at 420×g for 5 min at 4 ºC. The cell pellet was resuspended with hypotonic buffer (5 mmol/L Tris-Cl, 2 mmol/L EDTA, pH7.4, leupeptin 1 mg/L, pepstatin A 1 mg/L, aprotinin 1 mg/L, PMSF 1 mmol/ L) and sonicated (18 s) three times on ice. The homogenate was centrifuged at 960×g for 10 min at 4 ºC. The precipitated nucleic fraction was discarded and the supernatant was centrifuged at 40 000×g for 30 min at 4 ºC. The pellet was washed with 50 mmol/L Tris-Cl buffer (pH 7.4) and centrifuged again with the same conditions. Finally, the pellet was resuspended in the same buffer, and protein concentration was determined by the BCA Kit (Pierce) as described previously[10].
[3H]SCH23390 binding assay Membranes (30–50 µg protein) from D1 cells were resuspended in 50 mmol/L Tris-Cl (pH 7.4, 120 mmol/L NaCl, 5 mmol/L KCl, 2 mmol/L CaCl2 and 1 mmol/L MgCl2). Saturation assays were performed at different concentrations of [3H]SCH23390 (0.05–6 nmol/L), using butaclamol (10 µmol/ L) to obtain nonspecific binding. Competition curves were obtained by using 0.5 nmol/L [3H]SCH23390 and different concentrations of dopamine D1R agonist SKF38393. The incubation was carried out at 37 ºC for 30 min.
Binding assays were stopped by rapid filtration through Whatman GF/B filters, which were immediately washed three times with ice-cold buffer. Filters were then transferred to Eppendoff tubes, and scintillation liquid was added to measure the radioactivity.
cAMP accumulation experimentAfter scraping the cells off the culture plates, they were washed twice with PBS and resuspended in PBS at a concentration of 0.5×10⁶–1.0×10⁶ cells/mL. Aliquots of 0.2 mL were transferred to test tubes along with the phsophodiesterase inhibitor IBMX (100 µmol/L) and different concentrations of dopamine D1R agonist SKF38393 added to a final volume of 0.3 mL. The reaction was terminated with 1 mol/L perchloric acid to a final concentration of 0.5 mol/L after a 15 min incubation at 37 ºC. Samples were neutralized with 75 µL 2 mol/L KOH, and the cAMP content in the supernatants were determined with a protein binding assay[11]. cAMP concentrations were calculated using a standard curve according to the protocol of the assay kit.
CRE-SEAP activity assayUsing the secreted form of human placental alkaline phosphatase (SEAP) as the reporter enzyme transcriptionally regulated by cAMP response elements (CREs)[12,15], CRE-SEAP activity was measured. The pCRE-SEAP plasmid was transfected into D1 cells using the calcium phosphate precipitation method (Promega). Cells were seeded in 100 m2 plates, and transfection was performed when cells were 50% confluent. DNA 25 µg and 60 µL CaCl2 2 mol/L were mixed in H2O in a total volume of 500 µL and then slowly mixed with HEPES buffered saline (HBS). The reaction mixture was incubated at room temperature for 30 min and then evenly added to the cell culture dish containing 10 mL of fresh media. After 12 h, the transfection media was replaced with fresh media, and the transfected D1 cells were seeded into 24-well plates (1.5×10⁵ cells per well) and cultured overnight before experiment[12]. The medium was then replaced with 500 µL of free serum DMEM containing 100 µmol/ L IBMX and the different concentrations of SKF38393 then cells were incubated for 6 h and 12 h, respectively. The SEAP assay was subsequently performed (see below).
Following the incubation period of transiently transfected cells, the culture medium was inactivated for 30 min at 65 ºC and centrifuged at 15 000×g at 4 ºC. The supernatant (80 µL), was transferred to a new 96-well plate and mixed with 100 µL SEAP assay buffer (50 mmol/L Tris/0.1% BSA buffer, pH 8.0) containing 36 µmol/L 4-methylumbelliferyl phosphate (4-MUP). The mixture was incubated for 1 h at 37 ºC, and the fluorescence intensity was measured at 460 nm using FLUOstar plate reader. Excitation wavelength was 355 nm.
Intracellular Ca2+ concentration ([Ca2+]i) measurementCa2+ fluorescence measurements were performed using a NOVOstar plate reader with a pipettor system (BMG Labtechnologies, Offenburg, Germany). D1 cells were harvested with 0.05% trypsin/0.02% EDTA and rinsed with high glucose DMEM containing 10% fetal bovine serum, 100 mg/L streptomycin, 1000 U/mL penicillin G. Pelleted cells were resuspended in fresh medium and kept under 5% CO2 at 37 ºC for 1h and vortexed every 15 min. After twice washes with Krebs-HEPES buffer, cells were loaded with 5 µmol/ L Fluo-3/AM containing 1% pluronic F-127 and 2.5 mmol/L p-(Dipropylsulfamoyl)benzoic acid for 30 min. Then cells were rinsed three times with Krebs-HEPES buffer containing 0.5% bovine serum albumin, diluted, and evenly plated into 96-well plates at a density of 1×10⁴ cells/well. Microplates were kept at 37 ºC for 15 min[13]. Buffer alone or different concentrations of SKF38393 were then injected sequentially into separate wells, and fluorescence intensity was measured at 520 nm for 50 s at 0.2 s intervals. The excitation wavelength was 485 nm.
[Ca2+]i was calculated as follows: [Ca2+]i=Kd (F-Fmin)/(Fmax-F). Fmax refers to the fluorescence intensity measured after permeabilization of the cells with 1% Triton X-100. Ten mmol/L EDTA was added to chelate Ca2+ and minimum fluorescence intensity was obtained (Fmin). A Kd value of 324 nmol/L was used for Fluo-3.
Data analysis Experiments were performed in triplicate. All data were expressed as mean±SD and analyzed with the GraphPad Prism 4.0 program (GraphPad Software, San Diego, CA, USA). Student’s t-test was used for statistical analysis.
Results
Cloning of the human dopamine D1RcDNA To obtain the cDNA with full length codon sequence of D1R, a reverse transcription reaction was carried out using the total RNA extracted from embryo brain tissue. Using cDNA with the full length codon sequence of D1R, a PCR product (1707 bp) was obtained using primers described previously. The PCR product was subcloned into pcDNA3 plasmid and a cDNA (1341 bp) containing the full D1R codon sequence was obtained using this subcloned vector as a template. The cDNA was then cloned into the mammalian expression vector pcDNA3.1. Sequence analysis demonstrated that the sequence of the constructed D1-pcDNA3.1 expression vector was identical to that of human D1R cDNA in the gene bank.
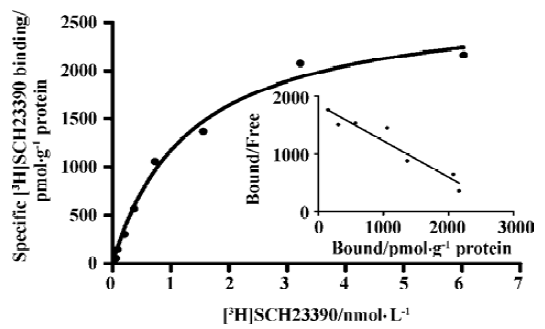
Selection of cell clones Colonies of the selected stable integrants were initially analyzed for human D1R expression by receptor binding assay using [3H]SCH23390. From the transfected HEK293 cell clones, one cell line was obtained with specific [3H]SCH23390 binding.
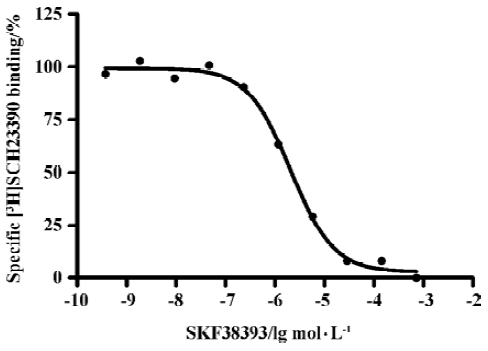
Binding assays with the D1R antagonist [3H]SCH-23390 Scatchard analysis revealed a Kd value of 1.5±0.2 nmol/L) and Bmax value of 2.95±1.53 nmol/g of protein (Figure 1). Figure 2 shows a competition of a D1R agonist SKF38393 for [3H]SCH23390 with an IC50 value of 2.0 (1.5–2.8) µmol/L (means, 95% confidence intervals, n=3).
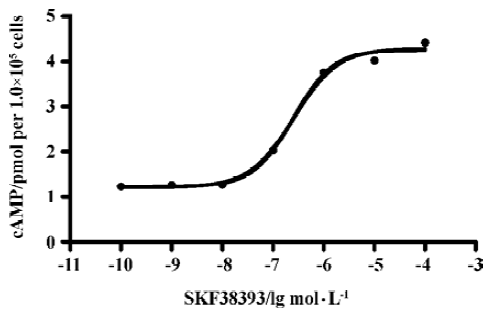
D1R agonist SKF38393 induced accumulation of cAMP D1R agonist SKF38393 induced a concentration-dependent accumulation of cAMP with a EC50 value of 0.25 µmol/L (0.12–0.53) (means, 95% confidence intervals, n=3, Figure 3).
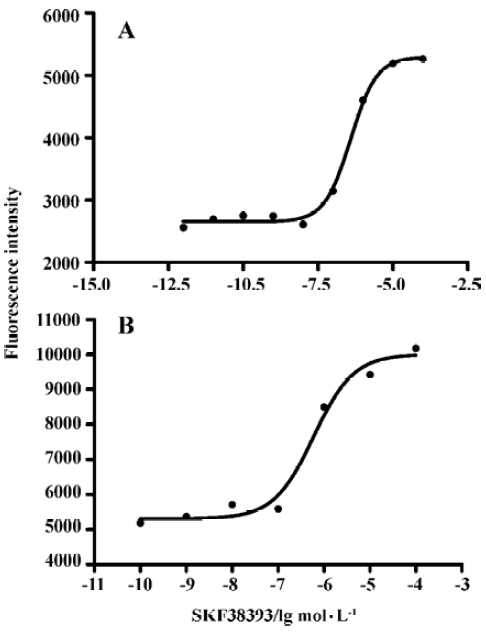
D1R agonist SKF38393 induced CRE-SEAP activityIn D1 cells transiently transfected with pCRE-SEAP reporter vector, SKF38393 induced a concentration-dependent increase in the CRE-SAEP activity. EC50 values at 6 h and 12 h were 0.39 (0.27–0.57) and 0.59 (0.22–1.58) µmol/L (means, 95% confidence intervals, n=3), respectively. No significant difference was found between these two values (Figure 4).
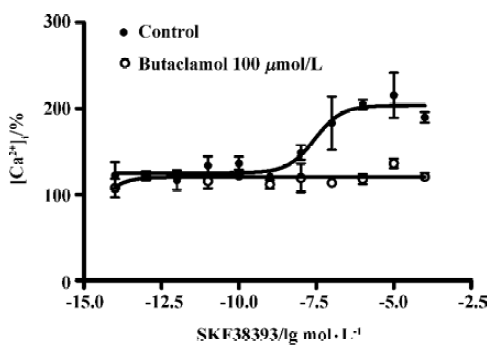
D1R agonist SKF38393 induced elevated intracellular calcium level D1R agonist SKF38393 induced a concentration-dependent increase in the intracellular calcium level. The EC50 value was 27 (8.5–70) nmol/L (means, 95% confidence intervals, n=3). The SKF38393-induced increase of the intracellular calcium level was completely blocked by butaclamol (100 µmol/ L), a DA receptor antagonist (Figure 5).
Discussion
In the present study, a HEK293 cell line stably expressing human D1R was constructed. Functional analysis with cAMP accumulation assay, the CRE-SEAP activity assay, and intracellular calcium assay demonstrated that their EC50 values were 0.25 (0.12–0.53) µmol/L, 0.39 (0.27–0.57) µmol/L for 6 h and 0.59 (0.22–1.58) µmol/L for 12 h and 27 (8.6–70) nmol/ L, respectively. No significant difference in the EC50 values was found between SKF38393-induced cAMP accumulation and CRE-SEAP activation.
D1R can activate adenylyl cyclase, which then results in cAMP production. At present, radioimmunoassay is one of the most widely used methods for the measurement of cAMP accumulation[14]. Cell based assays relying on transcriptionally controlled reporter gene have been developed and are suited to monitoring the cellular responses induced by GPCRs. Since CRE is a pivotal target in GPCR signaling pathways, it has become one of the most widely used response elements in reporter gene assays. The cAMP response element binding protein (CREB), a transcription factor, is the major regulator of CREs. It can be activated (phosphoryl-ated) by protein kinase A (PKA) and members of calcium/calmodulin kinase (CaMK) family in vitro. Both Gαs- and Gαq-coupled receptors are signaled through CREs[12,15,16]. Since the transcription of CRE-SEAP reporter genes is controlled by CRE-containing promoters, CRE-SEAP activity can be used to monitor the activation of receptors. In the present study, the EC50 value obtained using CRE-SEAP activity assay is similar to that obtained from cAMP accumulation assay. These results suggest that CRE-SEAP activity assay can be used to estimate the Gαs-coupled receptor function.
Gαs-coupled receptors activate adenylyl cyclase, leading to an increase in cAMP level. cAMP activates PKA, which subsequently phosphorylates different targets. This pathway can lead to an increase in intracellular [Ca2+] either from intracellular Ca2+ stores or from the extracellular matrix[13,17]. Direct activation of Ca2+ ion channels by Gαs is also possible[13,18]. We found that a significant difference was observed in the EC50 value of the intracellular calcium assay and cAMP accumulation assay. While the EC50 value to induce the cAMP accumulation was 0.25 (0.12–0.53) µmol/L, the EC50 value to induce an increase in the intracellular calcium was 27 (8.6–70) nmol/L. This is likely to reflect the difference in signaling between intracellular calcium increase and cAMP accumulation. Intracellular calcium signals may be directly transduced, bypassing the adenylyl cyclase pathway and representing transient binding with ligand. Therefore, combination CRE-SEAP activity assay or a cAMP accumulation assay with an intracellular calcium assay will obtain more information on the effect of ligands. Our study demonstrates that the CRE-SEAP activity assay and intracellular calcium assay are suitable for high-throughput screening in drug research.
Footnote
Project supported by the National Natural Science Foundation of China (N
References
- Goldman-Rakic PS. The cortical dopamine system: role in memory and cognition. Adv Pharmacol 1998;42:707-11.
- Schultz W. Getting formal with dopamine and reward. Neuron 2002;36:241-63.
- Yelnik J. Functional anatomy of the basal ganglia. Mov Disord 2002;17 Suppl 3:S15-S21.
- Nicola SM, Surmeier J, Malenka RC. Dopaminergic modulation of neuronal excitability in the striatum and nucleus accumbens. Annu Rev Neurosci 2000;23:185-215.
- Missale C, Nash SR, Robinson SW, Jaber M, Caron MG. Dopamine receptors: from structure to function. Physiol Rev 1998;78:189-225.
- Zhou QY, Grandy DK, Thambi L, Kushner JA, Van Tol HH, Cone R, et al. Cloning and expression of human and rat D1 dopamine receptors. Nature 1990;347:76-80.
- Knight PJ, Pfeifer TA, Grigliatti TA. A functional assay for G-protein-coupled receptors using stably transformed insect tissue culture cell lines. Anal Biochem 2003;320:88-103.
- Okun I, Veerapandian P. New methods to mimic nature in high-throughput screening. Nat Biotechnol 1997;15:287-8.
- Dove A. Drug screening — beyond the bottleneck. Nat Biotechnol 1999;7:859-63.
- Sorensen K, Brodbeck U. Assessment of coating-efficiency in ELISA plates by direct protein determination. J Immunol Methods 1986;95:291-3.
- Nordstedt C, Fredholm BB. A modification of a protein-binding method for rapid quantification of cAMP in cell-culture supernatants and body fluid. Anal Biochem 1990;189:231-4.
- Durocher Y, Perret S, Thibaudeau E, Gaumond MH, Kamen A, Stocco R, et al. A reporter gene assay for high-throughput screening of G-protein-coupled receptors stably or transiently expressed in HEK293 EBNA cells grown in suspension culture. Anal Biochem 2000;284:316-26.
- Kassack MU, Hofgen B, Lehmann J, Eckstein N, Quillan JM, Sadee W. Functional screening of G protein-coupled receptors by measuring intracellular calcium with a fluorescence microplate reader . J Biomol Screen 2002;7:233-46.
- Johnson RA, Salomon Y. Assay of adenylyl cyclase catalytic activity. Methods Enzymol 1991;195:3-21.
- Chen W, Shields TS, Stork PJ, Cone RD. A colorimetric assay for measuring activation of Gs- and Gq-coupled signaling pathways. Anal Biochem 1995;226:349-54.
- Stratowa C, Himmler A, Czernilofsky AP. Use of a luciferase reporter system for characterizing G-protein-linked receptors. Curr Opin Biotechnol 1995;26:574-81.
- Pieroni JP, Jacobowitz O, Chen JQ, Lyengar R. Signal recognition and integration by GS-stimulated adenylyl cyclases. Curr Opin Neurobiol 1993;3:345-51.
- Hescheler J, Schultz G. G-proteins involved in the calcium channel signalling system. Curr Opin Neurobiol 1993;3:360-7.